

Abstract
The lack of effective treatments for Alzheimer’s disease (AD) is alarming considering the number of people currently affected by this disorder and the projected increase over the next few decades. Elevated homocysteine levels double the risk of developing AD. Choline, a primary dietary source of methyl groups, converts homocysteine to methionine and reduces age-dependent cognitive decline. Here, we tested the transgenerational benefits of maternal choline supplementation (ChS; 5.0 g/kg choline chloride) in two generations (Gen) of APP/PS1 mice. We first exposed 2.5-month-old mice to the ChS diet and allowed them to breed with each other to generate Gen-1 mice. Gen-1 mice were exposed to the ChS diet only during gestation and lactation; once weaned at postnatal day 21, Gen-1 mice were then kept on the control diet for the remainder of their life. We also bred a subset of Gen-1 mice to each other and obtained Gen-2 mice; these mice were never exposed to ChS. We found that ChS reduced Aβ load and microglia activation, and improved cognitive deficits in old Gen-1 and Gen-2 APP/PS1 mice. Mechanistically, these changes were linked to a reduction in brain homocysteine levels in both generations. Further, RNA-Seq data from APP/PS1 hippocampal tissue revealed that ChS significantly changed the expression of 27 genes. These genes were enriched for inflammation, histone modifications, and neuronal death functional classes. Our results are the first to demonstrate a transgenerational benefit of ChS and suggest that modifying the maternal diet with additional choline reduces AD pathology across multiple generations.
INTRODUTION
The prevalence of Alzheimer’s disease (AD) is anticipated to increase significantly over the next few decades1. This is alarming given that no effective treatment options are available to prevent, treat or manage AD. Thus, there is an unmet and urgent need to develop new therapeutic approaches to mitigate this disorder.
Environmental factors such as diet are associated with AD risk2, 3 and dietary interventions have been tested in patients with some success. For instance, patients following the Mediterranean-Dietary Approaches to Stop Hypertension (DASH) diet for 4.5 years had significantly lower rate of AD by 54%4. A more recent clinical study using 70 subjects found that consumption of a Mediterranean diet reduced Aβ-amyloid load5. These results highlight how nutritional interventions may be key to reducing the development of AD pathogenesis; however, more work is necessary to understand the mechanisms by which dietary interventions lower AD pathology.
Homocysteine (Hcy) is a neurotoxic amino acid that accumulates in various neurological disorders, including AD6–8. Notably, elevated plasma Hcy doubles the risk of developing AD and dementia9, 10. Recent studies suggest that Hcy induces cognitive and memory decline by increasing neuronal calcium influx that promotes amyloid and tau protein accumulation, apoptosis, and neuronal death6, 11, 12. Consistent with these observations, increasing Hcy exacerbates Aβ pathology in animal models of AD13, 14. Thus, reducing Hcy may be a valid approach to mitigate AD pathology.
Choline, a nutrient part of the vitamin B complex, converts Hcy to methionine15, 16. Increasing choline intake during gestation and lactation improves cognition in mouse models of Down syndrome17–19. However, it has yet to be determined if maternal choline supplementation (ChS) improves cognitive deficits and reduces brain Hcy levels in mouse models of AD. Additionally, it has yet to be determined whether the benefits of maternal ChS are transgenerational. To this end, there is growing literature suggesting that specific dietary compounds induce benefits that may persist across multiple generations20, 21.
Materials and Methods
Animals and behavioral testing.
We have backcrossed the APP/PS1 mice22 for 12 generations into a pure 129/SvJ background. All protocols were approved by the Institutional Animal Care and Use Committee of Arizona State University. Both male and female APP/PS1 mice were used for breeding and testing. The Morris water maze task was conducted as previously described23, 24.
Diet Regimen and sample size
We exposed 2.5-month-old NonTg and APP/PS1 breeders to either a control (CTL) diet containing 1.1 g/kg of choline or to a choline supplemented (ChS) diet containing 5.0 g/kg of choline (Fig. 1a). The concentration of choline was obtained from previous publications17–19. The offspring (Gen-1) were exposed to either the CTL or ChS diet during gestation and lactation (until postnatal day 21), and then kept on the CTL diet for the remainder of their lives: (i) APP/PS1 CTL = 18, (ii) NonTg CTL = 26, (iii) APP/PS1 ChS = 24, (iv) NonTg ChS = 17. The sample size was chosen based on previous experience performing similar experiments in these mice. We bred a subset of Gen-1 mice with each other and obtained Gen-2, which were never exposed to ChS (Fig. 1b): (i) APP/PS1 CTL-CTL = 17, (ii) NonTg CTL-CTL = 20, (iii) APP/PS1 ChS-CTL = 15, and (iv) NonTg ChS-CTL = 14. The ChS-CTL mice were derived from mothers who were exposed to ChS during gestation and lactation. The CTL-CTL mice were derived from mothers who were never exposed to ChS. The behavior experiments were performed in all mice. Mice were randomly selected for the gene expression, biochemical and histological analyses and n’s are shown in the corresponding results section.
Figure 1. Maternal ChS ameliorates spatial memory deficits and reduces Aβ pathology.

(a-b) Experimental design. Gen-1 offspring were exposed to either the CTL or ChS diet during gestation and lactation and kept on the CTL diet for the remainder of their lives. Mice were behaviorally tested on the MWM at 12 months of age. Gen-2 mice were never exposed to ChS and were on the CTL diet for their entire lives. These mice were tested on the MWM task at 14.5 months of age. (c) Body weight of 12-month-old Gen-1 mice. (d-e) Distance traveled and escape latency to the platform during the learning phases of the MWM. (f-h) Probe trials for the MWM. (i-j) Sections from APP/PS1 mice stained with an Aβ42-specific antibody. (k) Quantitative analysis of the Aβ42 load. (l-m) ELISA measurements for soluble and insoluble Aβ. (n-q) Western blot and quantitative analyses showing APP, C83 and C99. Data are presented as box plots. The center line represents the median value, the limits represent the 25th and 75th percentile, and the whiskers represent the minimum and maximum value of the distribution. * p < 0.05, ** p < 0.01.
Western blots, ELISA, and Immunohistochemistry.
Western blots were performed under reducing conditions as we previously detailed25. To asses soluble and insoluble levels of Aβ, we used the Life Technologies ELISA kit as previously described26. The immunohistochemistry was performed as we previously described26.
Antibodies.
The following antibodies were purchased from Abcam: BHMT (#ab96415), CD68 (#ab955), Rbm25 (#ab72237), Synaptophysin (#ab32127). Cell signaling: β-actin (#4967), Pin1 (#3722), PSD95 (#3409). Millipore: anti-Aβ42 (#5078P), 6E10 (#MAB1560), APP C-terminal (#171610). Santa Cruz Biotechnology: H2-Ab1 (#sc-71201). Wako: Iba1 (NCNP24).
Homocysteine and methionine detection in the brain.
Hemispheres were homogenized and processed using Liquid Chromatography-Mass Spectrometry as previously described27, 28.
RNA sequencing and differential expression.
RNA was isolated from the hippocampus using the RNeasy Kit (Qiagen). Sequencing libraries were prepared with 250 ng of total RNA using TruSeq Stranded Total RNA with Ribo-Zero Gold Kit (Illumina Inc). PCR-enriched fragments were validated on a 2200 Tapestation (Agilent Technologies) and quantitated via qPCR. The final library was sequenced by 50bp paired-end sequencing on a HiSeq 2500 (Illumina). The reads were aligned to the mouse reference genome (mm9 build 37) as described in29. Outliers and batch effects detection were conducted through Principal Component Analysis (PCA). Gene expression differential analyses were performed using the R-package DESeq2 v1.14.130. Raw RNA-Seq data will be publicly available on Gene Expression Omnibus repository.
Enrichment and protein-protein interaction network analyses.
Pathway enrichments were assessed using KEGG31, Panther32, and REACTOME33. Gene Ontology enrichment was conducted using the same statistical method as for the pathways34. All the results were corrected with the Bonferroni’s method, considering pathways significant at adj p < 0.01.
We conducted a Network Topology-based analysis (NTA) using the Network Expansion method35 referencing to BioGRID 3.4 database (https://thebiogrid.org/) and setting the number of top-ranking neighbors to 10. The generated network was investigated for enriched Gene Ontology classes, correcting the p-values with the FDR method36. The NTA was conducted using WEBGESTALT37.
Statistical analyses.
Repeated measures ANOVAs were used to analyze the behavioral experiments followed by Bonferroni’s corrected post hoc tests when appropriate. Two-way factorial ANOVAs were used to analyze probe trial dependent measures, body weight, western blot, Hcy, and methionine levels. Student’s unpaired t-tests were employed for comparison of APP/PS1 mice within each generation. Examination of descriptive statistics revealed no violation of any test assumptions necessitating use of statistical test other than the ones used. For all analyses, the variance was approximately the same among groups.
RESULTS
Maternal ChS ameliorates spatial memory deficits and amyloid pathology in APP/PS1 mice.
We assessed body weight in 12-month-old Gen-1 mice and found that APP/PS1 mice were heavier (38.53 ± 1.762g) than NonTg mice [31.95 ± 2.002g; F(1, 81) = 12.224, p < 0.01]. These changes were independent of the diet (Fig. 1c). We then tested 12-month-old Gen-1 mice on the Morris water maze (MWM). For the five-day learning phase, we found a significant effect of day for distance traveled (F (1, 4) = 32.967, p < 0.0001; Fig. 1d) and escape latency (F(1, 4) = 29.714, p < 0.0001; Fig. 1e) to the platform, indicating that all groups learned at the same pace. On day 6, we performed a probe trial and found a significant genotype by diet interaction for platform crossings (F(1, 81) = 4.308, p < 0.05; Fig. 1f) and latency to first cross the platform location (F (1, 81) = 4.840, p < 0.05; Fig. 1g). Post-hoc analyses revealed that APP/PS1 ChS mice performed significantly better than APP/PS1 CTL mice and as well as the NonTg groups in both measurements (p < 0.05). Lastly, we found no significant differences in swim speed on day 6 of testing among the four groups (Fig. 1h). These results demonstrate that maternal ChS improves spatial reference memory deficits in adult APP/PS1 mice.
We immunostained sections from Gen-1 APP/PS1 CTL and APP/PS1 ChS (n = 6/group) mice with an Aβ42-specific antibody. We found a 44.01 ± 21.69% decrease of Aβ load within the hippocampus of ChS mice compared with the CTL counterparts (t(10) = 19.739, p < 0.01 ; Fig. 1i–k). We measured Aβ levels by sandwich ELISA and APP processing by western blot. Soluble and insoluble Aβ40 and Aβ42 levels were significantly lower in ChS mice compared to the CTL mice (soluble Aβ40: t(10) = 16.408, p < 0.01; soluble Aβ42: t(10) = 14.438, p < 0.01; insoluble Aβ40: t(10) = 9.863, p < 0.05; insoluble Aβ42: t(10) = 6.727, p < 0.05; Fig. 1l–m). While APP and C83 levels were similar between the two groups, C99 levels were lower in APP/PS1 ChS mice (t(10) = 11.014, p < 0.01; Fig. 1n–q). These results are consistent with a recent report showing that maternal ChS reduces Aβ levels. 38
To determine the effects of ChS on synaptic function, we measured the levels of the synaptic markers synaptophysin and PSD95. Synaptophysin levels were similar among the four groups in Gen-1 and Gen-2 (Supplementary Fig. 1a–b). In contrast, in Gen-1 there was a significant genotype by diet interaction for PSD95 (F (1, 20) = 4.400, p < 0.05; Supplementary Fig. 1a, c). Post hoc analyses indicated that the APP/PS1 ChS mice had significantly higher levels of PSD95 than APP/PS1 CTL mice (p < 0.05). In Gen-2, we found a significant main effect of diet for PSD95 (F(1, 20) = 4.590, p < 0.05; Supplementary Fig. 1d–f), which indicated that ChS-CTL mice had significantly higher levels of PSD95 than the CTL-CTL counterparts.
Transgenerational effects of ChS on AD-like pathology
To determine the transgenerational effect of ChS, we used 14.5-month-old Gen-2 mice. We found a significant difference in body weight between APP/PS1 (37.559 ± 2.073g) and NonTg mice (30.394 ± 1.532g; F(1, 62) = 12.737, p < 0.01; Fig. 2a). This difference was independent of diet. We then tested Gen-2 mice in the MWM. During learning, we found a significant effect of day for distance traveled (F(1, 4) = 12.021, p < 0.0001; Fig. 2b) and for escape latency to the platform location (F(1, 4) = 25.598, p < 0.0001, Fig. 2c). Notably, we found a significant effect of diet for escape latency (F(1, 62) = 4.213, p < 0.05; Fig. 2c), indicating that the ChS-CTL mice learned faster. On the day 6 probe trial, there were no statistically significant differences among the groups for all measurements (Fig. 2d–f).
Figure 2. Reduced AD-like pathology in Gen-2 mice.

(a) Body weight of 14.5-month-old Gen-2 mice. (b–c) Distance traveled and escape latency to the platform during the learning phases of the MWM. (d–f) Probe trials for the MWM. (g–h) Sections from APP/PS1 mice stained with an Aβ42-specific antibody. (i) Quantitative analysis of the Aβ42 load. (j–k) Soluble and insoluble Aβ levels, measured by ELISA. (l–o) Western blot and quantitative analyses showing APP, C83 and C99. Data are presented as box plots. The center line represents the median value, the limits represent the 25th and 75th percentile, and the whiskers represent the minimum and maximum value of the distribution. * p < 0.05, ** p < 0.01.
At the end of the behavioral testing, we immunostained sections from Gen-2 APP/PS1 CTL-CTL and APP/PS1 ChS-CTL (n = 6/group) mice with an Aβ42-specific antibody (Fig. 2g–h). There was a 29.37 ± 21.03% decrease in Aβ42 plaque load in APP/PS1 ChS-CTL mice compared with APP/PS1 CTL-CTL mice (t(10) = 7.627, p < 0.05; Fig. 2i). Next, we measured Aβ levels by sandwich ELISA and found that soluble Aβ40 levels (t(10) = 7.937, p < 0.05), insoluble Aβ40 (t(10) = 5.648, p < 0.05), and insoluble Aβ42 levels (t(10) = 7.937, p < 0.05) were significantly lower in APP/PS1 ChS-CTL mice compared to APP/PS1 CTL-CTL mice (Fig. 2j–k). No significant differences were detected for soluble Aβ42 levels (Fig. 2j), full-length APP, C99, and C83 (Fig. 2l–o). Although further experiments are needed to address this difference, it is tempting to speculate that the effects of ChS are stronger in the Gen-1 mice because these mice were directly exposed to ChS during gestation and lactation, compared to Gen-2 mice. Indeed, the latter group was never directly exposed to the ChS diet.
ChS alters the gene expression profile in key signaling pathways.
We performed RNA sequencing (RNA-Seq) using the hippocampus of 12-month-old Gen-1 APP/PS1 CTL (n = 8) and APP/PS1 ChS mice (n = 9). We found 27 differentially expressed genes between the two groups (Supplementary Table 1). To validate the RNA-Seq data, we measured three randomly-selected genes by qRT-PCR: Pin1, H2-Ab1 and Rbm25. Consistent with the RNA-Seq data, we found a significant upregulation of Pin1 (p = 0.048) and downregulation of H2-Ab1 (p = 0.034) and Rbm25 (p = 0.041) in APP/PS1 ChS compared to APP/PS1 CTL mice (Fig. 3a). We also measured the steady-state levels of these proteins in both Gen-1 and Gen-2 APP/PS1 mice (n = 6/group) and found a significant upregulation of Pin1 protein levels in Gen-1 APP/PS1 ChS (t(10) = 5.388, p < 0.05, Fig. 3b–c) mice compared to CTL counterparts. We also found a significant downregulation of H2-Ab1 (t(10) = 6.632, p < 0.05) and Rbm25 (t(10) = 5.352, p < 0.05) in Gen-1 APP/PS1 ChS mice compared to CTL (Fig. 3b–c). We found consistent results in Gen 2 [Pin1: t(10) = 5.292, p < 0.05; H2-Ab1: t(10) = 5.153, p < 0.05; Rbm25: t(10) = 6.054, p < 0.05; Fig. 3b, d]. These results highlight consistent changes in protein levels in both Gen-1 APP/PS1 ChS and Gen-2 APP/PS1 ChS-CTL mice.
Figure 3. Validation of altered hippocampal gene expression and protein-protein network analysis in APP/PS1 mice.

(a–d) qRT-PCR data and western blot analyses for Pin1, H2-Ab1, and Rbm25. (e–g) Protein-Protein Network analyses that included (e) the 27 genes that were differentially expressed, (f) the 19 genes that were significantly downregulated and (g) the genes that were significantly upregulated. The large circles are the input genes (differentially expressed genes in our input list), while the others are top-ranking neighbors. Data are presented as box plots. The center line represents the median value, the limits represent the 25th and 75th percentile, and the whiskers represent the minimum and maximum value of the distribution. * p < 0.05.
To determine the functional profile of our gene set, we performed a Gene Ontology analysis. We obtained a total of 57 enriched processes (adj p < 0.01) with a range of 4 to 8 genes included in each process. For each Gene Ontology category, we observed that immune-related processes were most significantly enriched, namely “peptide antigen binding” (adj p = 5.59E-06), “negative regulation of immune system process” (adj p = 1.96E-04), and “major histocompatibility complex proteins” (adj p = 1.00E-08) (Supplementary Table 2). We next performed pathway analyses and obtained a total of 22 enriched pathways, which also showed a prevalence of immune system related processes (Supplementary Table 3). We then analyzed the upregulated (n = 8) and downregulated (n = 19) gene sets independently. When we only analyzed the upregulated genes, we did not identify any significant processes. In contrast, when we only analyzed the downregulated genes, we identified the same significant processes that we identified when we included all 27 genes (Supplementary Tables 4–5). This suggests that the downregulated genes drive the Gene Ontology results.
Using a protein-protein interaction analysis, we obtained an expanded sub-network of 14 genes, including 4 of the input genes from the initial 27 differentially expressed genes (Pin1, Rpl19, Rbm25, and H2-Ab1). The network was enriched for two Gene Ontology processes related to “neuron death” (FDR adj p < 0.05; Fig. 3e, Supplementary Table 6). We repeated the analysis using only the downregulated genes (n = 19) and obtained an extended subnetwork of 11 genes, including two input genes (Rbm25 and RunX1; Fig. 3f). This network was significantly enriched for Gene Ontology processes related to histone and chromatin modification, histone deacetylation and gene expression regulation (FDR adj p < 0.01; Supplementary Table 7). We repeated the network analysis including the upregulated genes (n = 8) and found an extended sub-network weakly enriched in Gene Ontology processes related to neuronal death (FDR adj p < 0.05; Fig. 3g, Supplementary Table 8). These results illustrate that maternal ChS alters gene expression throughout life, predominantly those genes involved in the brain immune response, histone modifying processes and regulation of neuronal death.
Transgenerational reduction of activated microglia in APP/PS1 mice.
We examined microglia activation by double-staining tissue with an antibody against Iba1, a marker of total microglia, and CD68, a lysosomal marker (n = 3 /group). The levels of CD68 are increased in activated microglia39. Thus, CD68 and Iba1 colocalization signals can be used to determine the ratio of activated versus total microglia. In Gen-1 mice, we found a significant reduction in microglia activation as indicated by a decreased intensity of yellow pixels of CD68/Iba1 colocalization in the ChS mice (t(4) = 3.562, p < 0.05, Fig. 4a–b). In Gen-2 mice, microglia activation was reduced in APP/PS1 ChS-CTL mice compared to CTL-CTL counterparts (t(4) = 3.787, p < 0.05, Fig. 4c–d).
Figure 4. Transgenerational reduction of activated microglia in APP/PS1 mice.
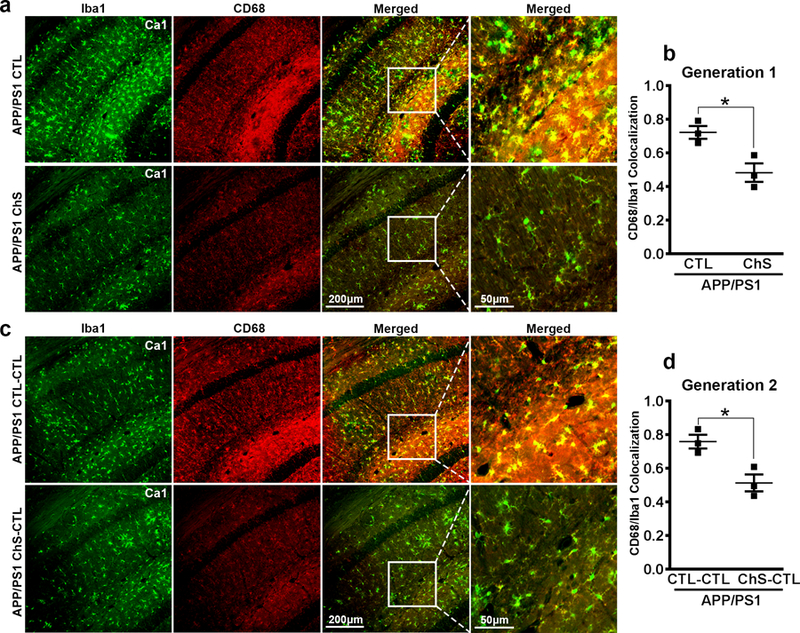
(a, c) Photomicrographs of hippocampal tissue from Gen-1 and Gen-2 APP/PS1 mice fluorescently stained for Iba1 and CD68. (b, d) Quantitative analysis of CD68/Iba1 colocalization. Data are presented as scatterplots with mean ± SE. * p < 0.05.
Transgenerational reduction of brain Hcy levels in APP/PS1 mice.
High Hcy levels double the risk of developing AD and dementia7, 9, and increase Aβ aggregation6, 7, 14, 40. Hcy is converted to methionine through betaine-homocysteine-methyl-transferase (BHMT)9. We used liquid chromatography-mass spectrometry to measure the brain Hcy and methionine levels (n = 6/group). In Gen-1 mice, we found a significant effect of diet where the ChS groups had significantly lower Hcy levels than the CTL groups (F(1, 20) = 10.059, p < 0.01, Fig. 5a). We also found a significant genotype by diet interaction for Hcy (F(1, 20) = 6.984, p < 0.05, Fig. 5a). Post-hoc analysis revealed that the APP/PS1 ChS mice had a 56.27 ± 21.34% reduction in brain Hcy levels compared to the APP/PS1 CTL mice (p < 0.05). Notably, there were no significant differences between the APP/PS1 ChS and NonTg CTL mice. Consistent with these results, we found that ChS groups had significantly higher levels of methionine than the CTL groups (F(1,20) = 21.403, p < 0.001, Fig. 5b). Next, we measured the expression levels of BHMT (n=4 for CTL and CTL-CTL/genotype; n = 5 for ChS and ChS-CTL/genotype) and found that both APP/PS1 (t(7) = 5.851, p < 0.05, Fig. 5c, d) and NonTg ChS mice (t(7) = 8.709, p < 0.05, Fig. 5c, e) had significantly higher expression of this enzyme than the CTL counterparts. In Gen-2 mice, we found a significant effect for diet where Hcy levels were lower in the ChS-CTL groups than the CTL-CTL groups (F(1, 20) = 17.852, p < 0.001; Fig. 5f). Additionally, we found a significant genotype by diet interaction (F(1, 20) = 5.059, p < 0.05; Fig. 5f). Post-hoc analysis revealed that APP/PS1 ChS-CTL mice, whose parents were exposed to ChS, show a 35.21 ± 8.25% reduction in brain Hcy levels compared to the APP/PS1 CTL-CTL mice (p < 0.05). We also found a significant effect of diet for methionine levels where ChS-CTL groups had significantly higher levels than the CTL-CTL groups (F(1, 19) = 8.876, p < 0.01; Fig. 5g), and a significant genotype by diet interaction (F(1, 19) = 13.976, p < 0.01 ; Fig. 5g). Post-hoc analysis revealed that APP/PS1 ChS-CTL mice show a significant increase in brain methionine levels compared to the APP/PS1 CTL-CTL mice (p < 0.05). Consistent with the Hcy data, BHMT levels were increased in APP/PS1 (t(7) = 8.709, p < 0.05, Fig. 5h–i) and NonTg ChS-CTL mice (t(7) = 10.398, p < 0.05, Fig. 5h, j).
Figure 5. Transgenerational reduction of brain homocysteine by altering methionine cycle.

Transgenerational reduction of brain homocysteine by altering methionine cycle. (a–b) Hcy and methionine levels in Gen-1 mice. (c–e) Western blot analysis of betaine-homocysteine-methyltransferase (BHMT) in Gen-1 mice. (f–g) Hcy and methionine levels in Gen-2 mice. (h–i) Western blot analysis for BHMT in Gen2 mice. For box plots the center line represents the median value, the limits represent the 25th and 75th percentile, and the whiskers represent the minimum and maximum value of the distribution. For scatterplots, data are presented as mean ± SE. *p < 0.05, **p < 0.01, ***p < 0.001
DISCUSSION
Our results show that maternal ChS produces life-long improvements in cognition and AD-like pathology. We demonstrate a reduction in AD-like pathology in Gen-2 APP/PS1 mice, which were never exposed to ChS, highlighting the transgenerational effect of choline. The decline in AD pathology was associated with a decrease in brain Hcy levels. This is remarkable as high Hcy levels double the AD risk and facilitate Aβ aggregation 6,9. We further show that maternal ChS alters the expression of genes within networks involved in brain immune response, histone modifications and regulation of neuronal death months following the initial supplementation. Consistent with the changes in the expression of genes linked to the immune response, we find reduced microglia activation in both APP/PS1 generations. The changes in the expression of genes involved in histone modification could explain the long-lasting effects observed in Gen-1 and the transgenerational effects of ChS.
Our results show that ChS reduced Aβ pathology in both generations of APP/PS1 mice who were directly or indirectly exposed to ChS. This is consistent with one report indicating that early gestation ChS reduces amyloidosis in APP/PS1 mice [38]. We also find that ChS improves spatial memory in Gen-1 APP/PS1 mice and spatial learning in Gen-2 ChS-CTL NonTg and APP/PS1 mice. While this could appear as a discrepancy, it must be noted that the Gen-1 mice were behaviorally tested at 12 months of age while Gen-2 mice were tested at 14.5 months of age. 12-month-old APP/PS1 CTL mice are not impaired in spatial learning; thus, at this age, there is no deficit to improve. However, 14.5-month-old APP/PS1 CTL-CTL were significantly impaired compared to age-matched NonTg CTL-CTL mice. Under these conditions, ChS rescued learning deficits.
Our results show a transgenerational reduction of brain Hcy levels with maternal ChS. Substantial evidence indicates that high Hcy levels are toxic and increase Aβ aggregation41–43. Specifically, homocysteine binds to Aβ and facilitates its aggregation and accumulation. Thus, it is tempting to speculate that the reduced Aβ levels in the APP/PS1 mice exposed to ChS are linked to lower homocysteine levels, which in turn reduce Aβ aggregation and accumulation. It is also plausible that reduced microglia activation may contribute to lower Aβ levels in APP/PS1 mice.
Choline converts homocysteine to methionine through the donation of methyl groups by choline’s metabolite, betaine15,16. During development, choline is a primary dietary source of methyl groups to produce S-adenosylmethionine, which is a substrate for epigenetic mechanisms44, 45. Enriching the pool of methyl donors in early development leads to changes in epigenetic patterns that can be inherited through cell replication and persist throughout multiple generations44. For example, Waterland and colleagues found that a high methyl donor diet was sufficient to prevent the transgenerational amplification of obesity in an obesity-prone mouse; benefits that were seen in two subsequent generations21. Notably, our results show downregulation of genes involved in histone modifications and chromatin remodeling suggesting that maternal ChS may have induced alterations in gene expression that led to reductions in brain Hcy and AD-pathology.
In conclusion, the present study demonstrates that supplementing the maternal diet with additional choline improves spatial memory and reduces Aβ pathology in APP/PS1 mice. The reduction in AD pathology is associated with decreased brain Hcy levels. Remarkably, we provide compelling evidence that maternal ChS also produces transgenerational benefits. If these findings generalize to humans, ChS may help mitigate the estimated increased prevalence rate of this insidious disease. Moreover, because the animal literature indicates beneficial effects of ChS for normal cognitive aging46, 47, and recent evidence shows benefits in humans48, this type of nutritional advice could be given to the general population, thereby providing substantial benefits of cognitive function throughout life.
Supplementary Material
Acknowledgments
This work was supported by grants to S.O. from the National Institute of Aging (2R01AG037637–07) and R.V. from the National Science Foundation (1606833).
Footnotes
Conflict of Interest
The authors have no conflict of interest.
References
- 1.Association As. 2018 Alzheimer’s Association disease facts and figures. Alzheimer’s & Dementia: The Journal of the Alzheimer’s Association 2018; 14: 367–429. [Google Scholar]
- 2.Dosunmu R, Wu J, Basha MR, Zawia NH. Environmental and dietary risk factors in Alzheimer’s disease. Expert Rev Neurother 2007; 7(7): 887–900. [DOI] [PubMed] [Google Scholar]
- 3.Hu N, Yu JT, Tan L, Wang YL, Sun L, Tan L. Nutrition and the risk of Alzheimer’s disease. Biomed Res Int 2013; 2013: 524820. [DOI] [PMC free article] [PubMed] [Google Scholar]
- 4.Morris MC, Tangney CC, Wang Y, Sacks FM, Bennett DA, Aggarwal NT. MIND diet associated with reduced incidence of Alzheimer’s disease. Alzheimer’s & Dementia: The Journal of the Alzheimer’s Association 2015; 11(9): 1007–1014. [DOI] [PMC free article] [PubMed] [Google Scholar]
- 5.Berti V, Walters M, Sterling J, Quinn CG, Logue M, Andrews R et al. Mediterranean diet and 3-year Alzheimer brain biomarker changes in middle-aged adults. Neurology 2018; 90(20): e1789–e1798. [DOI] [PMC free article] [PubMed] [Google Scholar]
- 6.Li J-G, Chu J, Barrero C, Merali S, Praticó D. Homocysteine Exacerbates β-Amyloid Pathology, Tau Pathology, and Cognitive Deficit in a Mouse Model of Alzheimer Disease with Plaques and Tangles. Annals of neurology 2014; 75(6): 851–863. [DOI] [PMC free article] [PubMed] [Google Scholar]
- 7.Morris MS. Homocysteine and Alzheimer’s disease. The Lancet Neurology 2003; 2(7): 425–428. [DOI] [PubMed] [Google Scholar]
- 8.Isobe C, Murata T, Sato C, Terayama Y. Increase of total homocysteine concentration in cerebrospinal fluid in patients with Alzheimer’s disease and Parkinson’s disease. Life Sciences 2005; 77(15): 1836–1843. [DOI] [PubMed] [Google Scholar]
- 9.Shen L, Ji H-F. Associations between Homocysteine, Folic Acid, Vitamin B12 and Alzheimer’s Disease: Insights from Meta-Analyses. Journal of Alzheimer’s disease: JAD 2015; 46(3): 777–790. [DOI] [PubMed] [Google Scholar]
- 10.Whalley LJ, Duthie SJ, Collins AR, Starr JM, Deary IJ, Lemmon H et al. Homocysteine, antioxidant micronutrients and late onset dementia. European Journal of Nutrition 2014; 53(1): 277–285. [DOI] [PubMed] [Google Scholar]
- 11.Obeid R, Herrmann W. Mechanisms of homocysteine neurotoxicity in neurodegenerative diseases with special reference to dementia. FEBS Letters 2006; 580(13): 2994–3005. [DOI] [PubMed] [Google Scholar]
- 12.Ho PI, Collins SC, Dhitavat S, Ortiz D, Ashline D, Rogers E et al. Homocysteine potentiates β-amyloid neurotoxicity: role of oxidative stress. Journal of Neurochemistry 2001; 78(2): 249–253. [DOI] [PubMed] [Google Scholar]
- 13.Zhuo J-M, Portugal GS, Kruger WD, Wang H, Gould TJ, Pratico D. Diet-induced hyperhomocysteinemia increases amyloid-beta formation and deposition in a mouse model of Alzheimer’s disease. Current Alzheimer Research 2010; 7(2): 140–149. [DOI] [PMC free article] [PubMed] [Google Scholar]
- 14.Pacheco-Quinto J, Rodriguez de Turco EB, DeRosa S, Howard A, Cruz-Sanchez F, Sambamurti K et al. Hyperhomocysteinemic Alzheimer’s mouse model of amyloidosis shows increased brain amyloid beta peptide levels. Neurobiology of Disease 2006; 22(3): 651–656. [DOI] [PubMed] [Google Scholar]
- 15.Olthof M J Brink E, B Katan M, Verhoef P. Choline supplemented as phosphatidylcholine decreases fasting and postmethionine-loading plasma homocysteine concentrations in healthy men, vol. 822005, 111pp. [DOI] [PubMed] [Google Scholar]
- 16.Steenge GR, Verhoef P, Katan MB. Betaine supplementation lowers plasma homocysteine in healthy men and women. The Journal of Nutrition 2003; 133(5): 1291–1295. [DOI] [PubMed] [Google Scholar]
- 17.Ash JA, Velazquez R, Kelley CM, Powers BE, Ginsberg SD, Mufson EJ et al. Maternal choline supplementation improves spatial mapping and increases basal forebrain cholinergic neuron number and size in aged Ts65Dn mice. Neurobiology of Disease 2014; 70: 32–42. [DOI] [PMC free article] [PubMed] [Google Scholar]
- 18.Powers BE, Kelley CM, Velazquez R, Ash JA, Strawderman MS, Alldred MJ et al. Maternal choline supplementation in a mouse model of Down syndrome: Effects on attention and nucleus basalis/substantia innominata neuron morphology in adult offspring. Neuroscience 2017; 340: 501–514. [DOI] [PMC free article] [PubMed] [Google Scholar]
- 19.Velazquez R, Ash JA, Powers BE, Kelley CM, Strawderman M, Luscher ZI et al. Maternal choline supplementation improves spatial learning and adult hippocampal neurogenesis in the Ts65Dn mouse model of Down syndrome. Neurobiology of Disease 2013; 58: 92–101. [DOI] [PMC free article] [PubMed] [Google Scholar]
- 20.Waterland RA, Jirtle RL. Transposable elements: targets for early nutritional effects on epigenetic gene regulation. Molecular and Cellular Biology 2003; 23(15): 5293–5300. [DOI] [PMC free article] [PubMed] [Google Scholar]
- 21.Waterland RA, Travisano M, Tahiliani KG, Rached MT, Mirza S. Methyl donor supplementation prevents transgenerational amplification of obesity. International Journal of Obesity (2005) 2008; 32(9): 1373–1379. [DOI] [PMC free article] [PubMed] [Google Scholar]
- 22.Jankowsky JL, Fadale DJ, Anderson J, Xu GM, Gonzales V, Jenkins NA et al. Mutant presenilins specifically elevate the levels of the 42 residue beta-amyloid peptide in vivo: evidence for augmentation of a 42-specific gamma secretase. Hum Mol Genet 2004; 13(2): 159–170. [DOI] [PubMed] [Google Scholar]
- 23.Caccamo A, Ferreira E, Branca C, Oddo S. p62 improves AD-like pathology by increasing autophagy. Molecular Psychiatry 2017; 22(6): 865–873. [DOI] [PMC free article] [PubMed] [Google Scholar] [Retracted]
- 24.Velazquez R, Ferreira E, Tran A, Turner EC, Belfiore R, Branca C et al. Acute tau knockdown in the hippocampus of adult mice causes learning and memory deficits. Aging Cell 2018: e12775. [DOI] [PMC free article] [PubMed]
- 25.Velazquez R, Tran A, Ishimwe E, Denner L, Dave N, Oddo S et al. Central insulin dysregulation and energy dyshomeostasis in two mouse models of Alzheimer’s disease. Neurobiology of Aging 2017; 58: 1–13. [DOI] [PMC free article] [PubMed] [Google Scholar]
- 26.Velazquez R, Shaw DM, Caccamo A, Oddo S. Pim1 inhibition as a novel therapeutic strategy for Alzheimer’s disease. Molecular Neurodegeneration 2016; 11(1). [DOI] [PMC free article] [PubMed] [Google Scholar]
- 27.Ueland PM, Helland S, Broch OJ, Schanche JS. Homocysteine in tissues of the mouse and rat. The Journal of Biological Chemistry 1984; 259(4): 2360–2364. [PubMed] [Google Scholar]
- 28.Holm PI, Ueland PM, Kvalheim G, Lien EA. Determination of choline, betaine, and dimethylglycine in plasma by a high-throughput method based on normal-phase chromatography-tandem mass spectrometry. Clin Chem 2003; 49(2): 286–294. [DOI] [PubMed] [Google Scholar]
- 29.Dobin SM, Malone VS, Lopez L, Donner LR. Unusual histologic variant of a low-grade fibromyxoid sarcoma in a 3-year-old boy with complex chromosomal translocations involving 7q34, 10q11.2, and 16p11.2 and rearrangement of the FUS gene. Pediatr Dev Pathol 2013; 16(2): 86–90. [DOI] [PubMed] [Google Scholar]
- 30.Love MI, Huber W, Anders S. Moderated estimation of fold change and dispersion for RNA-seq data with DESeq2. Genome Biol 2014; 15(12): 550. [DOI] [PMC free article] [PubMed] [Google Scholar]
- 31.Kanehisa M, Goto S. KEGG: kyoto encyclopedia of genes and genomes. Nucleic Acids Res 2000; 28(1): 27–30. [DOI] [PMC free article] [PubMed] [Google Scholar]
- 32.Mi H, Poudel S, Muruganujan A, Casagrande JT, Thomas PD. PANTHER version 10: expanded protein families and functions, and analysis tools. Nucleic Acids Res 2016; 44(D1): D336–342. [DOI] [PMC free article] [PubMed] [Google Scholar]
- 33.Fabregat A, Sidiropoulos K, Garapati P, Gillespie M, Hausmann K, Haw R et al. The Reactome pathway Knowledgebase. Nucleic Acids Res 2016; 44(D1): D481–487. [DOI] [PMC free article] [PubMed] [Google Scholar]
- 34.Ashburner M, Ball CA, Blake JA, Botstein D, Butler H, Cherry JM et al. Gene ontology: tool for the unification of biology. The Gene Ontology Consortium. Nat Genet 2000; 25(1): 25–29. [DOI] [PMC free article] [PubMed] [Google Scholar]
- 35.Chatr-Aryamontri A, Oughtred R, Boucher L, Rust J, Chang C, Kolas NK et al. The BioGRID interaction database: 2017 update. Nucleic Acids Res 2017; 45(D1): D369–D379. [DOI] [PMC free article] [PubMed] [Google Scholar]
- 36.Benjamini YaH Yosef. Controlling the false discovery rate: a practical and powerful approach to multiple testing. Journal of Royal Statistical Society 1995; 57(1): 289–300. [Google Scholar]
- 37.Wang J, Duncan D, Shi Z, Zhang B. WEB-based GEne SeT AnaLysis Toolkit (WebGestalt): update 2013. Nucleic Acids Res 2013; 41(Web Server issue): W77–83. [DOI] [PMC free article] [PubMed] [Google Scholar]
- 38.Mellott TJ, Huleatt OM, Shade BN, Pender SM, Liu YB, Slack BE et al. Perinatal Choline Supplementation Reduces Amyloidosis and Increases Choline Acetyltransferase Expression in the Hippocampus of the APPswePS1dE9 Alzheimer’s Disease Model Mice. PloS One 2017; 12(1): e0170450. [DOI] [PMC free article] [PubMed] [Google Scholar]
- 39.Zotova E, Holmes C, Johnston D, Neal JW, Nicoll JA, Boche D. Microglial alterations in human Alzheimer’s disease following Abeta42 immunization. Neuropathol Appl Neurobiol 2011; 37(5): 513–524. [DOI] [PubMed] [Google Scholar]
- 40.Oikonomidi A, Lewczuk P, Kornhuber J, Smulders Y, Linnebank M, Semmler A et al. Homocysteine metabolism is associated with cerebrospinal fluid levels of soluble amyloid precursor protein and amyloid beta. Journal of Neurochemistry 2016; 139(2): 324–332. [DOI] [PubMed] [Google Scholar]
- 41.Agnati LF, Genedani S, Leo G, Forni A, Woods AS, Filaferro M et al. Abeta peptides as one of the crucial volume transmission signals in the trophic units and their interactions with homocysteine. Physiological implications and relevance for Alzheimer’s disease. J Neural Transm (Vienna) 2007; 114(1): 21–31. [DOI] [PubMed] [Google Scholar]
- 42.Li JG, Chu J, Barrero C, Merali S, Pratico D. Homocysteine exacerbates beta-amyloid pathology, tau pathology, and cognitive deficit in a mouse model of Alzheimer disease with plaques and tangles. Ann Neurol 2014; 75(6): 851–863. [DOI] [PMC free article] [PubMed] [Google Scholar]
- 43.Ho PI, Collins SC, Dhitavat S, Ortiz D, Ashline D, Rogers E et al. Homocysteine potentiates beta-amyloid neurotoxicity: role of oxidative stress. J Neurochem 2001; 78(2): 249–253. [DOI] [PubMed] [Google Scholar]
- 44.Jiang X, West AA, Caudill MA. Maternal choline supplementation: a nutritional approach for improving offspring health? Trends in endocrinology and metabolism: TEM 2014; 25(5): 263–273. [DOI] [PubMed] [Google Scholar]
- 45.Niculescu MD, Zeisel SH. Diet, methyl donors and DNA methylation: interactions between dietary folate, methionine and choline. The Journal of Nutrition 2002; 132(8 Suppl): 2333S–2335S. [DOI] [PubMed] [Google Scholar]
- 46.Meck WH, Williams CL. Metabolic imprinting of choline by its availability during gestation: implications for memory and attentional processing across the lifespan. Neuroscience and Biobehavioral Reviews 2003; 27(4): 385–399. [DOI] [PubMed] [Google Scholar]
- 47.Meck WH, Williams CL, Cermak JM, Blusztajn JK. Developmental periods of choline sensitivity provide an ontogenetic mechanism for regulating memory capacity and age-related dementia. Frontiers in Integrative Neuroscience 2007; 1: 7. [DOI] [PMC free article] [PubMed] [Google Scholar]
- 48.Caudill MA, Strupp BJ, Muscalu L, Nevins JEH, Canfield RL. Maternal choline supplementation during the third trimester of pregnancy improves infant information processing speed: a randomized, double-blind, controlled feeding study. The FASEB Journal 2018; 32(4): 2172–2180. [DOI] [PMC free article] [PubMed] [Google Scholar]
Associated Data
This section collects any data citations, data availability statements, or supplementary materials included in this article.