Abstract
Although plasma proteins have important roles in biological processes and are the direct targets of many drugs, the genetic factors that control inter-individual variation in plasma protein levels are not well understood. Here we characterize the genetic architecture of the human plasma proteome in healthy blood donors from the INTERVAL study. We identify 1,927 genetic associations with 1,478 proteins, a fourfold increase on existing knowledge, including trans associations for 1,104 proteins. To understand the consequences of perturbations in plasma protein levels, we apply an integrated approach that links genetic variation with biological pathway, disease, and drug databases. We show that protein quantitative trait loci overlap with gene expression quantitative trait loci, as well as with disease-associated loci, and find evidence that protein biomarkers have causal roles in disease using Mendelian randomization analysis. By linking genetic factors to diseases via specific proteins, our analyses highlight potential therapeutic targets, opportunities for matching existing drugs with new disease indications, and potential safety concerns for drugs under development.
Plasma proteins have key roles in various biological processes, including signalling, transport, growth, repair, and defence against infection. These proteins are frequently dysregulated in disease and are important drug targets. Identifying factors that determine inter-individual protein variability should, therefore, furnish biological and medical insights1. Despite evidence for the heritability of plasma protein abundance2, however, systematic assessment of how genetic variation influences plasma protein levels has been limited3–5. Studies have examined intra-cellular protein quantitative trait loci (pQTLs)6,7, but these studies have tended to be small and involved cell lines rather than primary human tissues.
Here we create and interrogate a genetic atlas of the human plasma proteome, using an expanded version of an aptamer-based multiplex protein assay (SOMAscan)8 to quantify 3,622 plasma proteins in 3,301 healthy participants from the INTERVAL study, a genomic bioresource of 50,000 blood donors from 25 centres across England recruited into a randomized trial of blood donation frequency9,10. We identify 1,927 genotype–protein associations (pQTLs), including trans-associated loci for 1,104 proteins, providing new understanding of the genetic control of protein regulation. Eighty-eight pQTLs overlap with disease susceptibility loci, suggesting the molecular effects of disease-associated variants. Using the principle of Mendelian randomization11, we find evidence to support causal roles in disease for several protein pathways, and cross-reference our data with disease and drug databases to highlight potential therapeutic targets.
Genetic architecture of the plasma proteome
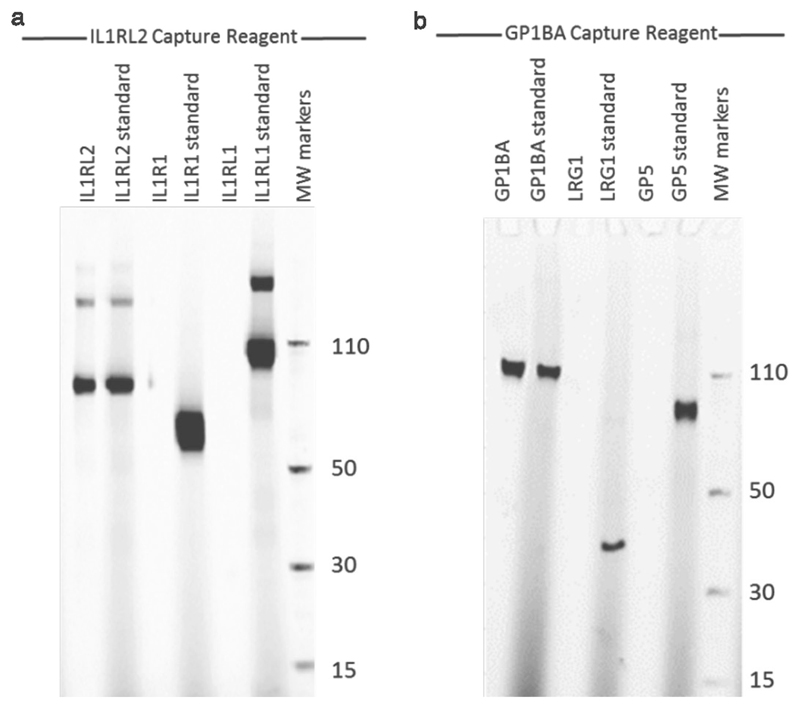
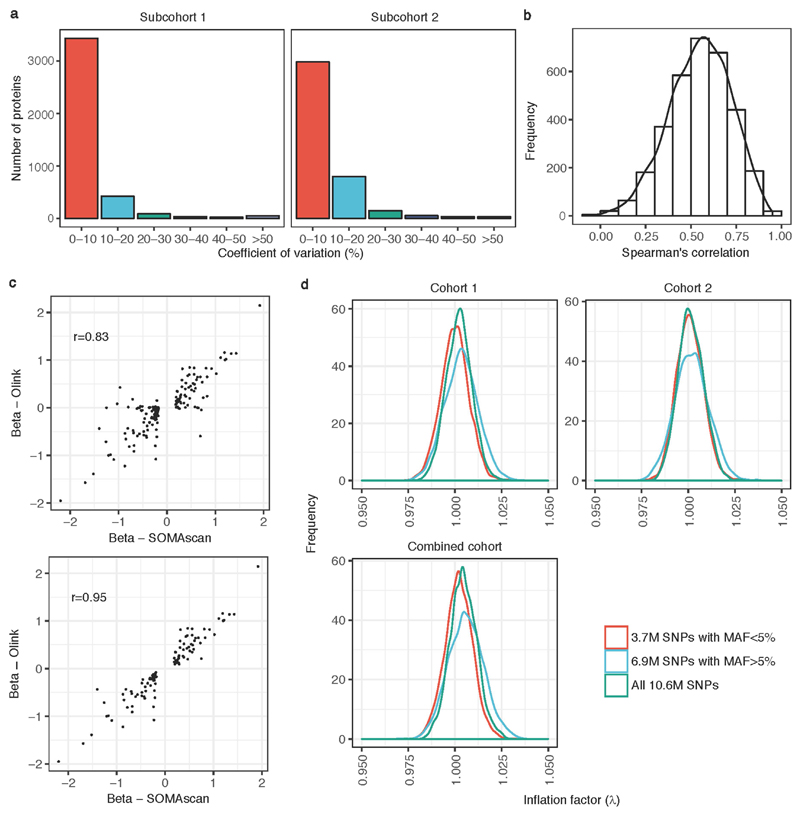
We performed genome-wide testing of 10.6 million imputed autosomal variants against levels of 2,994 plasma proteins in 3,301 individuals of European descent (Methods, Extended Data Fig. 1). We demonstrated the robustness of protein measurements in several ways (Supplementary Note, Extended Data Fig. 2), including: highly consistent measurements in replicate samples; temporal consistency of protein levels within individuals over two years (Extended Data Fig. 3b); and replication of known associations with non-genetic factors (Supplementary Tables 1, 2). To assess potential off-target cross-reactivity, we tested 920 aptamers (SOMAmers) for detection of proteins with at least 40% sequence homology to the target protein (Methods). Although 126 (14%) SOMAmers showed comparable binding with a homologous protein (Supplementary Table 3), nearly half of these were binding to alternative forms of the same protein.
We found 1,927 significant (P < 1.5 × 10⁻¹¹) associations between 1,478 proteins and 764 genomic regions (Fig. 1a, Supplementary Table 4, Supplementary Fig. 1, Supplementary Note Table 1), with 89% of these pQTLs being previously unreported. Of the 764 associated regions, 502 (66%) had local-acting (cis) associations only, 228 (30%) trans only, and 34 (4%) both cis and trans (Supplementary Note Table 1). Of the cis pQTL sentinel variants, 95% and 87% were located within 200 kb and 100 kb, respectively, of the relevant gene’s canonical transcription start site (TSS), and 44% were within the gene itself. The P values for cis associations increased with distance from the TSS (Fig. 1b), mirroring findings for gene expression QTLs (eQTLs)12. Of proteins with a significant pQTL, 88% had either cis (n = 374) or trans (n = 925) associations only, and 12% (n = 179) had both (Supplementary Note Table 1). The majority of significantly associated proteins (75%; n = 1,113) had a single pQTL, while 20% had two and 5% had more than two (Fig. 1c). To detect multiple independent associations at the same locus, we used stepwise conditional analysis, identifying 2,658 conditionally significant associations (Supplementary Table 5). Of the 1,927 pQTLs, 414 (21%) had multiple conditionally significant associations (Fig. 1d), of which 255 were cis.
Fig. 1. The genetic architecture of plasma protein levels.
n = 3,301 participants. a, Genomic locations of pQTLs. Red, cis; blue, trans. The x- and y-axes indicate the positions of the sentinel variant and the gene encoding the associated protein, respectively. Highly pleiotropic genomic regions are annotated. b, Significance of cis associations (linear regression) versus distance of sentinel variant from TSS. c, Number of significantly associated loci per protein. d, Number of conditionally significant associations within each pQTL. e, Histogram of variance explained by conditionally significant variants. f, Effect size versus MAF. g, Distributions of the predicted functional annotation classes of sentinel pQTL variants versus null sets of variants from permutation. Bar height represents the mean proportion of variants within each class and error bars reflect one s.d. from the mean. *Significant enrichment (permutation test, Bonferroni-corrected threshold, P < 0.005).
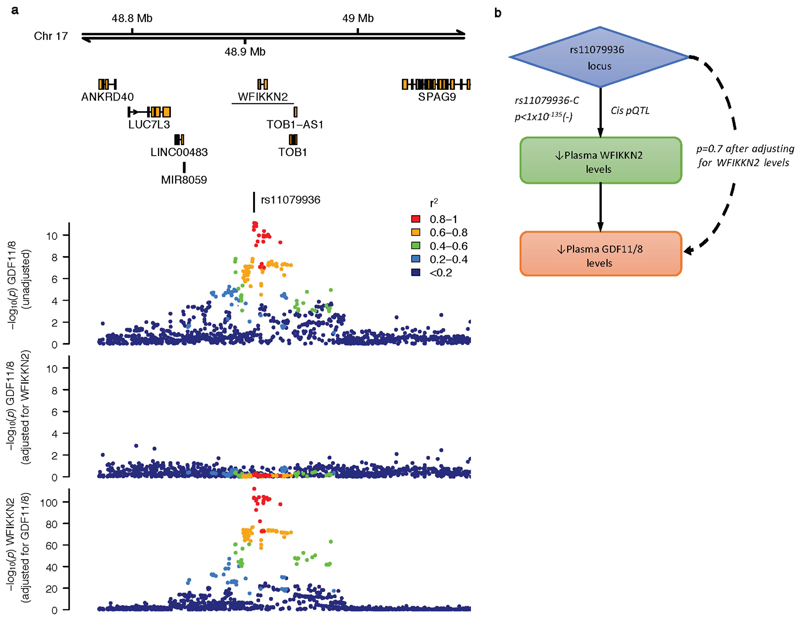
We tested replication of 163 pQTLs in 4,998 individuals using an alternative protein assay (Olink, see Methods)13. Effect-size estimates were strongly correlated between the SOMAscan and Olink platforms (r = 0.83; Extended Data Fig. 3c). One-hundred and six out of one-hundred and sixty-three (65% overall; 81% cis, 52% trans) pQTLs were replicated after Bonferroni correction (Supplementary Tables 4, 6). The lower replication rate of trans associations may reflect various factors, including differences between protein assays (for example, detection of free versus complexed proteins, Extended Data Fig. 4) and the higher ‘biological prior’ for cis associations.
Of 1,927 pQTLs, 549 (28%) were cis-acting (Supplementary Table 4). Genetic variants that change protein structure may result in apparent cis pQTLs owing to altered aptamer binding rather than true quantitative differences in protein levels. We found evidence against such artefactual associations for 371 (68%) cis pQTLs (Methods, Supplementary Tables 4, 7, 8). The results were materially unchanged when we repeated downstream analyses but excluded pQTLs without evidence against binding effects.
The median variation in protein levels explained by pQTLs was 5.8% (interquartile range: 2.6–12.4%, Fig. 1e). For 193 proteins, genetic variants explained more than 20% of the variation. There was a strong inverse relationship between effect size and minor allele frequency (MAF) (Fig. 1f), consistent with previous genome-wide association studies (GWAS) of quantitative traits7,10,14. We found 23 and 208 associations with rare (MAF <1%) and low-frequency (MAF 1–5%) variants, respectively (Supplementary Table 4). Of the 36 strongest associations (per-allele effect size >1.5 standard deviation (s.d.)), 29 were with rare or low-frequency variants.
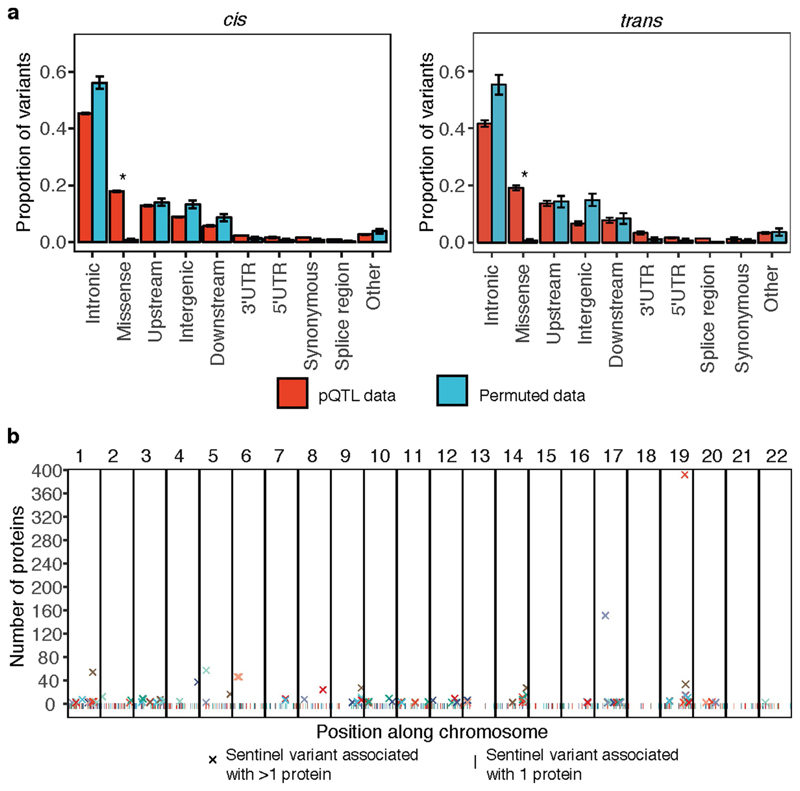
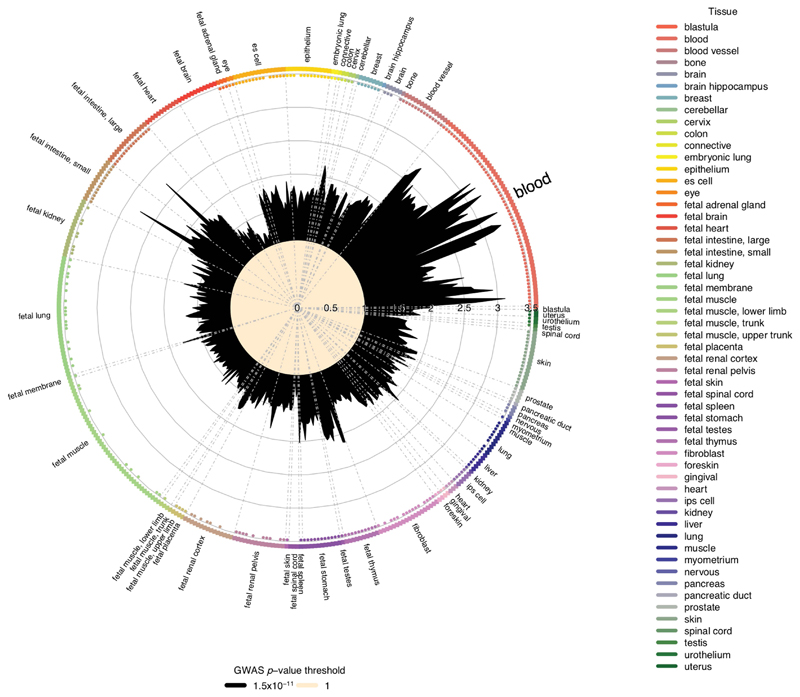
Both cis and trans pQTLs were strongly enriched for missense variants (P < 0.0001) and for location in 3′ untranslated (P = 0.0025) or splice sites (P = 0.0004) (Fig. 1g, Extended Data Fig. 5a). We found at least threefold enrichment (P < 5 × 10⁻⁵) of pQTLs at features indicative of transcriptional activation in blood cells and at hepatocyte regulatory elements, consistent with the role of the liver in protein synthesis and secretion (Methods, Extended Data Fig. 6, Supplementary Table 9).
Overlap of eQTLs and pQTLs
To help evaluate the extent to which genetic associations with plasma protein levels are driven by effects at the transcriptional level rather than other mechanisms (for example, altered protein clearance or secretion), we cross-referenced our cis pQTLs with previous eQTL studies (Supplementary Table 10), initially defining overlap between an eQTL and pQTL as high linkage disequilibrium (LD) (r2 ≥ 0.8) between the lead pQTL and eQTL variants. Forty per cent (n = 224) of cis pQTLs were eQTLs for the same gene in one or more tissue or cell type (Supplementary Table 8). The greatest overlaps were in whole blood (n = 117), liver (n = 70) and lymphoblastoid cell lines (LCLs) (n = 52), consistent with biological expectation, but also probably driven by the larger eQTL study sample sizes for these cell types. To investigate whether the same causal variant was likely to underlie overlapping eQTLs and pQTLs, we performed colocalization testing (see Methods). Of 228 pQTLs outside the human leukocyte antigen (HLA) region for which testing was possible, colocalization in one or more tissue or cell type was highly likely (posterior probability (PP) > 0.8) for 179 (78.5%) and the most likely explanation (PP > 0.5) for 197 (86.4%) (Supplementary Table 8). cis pQTLs were significantly enriched for eQTLs for the corresponding gene (P < 0.0001) (Methods, Supplementary Table 11). To address the converse (that is, to what extent are eQTLs also pQTLs), we selected well-powered eQTL studies in relevant tissues (whole blood, LCLs, liver and monocytes15–18). Of the strongest cis eQTLs (P < 1.5 × 10⁻¹¹) in whole blood, LCLs, liver and monocytes, 12.2%, 21.3%, 14.8% and 14.7%, respectively, were plasma cis pQTLs.
Comparisons between eQTL and pQTL studies have inherent limitations, including differences in the tissues, sample sizes and technological platforms used. Moreover, plasma protein levels may not reflect levels within tissues or cells. Nevertheless, our data suggest that genetic effects on plasma protein abundance are often, but not exclusively, driven by regulation of mRNA. cis pQTLs without corresponding cis eQTLs may reflect genetic effects on processes other than transcription, including protein degradation, binding, secretion, or clearance from circulation.
trans pQTLs identify pathways to disease
Of the 764 protein-associated regions, 262 had trans associations with 1,104 proteins (Supplementary Tables 4, 12). There was no enrichment of cross-reactivity in SOMAmers with a trans pQTL versus those without (Supplementary Note). We replicated known trans associations, including TMPRSS6 with transferrin receptor protein 119 and SORT1 with granulins20, and identified several novel and biologically plausible trans associations (Supplementary Table 13), including known or presumed ligand–receptor pairs (for example, the CD320 locus, encoding the transcobalamin receptor, was associated with transcobalamin-2 levels).
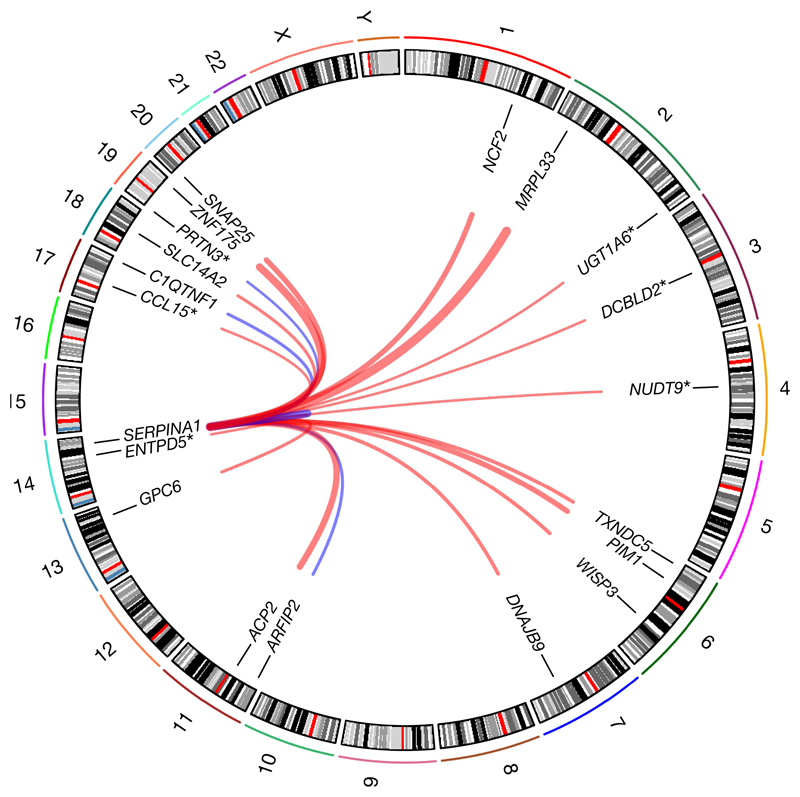
Most trans loci (82%) were associated with fewer than four proteins, but twelve ‘hotspot’ regions were associated with more than twenty (Fig. 1a, Extended Data Fig. 5b), including well-known pleiotropic loci (for example, ABO, CFH, APOE and KLKB1) and loci associated with many correlated proteins (for example, the ZFPM2 locus, which encodes the transcription factor FOG2). Similar pleiotropy at these loci has been seen in other plasma pQTL studies3–5, albeit with fewer proteins owing to limited assay breadth. A missense variant (rs28929474:T) in SERPINA1 was associated with 13 proteins at P < 1.5 × 10⁻¹¹ and a further six at P < 5 × 10⁻⁸ (Fig. 2). This variant (the ‘Z-allele’) results in defective secretion and intracellular accumulation of α1-antitrypsin (A1AT), an anti-protease. Individuals homozygous for the Z allele have a deficiency of circulating A1AT and an increased risk of emphysema, liver cirrhosis and vasculitis. The ‘protease–antiprotease’ hypothesis posits that the pulmonary manifestations of A1AT deficiency result from unchecked protease activity. Our discovery of multiple trans-associated proteins at this locus highlights additional pathways that might be relevant to pathogenesis, a hypothesis supported by accumulating data21.
Fig. 2. Missense variant rs28929474:T in SERPINA1 is a trans pQTL hotspot.
Outermost numbers indicate chromosomes. Lines link the genomic location of rs28929474 with genes encoding significantly associated proteins. Associations with and without asterisks indicate significance at P < 5 × 10⁻⁸ and P < 1.5 × 10⁻¹¹, respectively. Line thickness is proportional to effect size (red, positive; blue, negative); n = 3,301 participants.
GWAS have identified thousands of loci associated with common diseases, but the mechanisms by which most variants influence disease susceptibility are unknown. To identify intermediate links between genotype and disease, we overlapped pQTLs with disease-associated variants from GWAS. Eighty-eight of our sentinel pQTL variants were in high LD (r2 ≥ 0.8) with sentinel disease-associated variants (Supplementary Table 14), including 30 with cis associations, 54 with trans, and 4 with both. As some genetic loci are associated with multiple diseases, these 88 variants represent 253 distinct genotype–disease associations. Overlap of a pQTL and a disease association does not necessarily imply that the same genetic variant underlies both traits, because there may be distinct causal variants for each trait that are in LD. We therefore performed colocalization testing (see Methods). Of 108 locus–disease associations outside the major histocompatibility (MHC) region for which testing was possible, colocalization was highly likely (PP > 0.8) for 96 (88.9%), and the most likely explanation (PP > 0.5) for 106 (98.1%) (Supplementary Table 14).
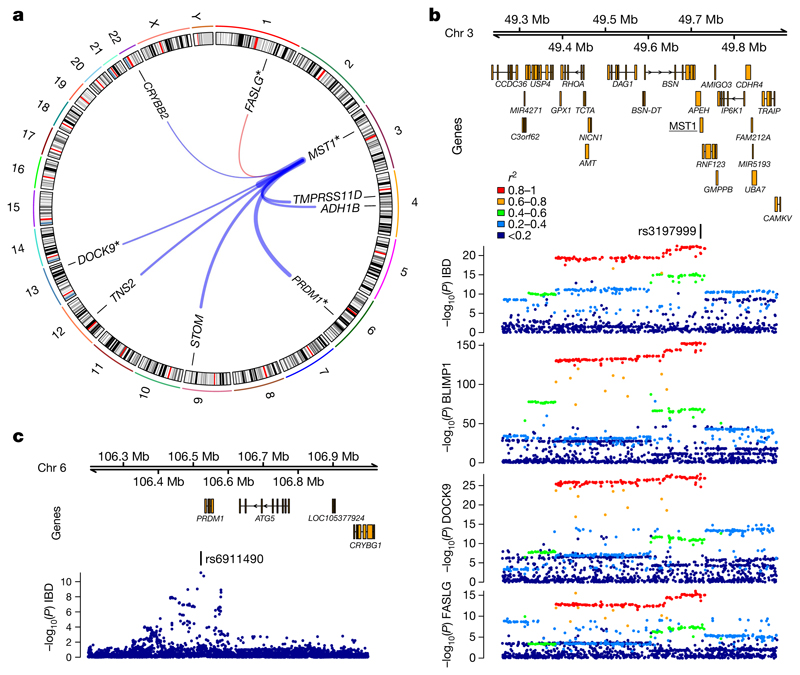
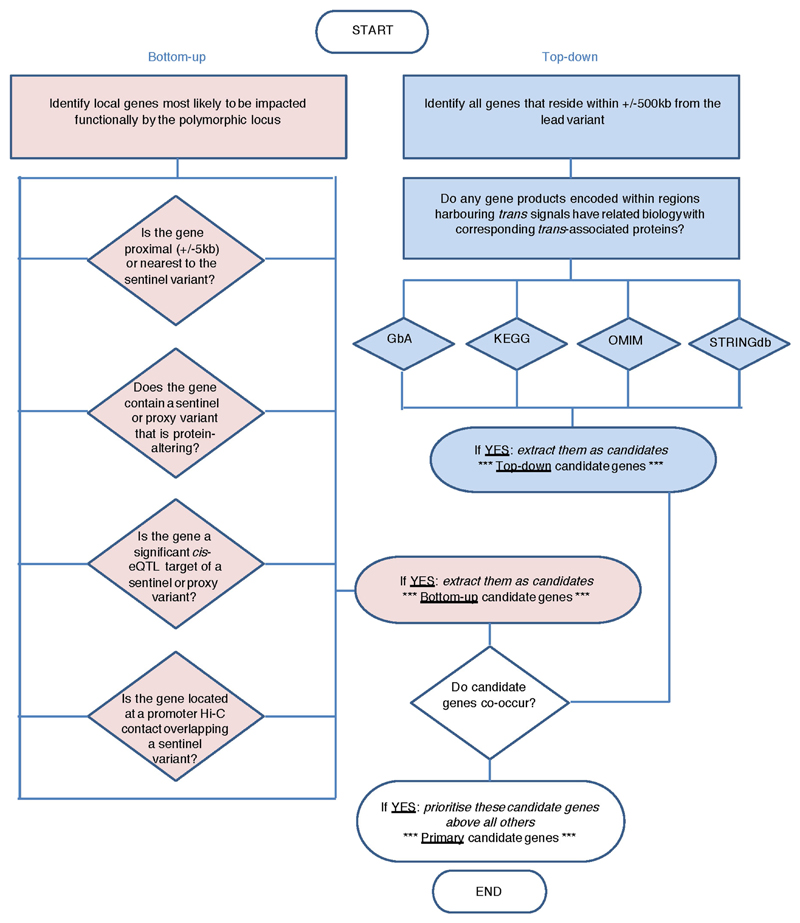
trans pQTLs that overlap with disease associations can highlight previously unsuspected candidate proteins through which genetic loci may influence disease risk. To help to identify such candidates, we applied the ProGeM framework22 (Methods, Supplementary Table 12, Extended Data Fig. 7). We show that an inflammatory bowel disease (IBD) risk allele23 (rs3197999:A, p.Arg703Cys) in MST1 on chromosome 3, which decreases plasma MST1 levels24, is a trans pQTL for eight additional proteins (Supplementary Table 4, Fig. 3). Notably, genes that encode three of these proteins (PRDM1, FASLG and DOCK9) each lie within 500 kb of IBD GWAS loci at which the causal gene is ambiguous25. For instance, the IBD-associated variant rs6911490 lies on chromosome 6 in the intergenic region near PRDM1 (encoding BLIMP1, a master regulator of immune cell differentiation) and ATG5 (involved in autophagy) (Fig. 3c). Neither fine-mapping nor eQTL colocalization analyses have unequivocally resolved the causal gene at this locus25; both PRDM1and ATG5 are plausible candidates. Our data provide support for PRDM1.
Fig. 3. trans pQTL for BLIMP1 at an inflammatory bowel disease (IBD) associated missense variant (rs3197999:A) in MST1.
a, rs3197999:A is associated with multiple proteins. Lines link rs3197999 and the genes encoding significantly associated proteins. Line thickness is proportional to effect size of the IBD risk allele (red = positive, blue = negative). n = 3,301 participants. Asterisks indicate genes in IBD GWAS loci. b, Regional association plots at MST1, showing IBD association (top) and trans pQTLs for BLIMP1, DOCK9 and FASLG. Colour key indicates r2 with rs3197999. c, Regional association plot of the IBD susceptibility locus at PRDM1, which encodes BLIMP1. IBD association data are for European participants from a GWAS meta-analysis23.
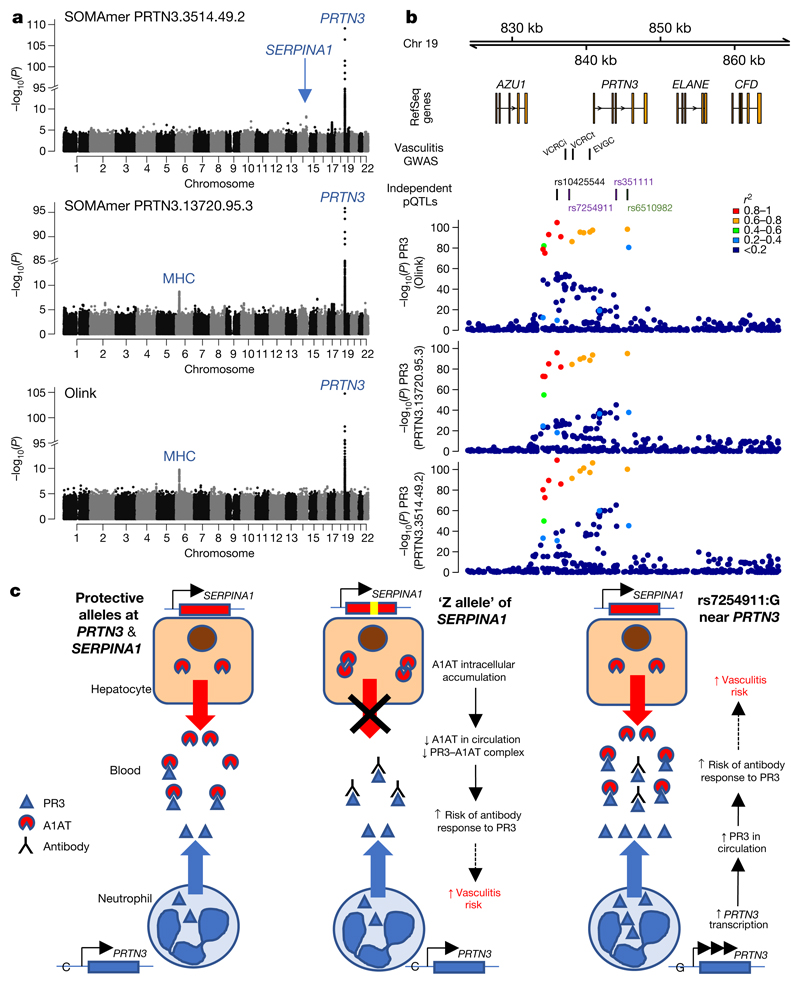
Anti-neutrophil cytoplasmic antibody-associated vasculitis (AAV) is an autoimmune disease characterized by vascular inflammation and autoantibodies to the neutrophil proteases proteinase-3 (PR3) or myeloperoxidase. GWAS have revealed distinct genetic associations according to antibody specificity26, with variants near PRTN3 (encoding PR3) and at the Z-allele of SERPINA1 (encoding A1AT, which inhibits PR3) associated specifically with PR3-antibody positive AAV. The SOMAscan assay has two SOMAmers that target PR3; we identified a cis pQTL immediately upstream of PRTN3 for both, and replicated it with the Olink assay (Supplementary Table 4, Fig. 4a, b). Conditional analysis revealed multiple independently associated variants (Supplementary Table 5), one of which (rs7254911) was in high LD with the previously reported26,27 PR3+ vasculitis-associated variants in the PRTN3 region (Supplementary Note). We show that the vasculitis risk allele at PRTN3 is associated with higher plasma levels of PR3 (Supplementary Note Table 4).
Fig. 4. Proteinase-3, SERPINA1 and vasculitis.
a, Manhattan plots for plasma PR3 measured with two SOMAmers and the Olink assay.
b, PRTN3 regional association plots. Colour key indicates r2 with sentinel variant rs10425544. ‘Vasculitis GWAS’: previously reported vasculitis-associated variants (see Supplementary Note). EVGC, rs62132295 (from European Vasculitis Genetics Consortium26); VCRCi, rs138303849 and VCRCt, rs62132293 (most significant imputed and genotyped variants, respectively, from Vasculitis Clinical Research Consortium27). ‘Independent pQTLs’: conditionally independent PR3 pQTL variants (black lettering shows lead variant for both SOMAmers; purple and green show conditionally independent variants for SOMAmers PRTN3.3514.49.2 and PRTN3.13720.95.3, respectively). c, Proposed mechanisms by which PRTN3 and SERPINA1 affect PR3 levels and thus vasculitis risk. Left, individuals without either the PRTN3 or SERPINA1 vasculitis risk alleles. Middle, SERPINA1 Z-allele carriers have lower circulating A1AT, resulting in higher free plasma PR3. Right, cis-acting variant at the PRTN3 locus results in higher total plasma PR3. Increases in either free or total PR3 predispose individuals to loss of immune tolerance.
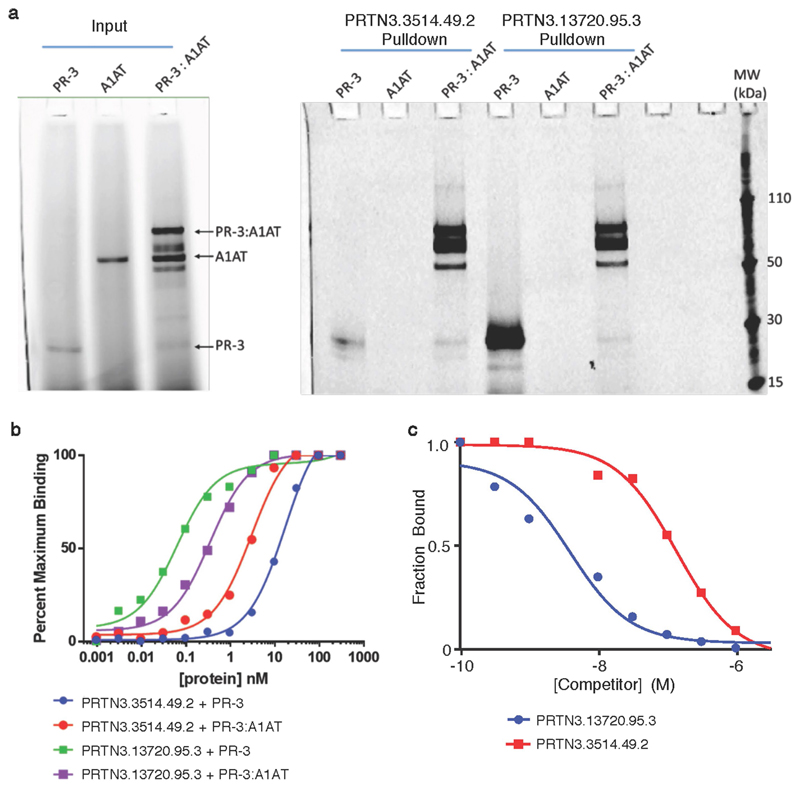
For one PR3 SOMAmer, we also found a trans pQTL at SERPINA1, with the Z-allele being associated with reduced levels of plasma PR3 (Fig. 4a). To understand the SOMAmer-specific nature of this association, we assayed the relative affinity of these SOMAmers for the free and complexed forms of PR3 and A1AT. We found that the SOMAmer showing cis and trans associations predominantly measured the PR3–A1AT complex rather than free PR3, whereas the SOMAmer with only a cis association measured both the free and complexed forms (Extended Data Fig. 8, Supplementary Note). Notably, neither SOMAmer bound free A1AT, demonstrating that the SERPINA1 pQTL did not reflect non-specific cross-reactivity (Supplementary Note).
These data show that the vasculitis risk allele at PRTN3 increases total PR3 plasma levels, consistent with its effect on PRTN3 mRNA abundance in whole blood in GTEx data28. The SERPINA1 Z-allele results in a reduced proportion of PR3 bound to A1AT. We thus demonstrate that altered availability of PR3, conferred by two independent genetic mechanisms, is a key susceptibility factor for breaking immune tolerance to PR3 and the development of PR3+ vasculitis (Fig. 4c).
Causal evaluation of candidate proteins in disease
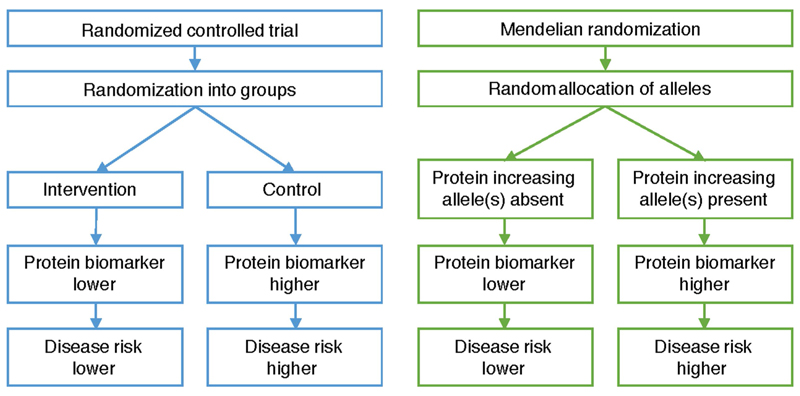
Association of plasma protein levels with disease risk does not necessarily imply causation. To help to establish causality, we used Mendelian randomization (MR) analysis11, which uses genetic variants as instrumental variables to avoid confounding and reverse causation (Extended Data Fig. 9). If a genetic variant is specifically associated with levels of a protein and is also associated with disease risk, then this provides evidence of the protein’s causal role. For example, serum levels of PSP-94 (also known as MSMB) are lower in men who go on to develop prostate cancer29, but it is unclear whether this association is correlative or causal. We identified a cis pQTL associated with lower PSP-94 plasma levels that overlaps with the prostate cancer susceptibility variant rs1099399430, supporting a protective role for PSP-94 in prostate cancer (Supplementary Table 14).
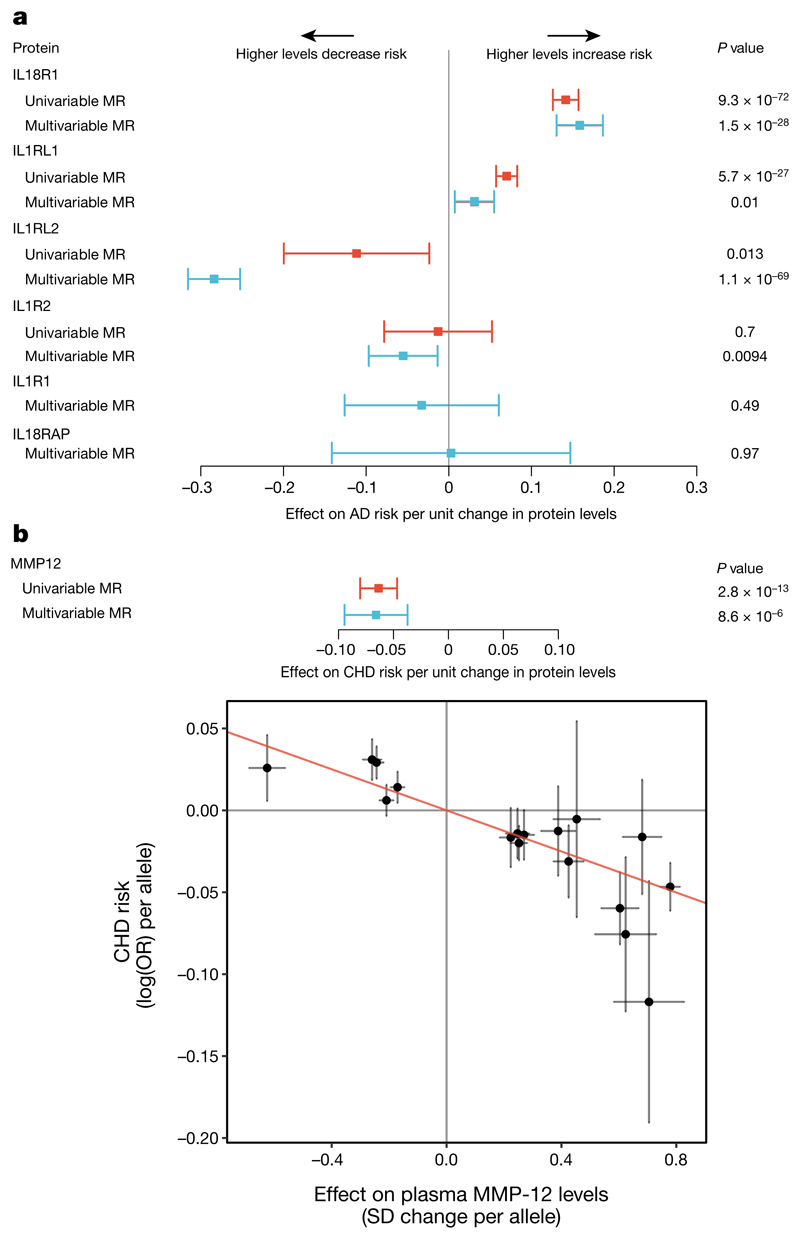
Next, we leveraged multi-variant MR analysis methods to identify causal proteins among multiple plausible candidates, exemplified by the IL1RL1–IL18R1 locus, which is associated with multiple immunemediated diseases including atopic dermatitis31. We identified four proteins that each had cis pQTLs at this locus (Supplementary Table 4), and created a genetic score for each protein (see Methods). Initial ‘one-protein-at-a-time’ analysis identified associations of the scores for IL18R1 (P = 9.3 × 10−72) and IL1RL1 (P = 5.7 × 10⁻²⁷) with atopic dermatitis risk (Fig. 5a), and a weak association for IL1RL2 (P = 0.013). We then mutually adjusted these associations for one another to account for the effects of the variants on multiple proteins. Whereas the association of IL18R1 remained significant (P = 1.5 × 10⁻²⁸), the association of IL1RL1 (P = 0.01) was attenuated. In contrast, the association of IL1RL2 (P = 1.1 × 10−69) became much stronger, suggesting that IL1RL2 and IL18R1 underlie atopic dermatitis risk at this locus.
Fig. 5. Evaluation of causal role of proteins in disease.
n = 3,301 participants. a, MR estimates with 95% confidence intervals (CIs) (instrumental variable analysis) for proteins encoded in the IL1RL1– IL18R1 locus and risk of atopic dermatitis (AD) risk. Univariable MR not possible for IL1R1 and IL18RAP (no significant pQTLs to select as ‘genetic instruments’). b, MMP-12 levels and risk of coronary heart disease (CHD). Top, MR estimates with 95% CIs. Bottom, estimated effect sizes (with 95% CIs) on plasma MMP-12 (from linear regression) and CHD risk (from logistic regression) for each variant used in the genetic score.
MMP-12 plays a key role in lung tissue damage, and MMP-12 inhibitors are being tested as treatments for chronic obstructive pulmonary disease32. We created a multi-allelic genetic score that explains 14% of the variation in plasma MMP-12 levels (see Methods). Observational studies reveal that higher levels of plasma MMP-12 are associated with recurrent cardiovascular events33, stimulating interest in the use of MMP-12 inhibitors to treat cardiovascular disease. However, we found that genetic predisposition to higher MMP-12 levels is associated with decreased coronary disease risk (P = 2.8 × 10⁻¹³) (Fig. 5b) and decreased large artery atherosclerotic stroke risk34. It will be important to understand the discordance between the observational epidemiology and the genetic risk score, given the therapeutic interest in this target.
Drug target prioritization
Drugs directed at targets with human genetic support have a greater likelihood of therapeutic success than those directed at unsupported targets35. Of the proteins for which we identified a pQTL, 244 (17%) are established drug targets in the Informa Pharmaprojects database (Supplementary Table 15). Thirty-one pQTLs for drug target proteins were highly likely to colocalize (PP > 0.8) with a GWAS disease locus, including some that are targets of approved drugs such as tocilizumab (anti-IL6R) and ustekinumab (anti-IL12/23) (Supplementary Table 16a).
To identify additional indications for existing drugs, we investigated disease associations of pQTLs for proteins already targeted by licensed drugs. Our results suggest potential drug repurposing opportunities. For example, we identified a cis pQTL for RANK (encoded by TNFRSF11A) at rs884205, a variant associated with Paget’s disease36, which is characterized by excessive bone turnover, deformity and fracture (Supplementary Table 16b). The standard treatment for Paget’s disease is osteoclast inhibition with bisphosphonates, originally developed as anti-osteoporotic drugs. Denosumab, another anti-osteoporosis drug, is a monoclonal antibody targeting RANKL, the ligand for RANK. Our data suggest that denosumab may be an alternative treatment for Paget’s disease when bisphosphonates are contraindicated, a hypothesis supported by clinical case reports37.
Next we evaluated targets of drugs currently under development. Drugs targeting GP1BA, a receptor for von Willebrand factor, are in preclinical development as anti-thrombotic agents and in phase 2 trials for thrombotic thrombocytopenic purpura. We found a cis pQTL associated with both higher GP1BA abundance and higher platelet count, suggesting a link between GP1BA and platelet count (Supplementary Table 16). Furthermore, we identified a trans pQTL for GP1BA at the SH2B3–BRAP locus, which colocalized with associations with platelet count10, myocardial infarction and stroke (Supplementary Table 16b). The risk allele for cardiovascular disease increases both plasma GP1BA and platelet count, suggesting that GP1BA influences vascular risk via platelets. Collectively, these results support targeting GP1BA in conditions characterized by platelet aggregation such as arterial thrombosis. More generally, our data provide a substrate for generating hypotheses about potential therapeutic targets through linking genetic factors to disease via specific proteins.
Discussion
This study elucidates the genetic control of the human plasma proteome and uncovers intermediate molecular pathways that connect the genome to disease endpoints. We applied our discoveries to evaluate causal roles for proteins in human diseases using the principle of Mendelian randomization. Proteins provide an ideal paradigm for MR analysis because they are under proximal genetic control. However, application of protein-based MR has been constrained by limited availability of suitable genetic instruments, a bottleneck remedied by our approach. Our study provides a resource for understanding complex traits and an example of the application of novel bioassay technologies to population biobanks.
Online content
Any Methods, including any statements of data availability and Nature Research reporting summaries, along with any additional references and Source Data files, are available in the online version of the paper at https://doi.org/10.1038/s41586-018-0175-2
Methods
Study participants
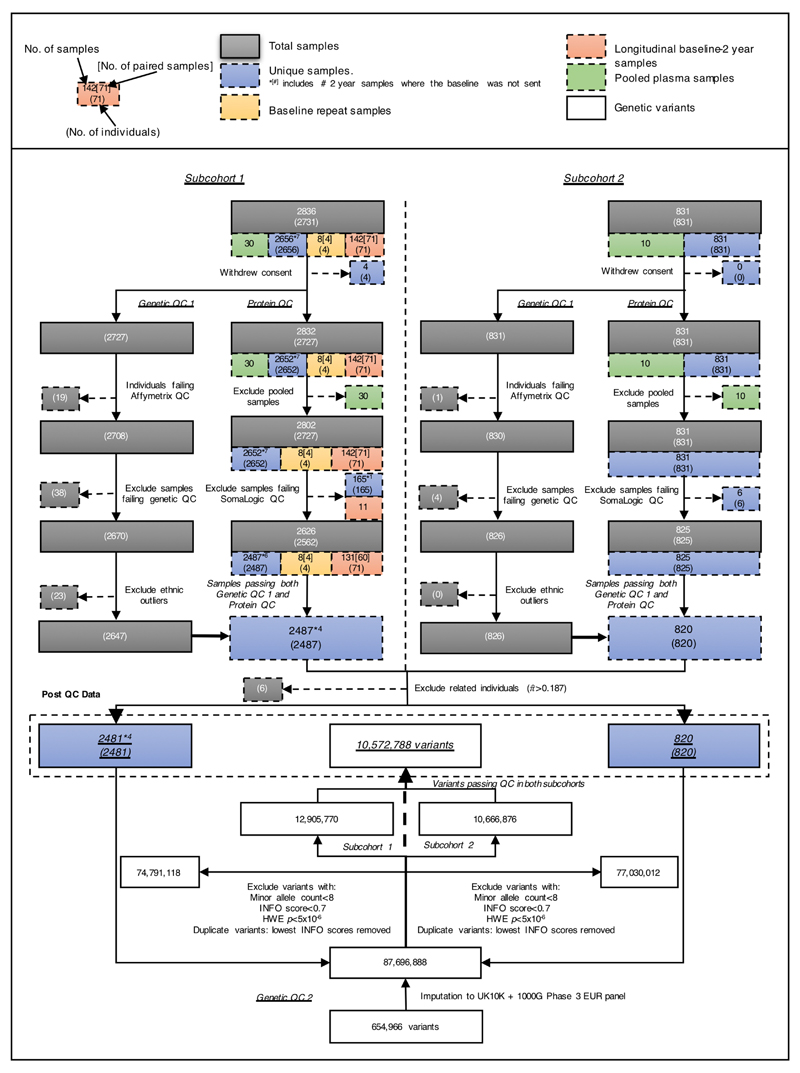
The INTERVAL study comprises about 50,000 participants nested within a randomized trial of varying blood donation intervals9. Between mid-2012 and mid-2014, blood donors aged 18 years and older were recruited at 25 centres of England’s National Health Service Blood and Transplant (NHSBT). All participants gave informed consent before joining the study and the National Research Ethics Service approved this study (11/EE/0538). Participants completed an online questionnaire including questions about demographic characteristics (for example, age, sex, ethnicity), anthropometry (height, weight), lifestyle (for example, alcohol and tobacco consumption) and diet. Participants were generally in good health because blood donation criteria exclude people with a history of major diseases (such as myocardial infarction, stroke, cancer, HIV, and hepatitis B or C) and those who have had recent illness or infection. For SomaLogic assays, we randomly selected two non-overlapping subcohorts of 2,731 and 831 participants from INTERVAL. After genetic quality control, 3,301 participants (2,481 and 820 in the two subcohorts) remained for analysis (Supplementary Table 17). No statistical methods were used to determine sample size. The experiments were not randomized. Laboratory staff conducting proteomic assays were blinded to the genotypes of participants.
Plasma sample preparation
Sample collection procedures for INTERVAL have been described previously38. In brief, blood samples for research purposes were collected in 6-ml EDTA tubes using standard venepuncture protocols. The tubes were inverted three times and transferred at ambient temperature to UK Biocentre (Stockport, UK) for processing. Plasma was extracted into two 0.8-ml plasma aliquots by centrifugation and subsequently stored at −80 °C before use.
Protein measurements
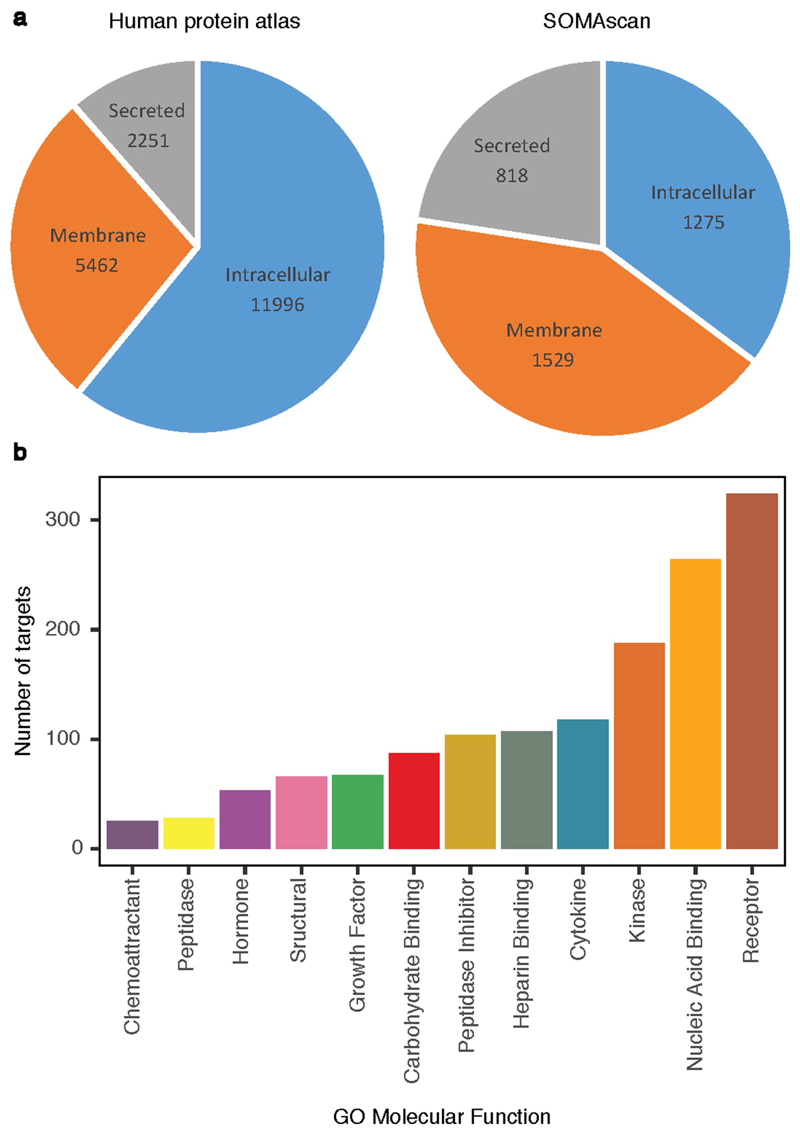
We used a multiplexed, aptamer-based approach (SOMAscan assay) to measure the relative concentrations of 3,622 plasma proteins or protein complexes assayed using 4,034 modified aptamers (‘SOMAmer reagents’, hereafter referred to as SOMAmers; Supplementary Table 18). The assay extends the lower limit of detectable protein abundance afforded by conventional approaches (for example, immunoassays), measuring both extracellular and intracellular proteins (including soluble domains of membrane-associated proteins), with a bias towards proteins likely to be found in the human secretome8,39 (Extended Data Fig. 10a). The proteins cover a wide range of molecular functions (Extended Data Fig. 10b). The selection of proteins on the platform reflects both the availability of purified protein targets and a focus on proteins suspected to be involved in the pathophysiology of human disease.
Aliquots of 150 μl of plasma were sent on dry ice to SomaLogic Inc. (Boulder, Colorado, US) for protein measurement. Assay details have been previously described39,40 and a technical white paper with further information can be found at the manufacturer’s website (http://somalogic.com/wp-content/uploads/2017/06/SSM-002-Technical-White-Paper_010916_LSM1.pdf). In brief, modified single-stranded DNA SOMAmers are used to bind to specific protein targets that are then quantified using a DNA microarray. Protein concentrations are quantified as relative fluorescent units.
Quality control (QC) was performed at the sample and SOMAmer levels using control aptamers and calibrator samples. At the sample level, hybridization controls on the microarray were used to correct for systematic variability in hybridization, while the median signal over all features assigned to one of three dilution sets (40%, 1% and 0.005%) was used to correct for within-run technical variability. The resulting hybridization scale factors and median scale factors were used to normalize data across samples within a run. The acceptance criteria for these values are between 0.4 and 2.5 based on historical runs. SOMAmer-level QC made use of replicate calibrator samples using the same study matrix (plasma) to correct for between-run variability. The acceptance criterion for each SOMAmer was that the calibration scale factor be less than 0.4 from the median for each of the plates run. In addition, at the plate level, the acceptance criteria were that the median of the calibration scale factors be between 0.8 and 1.2, and that 95% of individual SOMAmers be less than 0.4 from the median within the plate.
In addition to QC processes routinely conducted by SomaLogic, we measured protein levels of 30 and 10 pooled plasma samples randomly distributed across plates for subcohort 1 and subcohort 2, respectively. Laboratory technicians were blinded to the presence of pooled samples. This approach enabled estimation of the reproducibility of the protein assays. We calculated the coefficient of variation (CV) for each SOMAmer within each subcohort by dividing the standard deviation by the mean of the pooled plasma sample protein read-outs. In addition to passing SomaLogic QC processes, we required SOMAmers to have a CV ≤ 20% in both subcohorts. Eight non-human protein targets were also excluded, leaving 3,283 SOMAmers (mapping to 2,994 unique proteins or protein complexes) for inclusion in the GWAS.
Protein mapping to UniProt identifiers and gene names was provided by SomaLogic. Mapping to Ensembl gene IDs and genomic positions was performed using Ensembl Variant Effect Predictor v83 (VEP)41. Protein subcellular locations were determined by exporting the subcellular location annotations from UniProt42. If the term ‘membrane’ was included in the descriptor, the protein was considered to be a membrane protein, whereas if the term ‘secreted’ (but not ‘membrane’) was included in the descriptor, the protein was considered to be a secreted protein. Proteins not annotated as either membrane or secreted proteins were classified (by inference) as intracellular proteins. Proteins were mapped to molecular functions using gene ontology annotations43 from UniProt.
Non-genetic associations of proteins
To provide confidence in the reproducibility of the protein assays, we attempted to replicate the associations with age or sex of 45 proteins previously reported by Ngo et al. and 40 reported by Menni et al.44,45. We used Bonferroni-corrected P value thresholds of P = 1.1 × 10⁻³ (0.05/45) and P = 1.2 × 10⁻³ (0.05/40), respectively. Relative protein abundances were rank-inverse normalized within each subcohort and linear regression was performed using age, sex, body mass index, natural log of estimated glomerular filtration rate (eGFR) and subcohort as independent variables.
Genotyping and imputation
The genotyping protocol and QC for the INTERVAL samples (n ≈ 50,000) have been described previously in detail10. DNA extracted from buffy coat was used to assay approximately 830,000 variants on the Affymetrix Axiom UK Biobank genotyping array at Affymetrix (Santa Clara, California, US). Genotyping was performed in multiple batches of approximately 4,800 samples each. Sample QC was performed including exclusions for sex mismatches, low call rates, duplicate samples, extreme heterozygosity and non-European descent. Relatedness was removed by excluding one participant from each pair of close (first- or second-degree) relatives, defined as Identity-by-descent was estimated using a subset of variants with a call rate >99% and MAF > 5% in the merged data set of both subcohorts, pruned for linkage disequilibrium (LD) using PLINK v1.946. Numbers of participants excluded at each stage of the genetic QC are summarized in Extended Data Fig. 1. Multi-dimensional scaling was performed using PLINK v1.9 to create components to account for ancestry in genetic analyses.
Prior to imputation, additional variant filtering steps were performed to establish a high-quality imputation scaffold. In summary, 654,966 high-quality variants (auto-somal, non-monomorphic, bi-allelic variants with Hardy–Weinberg Equilibrium (HWE) P > 5 × 10⁻⁶, with a call rate of >99% across the INTERVAL genotyping batches in which a variant passed QC, and a global call rate of >75% across all INTERVAL genotyping batches) were used for imputation. Variants were phased using SHAPEIT3 and imputed using a combined 1000 Genomes Phase 3-UK10K reference panel. Imputation was performed via the Sanger Imputation Server (https://imputation.sanger.ac.uk) and resulted in 87,696,888 imputed variants.
Prior to genetic association testing, variants were filtered in each subcohort separately using the following exclusion criteria: (1) imputation quality (INFO) score <0.7; (2) minor allele count <8; (3) HWE P < 5 × 10⁻⁶. In the small number of cases in which imputed variants had the same genomic position (GRCh37) and alleles, the variant with the lowest INFO score was removed. 10,572,788 variants passing all filters in both subcohorts were taken forward for analysis (Extended Data Fig. 1).
Genome-wide association study
Within each subcohort, relative protein abundances were first natural log-transformed. Log-transformed protein levels were then adjusted in a linear regression for age, sex, duration between blood draw and processing (binary, ≤1 day/>1day) and the first three principal components of ancestry from multi-dimensional scaling. The protein residuals from this linear regression were then rank-inverse normalized and used as phenotypes for association testing. Simple linear regression using an additive genetic model was used to test genetic associations. Association tests were carried out on allelic dosages to account for imputation uncertainty (‘-method expected’ option) using SNPTEST v2.5.247.
Meta-analysis and statistical significance
Association results from the two subcohorts were combined via fixed-effects inverse-variance meta-analysis combining the betas and standard errors using METAL48. Genetic associations were considered to be genome-wide significant based on a conservative strategy requiring associations to have (i) a meta-analysis P value < 1.5 × 10⁻¹¹ (genome-wide threshold of P = 5 × 10⁻⁸ Bonferroni-corrected for 3,283 aptamers tested), (ii) at least nominal significance (P < 0.05) in both subcohorts, and (iii) consistent direction of effect across subcohorts. We did not observe significant genomic inflation (mean inflation factor was 1.0, standard deviation = 0.01) (Extended Data Fig. 3d).
Refinement of significant regions
To identify distinct non-overlapping regions associated with a given SOMAmer, we first defined a 1-Mb region around each significant variant for that SOMAmer. Starting with the region containing the variant with the smallest P value, any overlapping regions were then merged and this process was repeated until no more overlapping 1-Mb regions remained. The variant with the lowest P value for each region was assigned as the ‘regional sentinel variant’. Owing to the complexity of the MHC region, we treated the extended MHC region (chr6:25.5–34.0Mb) as one region. To identify whether a region was associated with multiple SOMAmers, we used an LD-based clumping approach. Regional sentinel variants in high LD (r2 ≥ 0.8) with each other were combined together into a single region.
Conditional analyses
To identify conditionally significant associations, we performed approximate genome-wide stepwise conditional analysis using GCTA v1.25.249 using the ‘cojo-slct’ option. We used the same conservative significance threshold of P = 1.5 × 10⁻¹¹ as for the univariable analysis. As inputs for GCTA, we used the summary statistics (that is, betas and standard errors) from the meta-analysis. Correlation between variants was estimated using the ‘hard-called’ genotypes (where a genotype was called if it had a posterior probability of >0.9 following imputation or set to missing otherwise) in the merged genetic data set, and only variants also passing the univariable genome-wide threshold (P < 1.5 × 10⁻¹¹) were considered for stepwise selection. As the conditional analyses use different data inputs to the univariable analysis (that is, summarized rather than individual-level data), there were some instances where the conditional analysis failed to include in the stepwise selection sentinel variants that were only just statistically significant in the univariable analysis. In these instances (n = 28), we re-conducted the joint model estimation without stepwise selection in GCTA, using the variants identified by the conditional analysis in addition to the regional sentinel variant. We report and highlight these cases in Supplementary Table 5.
Replication of previous pQTLs
We attempted to identify all previously reported pQTLs from GWAS and to assess whether they replicated in our study. We used the NCBI Entrez programming utility in R (rentrez) to perform a literature search for pQTL studies published from 2008 onwards. We searched for the following terms: ‘pQTL’, ‘pQTLs’, and ‘protein quantitative trait locus’. We supplemented this search by filtering out GWAS associations from the NHGRI-EBI GWAS Catalog v.1.0.150 (https://www.ebi.ac.uk/gwas/, downloaded November 2017), which has all phenotypes mapped to the Experimental Factor Ontology (EFO)51, by restricting to those with EFO annotations relevant to protein biomarkers (for example, ‘protein measurement’, EFO_0004747). Studies identified through both approaches were manually filtered to include only studies that profiled plasma or serum samples and to exclude studies not assessing proteins. We recorded basic summary information for each study including the assay used, sample size and number of proteins with pQTLs (Supplementary Table 19). To reduce the impact of ethnic differences in allele frequencies on replication rate estimates, we filtered studies to include only associations reported in European-ancestry populations. We then manually extracted summary data on all reported associations from the manuscript or the supplementary material. This included rsID, protein UniProt ID, P values, and whether the association was cis or trans (Supplementary Table 20).
To assess replication we first identified the set of unique UniProt IDs that were also assayed on the SOMAscan panel. For previous studies that used SomaLogic technology, we refined this match to the specific aptamer used. We then clumped associations into distinct loci using the same method that we applied to our pQTLs (see ‘Refinement of significant regions’). For each locus, we asked whether the sentinel SNP or a proxy (r2 > 0.6) was associated with the same protein (or aptamer) in our study at a defined significance threshold. For our primary assessment, we used a P value threshold of 10−4 (Supplementary Table 21). We also performed sensitivity analyses to explore factors that influence replication rate (Supplementary Note).
Replication study using Olink assay
To test replication of 163 pQTLs for 116 proteins, we performed protein measurements using an alternative assay, that is, a proximity extension assay method (Olink Bioscience, Uppsala, Sweden)13 in an additional subcohort of 4,998 INTERVAL participants. Proteins were measured using three 92-protein ‘panels’ – ‘inflammatory’, ‘cvd2’ and ‘cvd3’ (10 proteins were assayed on more than 1 panel). 4,902, 4,947 and 4,987 samples passed quality control for the ‘inflammatory’, ‘cvd2’ and ‘cvd3’ panels, respectively, of which 712, 715 and 721 samples were from individuals included in our primary pQTL analysis using the SOMAscan assay. Normalized protein levels (‘NPX’) were regressed on age, sex, plate, time from blood draw to processing (in days), and season (categorical: ‘Spring’, ‘Summer’, ‘Autumn’, ‘Winter’). The residuals were then rank-inverse normalized. Genotype data was processed as described earlier. Linear regression of the rank-inversed normalized residuals on genotype was carried out in SNPTEST with the first three components of multi-dimensional scaling as covariates to adjust for ancestry. pQTLs were considered to have replicated if they met a P value threshold Bonferroni-corrected for the number of tests (P < 3.1 × 10⁻⁴; 0.05/163) and had a directionally concordant beta estimate with the SOMAscan estimate.
Candidate gene annotation
We defined a pQTL as cis when the most significantly associated variant in the region was located within 1 Mb of the TSS of the gene(s) encoding the protein. pQTLs lying outside of this region were defined as trans. When considering the distance of the lead cis-associated variant from the relevant TSS, only proteins that mapped to single genes on the primary assembly in Ensembl v83 were considered.
For trans pQTLs, we sought to prioritize candidate genes in the region that might underpin the genotype–protein association. We applied the ProGeM framework22, which leverages a combination of databases of molecular pathways, protein–protein interaction networks, and variant annotation, as well as functional genomic data including eQTL and chromosome conformation capture. In addition to reporting the nearest gene to the sentinel variant, ProGeM employs complementary ‘bottom up’ and ‘top down’ approaches, starting from the variant and protein respectively. For the ‘bottom up’ approach, the sentinel variant and corresponding proxies (r2 > 0.8) for each trans pQTL were first annotated using Ensembl VEP v83 (using the ‘pick’ option) to determine whether variants were (1) protein-altering coding variants; (2) synonymous coding or 5′/3′ untranslated region (UTR); (3) intronic or up/downstream; or (4) intergenic. Second, we queried all sentinel variants and proxies against significant cis eQTL variants (defined by beta distribution-adjusted empirical P values using an FDR threshold of 0.05, see http://www.gtex-portal.org/home/documentationPage for details) in any cell type or tissue from the Genotype-Tissue Expression (GTEx) project v628 (http://www.gtexportal.org/home/datasets). Third, we also queried promoter capture Hi-C data in 17 human primary haematopoietic cell types52 to identify contacts (with a CHiCAGO score >5 in at least one cell type) involving chromosomal regions containing a sentinel variant. We considered gene promoters annotated on either fragment (that is, the fragment containing the sentinel variant or the other corresponding fragment) as potential candidate genes. Using these three sources of information, we generated a list of candidate genes for the trans pQTLs. A gene was considered a candidate if it fulfilled at least one of the following criteria: (1) it was proximal (intragenic or ± 5 kb from the gene) or nearest to the sentinel variant; (2) it contained a sentinel or proxy variant (r2 > 0.8) that was protein-altering; (3) it had a significant cis eQTL in at least one GTEx tissue overlapping with a sentinel pQTL variant (or proxy); or (4) it was regulated by a promoter annotated on either fragment of a chromosomal contact52 involving a sentinel variant.
For the ‘top down’ approach, we first identified all genes with a TSS located within the corresponding pQTL region using the GenomicRanges Bioconductor package53 with annotation from a GRCh37 GTF file from Ensembl (ftp://ftp.ensembl.org/pub/grch37/update/gtf/homo_sapiens; file: ‘Homo_sapiens. GRCh37.82.gtf.gz’, downloaded June 2016). We then identified any local genes that had previously been linked with the corresponding trans-associated protein(s) according to the following open source databases: (1) the Online Mendelian Inheritance in Man (OMIM) catalogue54 (http://www.omim.org/); (2) the Kyoto Encyclopedia of Genes and Genomes (KEGG)55 (http://www.genome.jp/kegg/); and (3) STRINGdb56 (http://string-db.org/;v10.0). We accessed OMIM data via HumanMine web tool57 (http://www.humanmine.org/; accessed June 2016), whereby we extracted all OMIM IDs for (i) our trans-affected proteins and (ii) genes local (± 500 kb) to the corresponding trans-acting variant. We extracted all human KEGG pathway IDs using the KEGGREST Bioconductor package (https://bioconductor.org/packages/release/bioc/html/KEGGREST.html). In cases where a trans-associated protein shared either an OMIM ID or a KEGG pathway ID with a gene local to the corresponding trans-acting variant, we took this as evidence of a potential functional involvement of that gene. We interrogated protein–protein interaction data by accessing STRINGdb data using the STRINGdb Bioconductor package58, whereby we extracted all pairwise interaction scores for each trans-affected protein and all proteins with genes local to the corresponding trans-acting variants. We took the default interaction score of 400 as evidence of an interaction between the proteins, therefore indicating a possible functional involvement for the local gene. In addition to using data from open source databases in our top down approach, we also adopted a ‘guilt-by-association’ (GbA) approach using the same plasma proteomic data used to identify our pQTLs. We first generated a matrix containing all possible pairwise Pearson’s correlation coefficients between our 3,283 SOMAmers. We then extracted the coefficients relating to our trans-associated proteins and any proteins encoded by genes local to their corresponding trans-acting variants (where available). Where the correlation coefficient was ≥0.5 we prioritized the relevant local genes as being potential mediators of the trans association(s) at that locus.
We report the potential candidate genes for our trans pQTLs from both the ‘bottom up’ and ‘top down’ approaches, highlighting cases where the same gene was highlighted by both approaches.
Functional annotation of pQTLs
Functional annotation of variants was performed using Ensembl VEP v83 using the ‘pick’ option. We tested the enrichment of significant pQTL variants for certain functional classes by comparing to permuted sets of variants showing no significant association with any protein (P > 0.0001 for all proteins tested). First, the regional sentinel variants were LD-pruned at r2 of 0.1. Each time the sentinel variants were LD-pruned, one of the pairs of correlated variants was removed at random and for each set of LD-pruned sentinel variants, 100 equally sized sets of null permuted variants were sampled matching for MAF (bins of 5%), distance to TSS (bins of 0–0.5 kb, 0.5–2 kb, 2–5 kb, 5–10 kb, 10–20 kb, 20–100 kb and >100 kb in each direction) and LD (± half the number of variants in LD with the sentinel variant at r2 of 0.8). This procedure was repeated 100 times resulting in 10,000 permuted sets of variants. An empirical P value was calculated as the proportion of permuted variant sets where the proportion that is classified as a particular functional group exceeded that of the test set of sentinel pQTL variants, and we used a significance threshold of P = 0.005 (0.05/10 functional classes tested).
Evidence against aptamer-binding effects at cis pQTLs
All protein assays that rely on binding (for example, of antibodies or SOMAmers) are susceptible to the possibility of binding-affinity effects, where protein-altering variants (PAVs) (or their proxies in LD) are associated with protein measurements owing to differential binding rather than differences in protein abundance. To account for this potential effect, we performed conditional analysis at all cis pQTLs where the sentinel variant was in LD (r2 ≥ 0.1 and r2 ≤ 0.9) with a PAV in the gene(s) encoding the associated protein. First, variants were annotated with Ensembl VEP v83 using the ‘per-gene’ option. Variant annotations were considered protein-altering if they were annotated as coding sequence variant, frameshift variant, in-frame deletion, in-frame insertion, missense variant, protein altering variant, splice acceptor variant, splice donor variant, splice region variant, start lost, stop gained, or stop lost. To avoid multi-collinearity, PAVs were LD-pruned (r2 > 0.9) using PLINK v1.9 before including them as covariates in the conditional analysis on the meta-analysis summary statistics using GCTA v1.25.2. Coverage of known common (MAF >5%) PAVs in our data was checked by comparison with exome sequences from ~60,000 individuals in the Exome Aggregation Consortium (ExAC (http://exac.broadinstitute.org), downloaded June 2016)59.
Testing for regulatory and functional enrichment
We tested whether our pQTLs were enriched for functional and regulatory characteristics using GARFIELD v1.2.060. GARFIELD is a non-parametric permutation-based enrichment method that compares input variants to permuted sets matched for number of proxies (r2 ≥ 0.8), MAF and distance to the closest TSS. It first applies ‘greedy pruning’ (r2 < 0.1) within a 1-Mb region of the most significant variant. GARFIELD annotates variants with more than a thousand features, drawn predominantly from the GENCODE, ENCODE and ROADMAP projects, which includes genic annotations, histone modifications, chromatin states and other regulatory features across a wide range of tissues and cell types.
The enrichment analysis was run using all variants that passed our Bonferroni-adjusted significance threshold (P < 1.5 × 10⁻¹¹) for association with any protein. For each of the matching criteria (MAF, distance to TSS, number of LD proxies), we used five bins. In total we tested 25 combinations of features (classified as transcription factor binding sites, FAIRE-seq, chromatin states, histone modifications, footprints, hotspots, or peaks) with up to 190 cell types from 57 tissues, leading to 998 tests. Hence, we considered enrichment with P < 5 × 10⁻⁵ (0.05/998) to be statistically significant.
Disease annotation
To identify diseases with which our pQTLs have been associated, we queried our sentinel variants and their strong proxies (r2 ≥ 0.8) against publicly available disease GWAS data using PhenoScanner61. A list of data sets queried is available at http://www.phenoscanner.medschl.cam.ac.uk/information.html. For disease GWAS, results were filtered to P < 5 × 10⁻⁸ and then manually curated to retain only the entry with the strongest evidence for association (that is, smallest P value) per disease. Non-disease phenotypes such as anthropometric traits, intermediate biomarkers and lipids were excluded manually.
cis eQTL overlap and enrichment of cis pQTLs for cis eQTLs
For each regional sentinel cis pQTL variant, its strong proxies (r2 ≥ 0.8) were queried against publicly available eQTL association data using PhenoScanner. cis eQTL results were filtered to retain only variants with P < 1.5 × 10⁻¹¹. Only cis eQTLs for the same gene as the cis pQTL protein were retained. We tested whether cis pQTLs were significantly enriched for eQTLs for the corresponding gene compared to null sets of variants appropriately matched for MAF and distance to nearest TSS. For this analysis, we restricted eQTL data to GTEx project v6, since this project provided complete summary statistics across a wide range of tissues and cell-types, in contrast to many other studies which only report P values below some significance level. GTEx results were filtered to contain only variants lying in cis (that is, within 1 Mb) of genes that encode proteins analysed in our study and only variants in both data sets were used.
For the enrichment analysis, the cis pQTL sentinel variants were first LD-pruned (r2 < 0.1) and the proportion of sentinel cis pQTL variants that are also eQTLs at our pQTL significance threshold (P < 1.5 × 10⁻¹¹), conventional genome-wide significance (P < 5 × 10⁻⁸) or a nominal P value threshold (P < 1 × 10⁻⁵) for the same protein or gene was compared to a permuted set of variants that were not pQTLs (P > 0.0001 for all proteins). We generated 10,000 permuted sets of null variants for each significance threshold matched for MAF, distance to TSS and LD (as described for functional annotation enrichment in ‘Functional annotation of pQTLs’). An empirical P value was calculated as the proportion of permuted variant sets where the proportion that are also cis eQTLs exceeded that of the test set of sentinel cis pQTL variants.
At a stringent eQTL significance threshold (P < 1.5 × 10⁻¹¹), we found significant enrichment of cis pQTLs for eQTLs (P < 0.0001) (Supplementary Table 11) with 19.5% overlap observed compared to a mean overlap of 1.8% in the null sets. Results were similar in sensitivity analyses using the standard genome-wide or nominal significance thresholds as well as when using only the sentinel variants at cis pQTLs that were robust to adjusting for PAVs (Supplementary Table 7), suggesting our results are robust to the choice of threshold and potential differential binding effects.
Colocalization analysis
Colocalization testing was performed using the coloc package62. For testing colocalization of pQTLs and disease associations, colocalization testing was necessarily limited to disease traits for which full GWAS summary statistics had been made available. We obtained GWAS summary statistics through PhenoScanner. For testing colocalization of pQTLs with eQTLs, we used publically available summary statistics for expression traits from GTEx28. We used the default priors. Regions for testing were determined by dividing the genome into 0.1-cM chunks using recombination data. Evidence for colocalization was assessed using the posterior probability (PP) for hypothesis 4 (that there is an association for both traits and they are driven by the same causal variant(s)). Associations with PP4 > 0.5 were deemed likely to colocalize as this gives hypothesis 4 the highest likelihood of being correct, while PP4 > 0.8 was deemed to be ‘highly likely to colocalize’.
Selection of genetic instruments for Mendelian randomization
In MR, genetic variants are used as ‘instrumental variables’ (IVs) for assessing the causal effect of the exposure (here a plasma protein) on the outcome (here a disease)11,63 (Extended Data Fig. 9).
Proteins in the IL1RL1–IL18R1 locus and atopic dermatitis
To identify the likely causal proteins that underpin the previous genetic association of the IL1RL1–IL18R1 locus (chr11:102.5–103.5Mb) with atopic dermatitis (AD)31, we used the following approach. For each protein encoded by a gene in the IL1RL1–IL18R1 locus, we took genetic variants that had a cis association at P < 1 × 10⁻⁴ and ‘LD-pruned’ them at r2 < 0.1 to leave largely independent variants. We then used these genetic variants to construct a genetic score for each protein. Formally, we used these variants as instrumental variables for their respective proteins in univariable MR. For multivariable MR, association estimates for all proteins in the locus were extracted for all instruments. We used PhenoScanner to obtain association statistics for the selected variants in the European-ancestry population of a recent large-scale GWAS meta-analysis of AD31. Where the relevant variant was not available, the strongest proxy with r2 ≥ 0.8 was used.
MMP-12 and coronary heart disease (CHD)
To test whether plasma MMP-12 levels have a causal effect on risk of CHD, we selected genetic variants in the MMP12 gene region to use as instrumental variables. We constructed a genetic score comprising 17 variants that had a cis association with MMP-12 levels at P < 5 × 10⁻⁸ and that were not highly correlated with one another (r2 < 0.2). To perform multivariable MR, we used association estimates for these variants with other MMP proteins in the locus (MMP-1, MMP-7, MMP-8, MMP-10, MMP-13). Summary associations for variants in the score with CHD were obtained through PhenoScanner from a recent large-scale GWAS meta-analysis which consisted mostly (77%) of individuals of European ancestry64.
MR analysis
Two-sample univariable MR was performed for each protein separately using summary statistics in the inverse-variance weighted method adapted to account for correlated variants65,66. For each of G genetic variants (g=1, …, G) having per-allele estimate of the association with the protein βXg and standard error σXg, and per-allele estimate of the association with the outcome (here, AD or CHD) βYg and standard error σYg, the IV estimate is obtained from generalized weighted linear regression of the genetic associations with the outcome (βY) on the genetic associations with the protein (βX) weighting for the precisions of the genetic associations with the outcome and accounting for correlations between the variants according to the regression model:
where βy and βx are vectors of the univariable (marginal) genetic associations, and the weighting matrix Ω has terms Ωg1g2 = σYg1 σYg2 ρg1g2, and ρg1g2 is the correlation between the g1th and g2th variants.
The IV estimate from this method is:
and the standard error is:
where T is a matrix transpose. This is the estimate and standard error from the regression model fixing the residual standard error to 1 (equivalent to a fixed-effects model in a meta-analysis).
Genetic variants in univariable MR need to satisfy three key assumptions to be valid instruments: (1) the variant is associated with the risk factor of interest (that is, the protein level), (2) the variant is not associated with any confounder of the risk factor-outcome association, and (3) the variant is conditionally independent of the outcome given the risk factor and confounders.
To account for potential effects of functional pleiotropy67, we performed multivariable MR using the weighted regression-based method proposed by Burgess et al.68. For each of K risk factors in the model (k = 1,…,K), the weighted regression-based method is performed by multivariable generalized weighted linear regression of the association estimates βY on each of the association estimates with each risk factor βXk in a single regression model:
where βX1 is the vectors of the univariable genetic associations with risk factor 1, and so on. This regression model is implemented by first pre-multiplying the association vectors by the Cholesky decomposition of the weighting matrix, and then applying standard linear regression to the transformed vectors. Estimates and standard errors are obtained fixing the residual standard error to be 1 as above.
The multivariable MR analysis allows the estimation of the causal effect of a protein on disease outcome accounting for the fact that genetic variants may be associated with multiple proteins in the region. Causal estimates from multivariable MR represent direct causal effects, representing the effect of intervening on one risk factor in the model while keeping others constant.
MMP-12 genetic score sensitivity analyses
We performed two sensitivity analyses to determine the robustness of the MR findings. First, we measured plasma MMP-12 levels using a different method (proximity extension assay; Olink Bioscience, Uppsala, Sweden13) in 4,998 individuals, and used this to derive genotype-MMP12 effect estimates for the 17 variants in our genetic score. Second, we obtained effect estimates from a pQTL study based on SOMAscan assay measurements in an independent sample of ~1,000 individuals3. In both cases the genetic score reflecting higher plasma MMP-12 was associated with lower risk of CHD.
Overlap of pQTLs with drug targets
We used the Informa Pharmaprojects data-base from Citeline to obtain information on drugs that target proteins assayed on the SOMAscan platform. This is a manually curated database that maintains profiles for >60,000 drugs. For our analysis, we focused on the following information for each drug: protein target, indications, and development status. We included drugs across the development pipeline, including those in pre-clinical studies or with no development reported, drugs in clinical trials (all phases), and launched/registered drugs. For each protein assayed, we identified all drugs in the Informa Pharmaprojects with a matching protein target based on UniProt ID. When multiple drugs targeted the same protein, we selected the drug with the latest stage of development.
For drug targets with significant pQTLs, we identified the subset where the sentinel variant or proxy variants in LD (r2 > 0.8) are also associated with disease risk through PhenoScanner. We used an internal Merck auto-encoding method to map GWAS traits and drug indications to a common set of terms from the Medical Dictionary for Regulatory Activities (MedDRA). MedDRA terms are organized into a hierarchy with five levels. We mapped each GWAS trait and indication onto the ‘lowest level terms’ (that is, the most specific terms available). All matching terms were recorded for each trait or indication. We matched GWAS traits to drug indications on the basis of the highest level of the hierarchy, called ‘system organ class’ (SOC). We designated a protein as ‘matching’ if at least one GWAS trait term matched with at least one indication term for at least one drug.
Extended Data
Extended Data Fig. 1. Flowchart of sample processing and quality control stages for proteomic and genetic measurements before genetic analyses.
Extended Data Fig. 2. Examples of protein targets for which the SOMAmer is highly specific.
SDS–PAGE with Alexa-647-labelled proteins captured by the IL1RL2 SOMAmer (a) or GP1BA SOMAmer (b). For each protein target, the protein captured by the SOMAmer is compared to the standard. The cognate targets are the only ones with protein visible in the capture lanes, whereas the proteins homologous to the target proteins show no evidence of binding. These experiments were performed once. MW markers, molecular weight markers.
Extended Data Fig. 3. Evidence for the reliability of protein measurements made using the SOMAscan assay.
a, Distribution of coefficients of variation of all proteins on the SOMAscan assay in each subcohort. b, Spearman’s correlations for all proteins passing QC derived from contemporaneous assay of baseline and two-year samples from 60 participants. c, Scatterplot of pQTL effect size estimates from SOMAscan versus Olink showing all 163 pQTLs tested (top) and the 106 that replicated (bottom). r is Pearson’s correlation coefficient. d, Distribution of inflation factors across proteins that underwent genome-wide association testing, stratified by subcohort and allele frequency (MAF ≥ 5%, MAF < 5%).
Extended Data Fig. 4. The WFIKKN2 region is a trans pQTL for GDF11/8 plasma levels.
a, Regional association plots of the trans pQTL (sentinel variant rs11079936) for GDF11/8 before and after adjusting for levels of WFIKKN2 (upper panels), and the WFIKKN2 cis pQTL after adjusting for GDF11/8 levels (bottom panel). A similar pattern of association for WFIKKN2 was seen before GDF11/8 adjustment (not shown). b, Attenuation of the GDF11/8 trans pQTL upon adjustment for plasma levels of the cis protein WFIKKN2.
Extended Data Fig. 5. Genetic architecture of the pQTLs.
pQTL mapping in n = 3,301 individuals. a, Distribution of the predicted consequences of the sentinel pQTL variants compared to matched permuted null sets of variants, stratified by cis and trans. Asterisks indicate empirical enrichment using a permutation test (10,000 permuted sets of non-associated variants) at a Bonferroni-corrected significance value (P < 0.005). Bar height represents the mean proportion of variants within each class and error bars reflect one standard deviation from the mean. b, Number of proteins associated (P < 1.5 × 10⁻¹¹) with each sentinel variant across the genome.
Extended Data Fig. 6. Enrichment of pQTLs at DNase I hypersensitive sites by tissue or cell type.
Circle shows enrichment for DNase I hypersensitive sites (‘hotspots’) for each of 55 tissues (183 cell types) available from the ENCODE and Roadmap Epigenomics projects, with tissues or cell types clustered and coloured by anatomical grouping. Some tissues have multiple values due to availability of multiple cell types or multiple tests per cell type. Radial lines show fold-enrichment, while dots around the inside edge of the circle denote statistically significant enrichment at a Bonferroni-corrected significant threshold P < 5 × 10⁻⁵. Enrichment testing performed using GARFIELD (which tests enrichment against permuted sets of variants matched for MAF, distance to TSS and LD). pQTL data from n = 3,301 individuals.
Extended Data Fig. 7. Scheme outlining the combined ‘bottom-up’ and ‘top-down’ process used for candidate gene annotation of trans pQTL regions.
See Methods. GbA, guilt-by-association; KEGG, Kyoto Encyclopedia of Genes and Genomes; OMIM, Online Mendelian Inheritance in Man; STRINGdb, STRING database.
Extended Data Fig. 8. Follow-up of PR3 SOMAmers.
These experiments were repeated three times independently with similar results. a, SOMAmer pulldowns with purified PR3, A1AT, and PR3–A1AT complex. SOMAmer PRTN3.3514.49.2 enriched the PR3–A1AT complex to a much greater degree than free PR3. Conversely, SOMAmer PRTN3.13720.95.3 enriched free PR3 to a greater degree than the PR3–A1AT complex. b, Solution affinity of PRTN3.3514.49.2 and PRTN3.13720.95.3 for PR3, A1AT, and the PR3–A1AT complex. SOMAmer PRTN3.3514.49.2 has a higher affinity for the PR3–A1AT complex than for free PR3. SOMAmer PRTN3.13720.95.3, on the other hand, has a higher affinity for free PR3 than SOMAmer PRTN3.3514.49.2. c, Competitive binding of SOMAmers PRTN3.13720.95.3 and PRTN3.3514.49.2 to PR3. A limiting amount of radiolabelled PRTN3.13720.95.3 was incubated with 1 nM proteinase-3 and a titration of either cold PRTN3.13720.95.3 or cold PRTN3.3514.49.2.
Extended Data Fig. 9. Comparison between a randomized controlled trial and Mendelian randomization to assess the causal effect of changes in protein biomarker levels on disease risk.
Extended Data Fig. 10. Characterization of protein targets measured using the SOMAscan assay.
a, Compartment distribution with annotations of all proteins in the Human Protein Atlas for comparison. b, GO molecular functions.
Supplementary Material
Supplementary information is available for this paper at https://doi.org/10.1038/s41586-018-0175-2.
Acknowledgements
A. Day-Williams, J. McElwee, D. Diogo, W. Astle, E. Di Angelantonio, E. Birney, A. Richard, J. Mason and M. Inouye commented on the manuscript, and M. Sharp helped with mapping drug indications to GWAS traits. We thank INTERVAL study participants; staff at recruiting NHSBT blood donation centres; and the INTERVAL Study Co-ordination team, Operations Team (led by R. Houghton and C. Moore) and Data Management Team (led by M. Walker). Funding sources are listed in the Supplementary Information.
Footnotes
Reporting summary. Further information on experimental design is available in the Nature Research Reporting Summary linked to this paper.
Data availability. Participant-level genotype and protein data, and full summary association results from the genetic analysis, are available through the European Genotype Archive (accession number EGAS00001002555). Summary association results are also publically available at http://www.phpc.cam.ac.uk/ceu/proteins/, through PhenoScanner (http://www.phenoscanner.medschl.cam.ac.uk) and from the NHGRI-EBI GWAS Catalog (https://www.ebi.ac.uk/gwas/downloads/summary-statistics).
Reviewer information Nature thanks T. Lappalainen, M. McCarthy and the other anonymous reviewer(s) for their contribution to the peer review of this work.
Author contributions Conceptualization and experimental design: J.D., A.S.B., B.B.S., H.R., R.M.P.; methodology: B.B.S., A.S.B., J.C.M., J.E.P., H.R., S.B.; conducted experimental work: N.J., S.K.W., E.S.Z.; analysis: B.B.S., J.C.M., J.E.P., D.S., J.B., J.R.S., T.J., E.P., P.S., C.O.-W., M.A.K., S.K.W., A.C., N.B., S.L.S.; contributed reagents, materials, protocols or analysis tools: N.J., S.K.W., E.S.Z., J.B., M.A.K., J.R.S., B.P.P.; supervision: A.S.B., H.R., J.D., R.M.P., C.S.F., D.S.P., A.M.W.; writing: A.S.B., J.E.P., B.B.S., J.C.M., H.R., J.D., J.A.T., N.S., K.S.; creation of the INTERVAL BioResource: J.R.B., D.J.R.,W.H.O., N.W.M., J.D.; funding: N.W.M., J.R.B., D.J.R., W.H.O., H.R., R.M.P., J.D.; all authors critically reviewed the manuscript.
Competing interests The authors declare the following competing interests: A.C., CSF-Merck employee; N.J., S.K.W., SomaLogic Inc employees and stakeholders; E.S.Z., SomaLogic Inc employee; J.C.M., R.M.P., Merck employees during this study, now Celgene employees; H.R., Merck employee during this study; J.E.P., travel and accommodation expenses and hospitality from Olink to speak at Olink-sponsored academic meetings; A.S.B., grants from Merck, Pfizer, Novartis, Biogen and Bioverativ and personal fees from Novartis; J.D., sits on the Novartis Cardiovascular and Metabolic Advisory Board, had grant support from Novartis.
Extended data is available for this paper at https://doi.org/10.1038/s41586-018-0175-2.
Reprints and permissions information is available at http://www.nature.com/reprints.
Publisher’s note: Springer Nature remains neutral with regard to jurisdictional claims in published maps and institutional affiliations.
References
- 1.Albert FW, Kruglyak L. The role of regulatory variation in complex traits and disease. Nat Rev Genet. 2015;16:197–212. doi: 10.1038/nrg3891. [DOI] [PubMed] [Google Scholar]
- 2.Liu Y, et al. Quantitative variability of 342 plasma proteins in a human twin population. Mol Syst Biol. 2015;11:786. doi: 10.15252/msb.20145728. [DOI] [PMC free article] [PubMed] [Google Scholar]
- 3.Suhre K, et al. Connecting genetic risk to disease end points through the human blood plasma proteome. Nat Commun. 2017;8 doi: 10.1038/ncomms14357. 14357. [DOI] [PMC free article] [PubMed] [Google Scholar]
- 4.Yao C, et al. Genome-wide association study of plasma proteins identifies putatively causal genes, proteins, and pathways for cardiovascular disease. 2017 Preprint at https://www.biorxiv.org/content/early/2017/05/12/136523.
- 5.de Vries PS, et al. Whole-genome sequencing study of serum peptide levels: the Atherosclerosis Risk in Communities study. Hum Mol Genet. 2017;26:3442–3450. doi: 10.1093/hmg/ddx266. [DOI] [PMC free article] [PubMed] [Google Scholar]
- 6.Wu L, et al. Variation and genetic control of protein abundance in humans. Nature. 2013;499:79–82. doi: 10.1038/nature12223. [DOI] [PMC free article] [PubMed] [Google Scholar]
- 7.Battle A, et al. Impact of regulatory variation from RNA to protein. Science. 2015;347:664–667. doi: 10.1126/science.1260793. [DOI] [PMC free article] [PubMed] [Google Scholar]
- 8.Rohloff JC, et al. Nucleic acid ligands with protein-like side chains: modified aptamers and their use as diagnostic and therapeutic agents. Mol Ther Nucleic Acids. 2014;3:e201. doi: 10.1038/mtna.2014.49. [DOI] [PMC free article] [PubMed] [Google Scholar]
- 9.Di Angelantonio E, et al. Efficiency and safety of varying the frequency of whole blood donation (INTERVAL): a randomised trial of 45 000 donors. Lancet. 2017;390:2360–2371. doi: 10.1016/S0140-6736(17)31928-1. [DOI] [PMC free article] [PubMed] [Google Scholar]
- 10.Astle WJ, et al. The allelic landscape of human blood cell trait variation and links to common complex disease. Cell. 2016;167:1415–1429.e19. doi: 10.1016/j.cell.2016.10.042. [DOI] [PMC free article] [PubMed] [Google Scholar]
- 11.Burgess S, Scott RA, Timpson NJ, Davey Smith G, Thompson SG. Using published data in Mendelian randomization: a blueprint for efficient identification of causal risk factors. Eur J Epidemiol. 2015;30:543–552. doi: 10.1007/s10654-015-0011-z. [DOI] [PMC free article] [PubMed] [Google Scholar]
- 12.Stranger BE, et al. Patterns of cis regulatory variation in diverse human populations. PLoS Genet. 2012;8:e1002639. doi: 10.1371/journal.pgen.1002639. [DOI] [PMC free article] [PubMed] [Google Scholar]
- 13.Lundberg M, Eriksson A, Tran B, Assarsson E, Fredriksson S. Homogeneous antibody-based proximity extension assays provide sensitive and specific detection of low-abundant proteins in human blood. Nucleic Acids Res. 2011;39:e102. doi: 10.1093/nar/gkr424. [DOI] [PMC free article] [PubMed] [Google Scholar]
- 14.Walter K, et al. The UK10K project identifies rare variants in health and disease. Nature. 2015;526:82–90. doi: 10.1038/nature14962. [DOI] [PMC free article] [PubMed] [Google Scholar]
- 15.Westra H-J, et al. Systematic identification of trans eQTLs as putative drivers of known disease associations. Nat Genet. 2013;45:1238–1243. doi: 10.1038/ng.2756. [DOI] [PMC free article] [PubMed] [Google Scholar]
- 16.Lappalainen T, et al. Transcriptome and genome sequencing uncovers functional variation in humans. Nature. 2013;501:506–511. doi: 10.1038/nature12531. [DOI] [PMC free article] [PubMed] [Google Scholar]
- 17.Schadt EE, et al. Mapping the genetic architecture of gene expression in human liver. PLoS Biol. 2008;6:e107. doi: 10.1371/journal.pbio.0060107. [DOI] [PMC free article] [PubMed] [Google Scholar]
- 18.Zeller T, et al. Genetics and beyond—the transcriptome of human monocytes and disease susceptibility. PLoS ONE. 2010;5:e10693. doi: 10.1371/journal.pone.0010693. [DOI] [PMC free article] [PubMed] [Google Scholar]
- 19.Nai A, et al. TMPRSS6 rs855791 modulates hepcidin transcription in vitro and serum hepcidin levels in normal individuals. Blood. 2011;118:4459–4462. doi: 10.1182/blood-2011-06-364034. [DOI] [PubMed] [Google Scholar]
- 20.Carrasquillo MM, et al. Genome-wide screen identifies rs646776 near sortilin as a regulator of progranulin levels in human plasma. Am J Hum Genet. 2010;87:890–897. doi: 10.1016/j.ajhg.2010.11.002. [DOI] [PMC free article] [PubMed] [Google Scholar]
- 21.Gooptu B, Dickens JA, Lomas DA. The molecular and cellular pathology of α1-antitrypsin deficiency. Trends Mol Med. 2014;20:116–127. doi: 10.1016/j.molmed.2013.10.007. [DOI] [PubMed] [Google Scholar]
- 22.Stacey D, et al. ProGeM: A framework for the prioritisation of candidate causal genes at molecular quantitative trait loci. 2017 doi: 10.1101/230094. [DOI] [PMC free article] [PubMed] [Google Scholar]
- 23.Liu JZ, et al. Association analyses identify 38 susceptibility loci for inflammatory bowel disease and highlight shared genetic risk across populations. Nat Genet. 2015;47:979–986. doi: 10.1038/ng.3359. [DOI] [PMC free article] [PubMed] [Google Scholar]
- 24.Di Narzo AF, et al. High-throughput characterization of blood serum proteomics of IBD patients with respect to aging and genetic factors. PLoS Genet. 2017;13:e1006565. doi: 10.1371/journal.pgen.1006565. [DOI] [PMC free article] [PubMed] [Google Scholar]
- 25.Huang H, et al. Fine-mapping inflammatory bowel disease loci to single-variant resolution. Nature. 2017;547:173–178. doi: 10.1038/nature22969. [DOI] [PMC free article] [PubMed] [Google Scholar]
- 26.Lyons PA, et al. Genetically distinct subsets within ANCA-associated vasculitis. N Engl J Med. 2012;367:214–223. doi: 10.1056/NEJMoa1108735. [DOI] [PMC free article] [PubMed] [Google Scholar]
- 27.Merkel PA, et al. Identification of functional and expression polymorphisms associated with risk for anti-neutrophil cytoplasmic autoantibody-associated vasculitis. Arthritis Rheumatol. 2017;69:1054–1066. doi: 10.1002/art.40034. [DOI] [PMC free article] [PubMed] [Google Scholar]
- 28.Battle A, Brown CD, Engelhardt BE, Montgomery SB. Genetic effects on gene expression across human tissues. Nature. 2017;550:204–213. doi: 10.1038/nature24277. [DOI] [PMC free article] [PubMed] [Google Scholar]
- 29.Grönberg H, et al. Prostate cancer screening in men aged 50-69 years (STHLM3): a prospective population-based diagnostic study. Lancet Oncol. 2015;16:1667–1676. doi: 10.1016/S1470-2045(15)00361-7. [DOI] [PubMed] [Google Scholar]
- 30.Eeles RA, et al. Multiple newly identified loci associated with prostate cancer susceptibility. Nat Genet. 2008;40:316–321. doi: 10.1038/ng.90. [DOI] [PubMed] [Google Scholar]
- 31.Paternoster L, et al. Multi-ancestry genome-wide association study of 21,000 cases and 95,000 controls identifies new risk loci for atopic dermatitis. Nat Genet. 2015;47:1449–1456. doi: 10.1038/ng.3424. [DOI] [PMC free article] [PubMed] [Google Scholar]
- 32.Dahl R, et al. Effects of an oral MMP-9 and -12 inhibitor, AZD1236, on biomarkers in moderate/severe COPD: a randomised controlled trial. Pulm Pharmacol Ther. 2012;25:169–177. doi: 10.1016/j.pupt.2011.12.011. [DOI] [PubMed] [Google Scholar]
- 33.Ganz P, et al. Development and validation of a protein-based risk score for cardiovascular outcomes among patients with stable coronary heart disease. J Am Med Assoc. 2016;315:2532–2541. doi: 10.1001/jama.2016.5951. [DOI] [PubMed] [Google Scholar]
- 34.Traylor M, et al. A novel MMP12 locus is associated with large artery atherosclerotic stroke using a genome-wide age-at-onset informed approach. PLoS Genet. 2014;10:e1004469. doi: 10.1371/journal.pgen.1004469. [DOI] [PMC free article] [PubMed] [Google Scholar]
- 35.Nelson MR, et al. The support of human genetic evidence for approved drug indications. Nat Genet. 2015;47:856–860. doi: 10.1038/ng.3314. [DOI] [PubMed] [Google Scholar]
- 36.Albagha OME, et al. Genome-wide association study identifies variants at CSF1, OPTN and TNFRSF11A as genetic risk factors for Paget’s disease of bone. Nat Genet. 2010;42:520–524. doi: 10.1038/ng.562. [DOI] [PMC free article] [PubMed] [Google Scholar]
- 37.Schwarz P, Rasmussen AQ, Kvist TM, Andersen UB, Jørgensen NR. Paget’s disease of the bone after treatment with Denosumab: a case report. Bone. 2012;50:1023–1025. doi: 10.1016/j.bone.2012.01.020. [DOI] [PubMed] [Google Scholar]
- 38.Moore C, et al. The INTERVAL trial to determine whether intervals between blood donations can be safely and acceptably decreased to optimise blood supply: study protocol for a randomised controlled trial. Trials. 2014;15:363. doi: 10.1186/1745-6215-15-363. [DOI] [PMC free article] [PubMed] [Google Scholar]
- 39.Gold L, et al. Aptamer-based multiplexed proteomic technology for biomarker discovery. PLoS ONE. 2010;5:e15004. doi: 10.1371/journal.pone.0015004. [DOI] [PMC free article] [PubMed] [Google Scholar]
- 40.Sattlecker M, et al. Alzheimer’s disease biomarker discovery using SOMAscan multiplexed protein technology. Alzheimers Dement. 2014;10:724–734. doi: 10.1016/j.jalz.2013.09.016. [DOI] [PubMed] [Google Scholar]
- 41.McLaren W, et al. Deriving the consequences of genomic variants with the Ensembl API and SNP Effect Predictor. Bioinformatics. 2010;26:2069–2070. doi: 10.1093/bioinformatics/btq330. [DOI] [PMC free article] [PubMed] [Google Scholar]
- 42.UniProt Consortium. UniProt: a hub for protein information. Nucleic Acids Res. 2015;43:D204–D212. doi: 10.1093/nar/gku989. [DOI] [PMC free article] [PubMed] [Google Scholar]
- 43.Ashburner M, et al. The Gene Ontology Consortium Gene ontology: tool for the unification of biology. Nat Genet. 2000;25:25–29. doi: 10.1038/75556. [DOI] [PMC free article] [PubMed] [Google Scholar]
- 44.Menni C, et al. Circulating proteomic signatures of chronological age. J Gerontol A Biol Sci Med Sci. 2015;70:809–816. doi: 10.1093/gerona/glu121. [DOI] [PMC free article] [PubMed] [Google Scholar]
- 45.Ngo D, et al. Aptamer-based proteomic profiling reveals novel candidate biomarkers and pathways in cardiovascular disease. Circulation. 2016;134:270–285. doi: 10.1161/CIRCULATIONAHA.116.021803. [DOI] [PMC free article] [PubMed] [Google Scholar]
- 46.Chang CC, et al. Second-generation PLINK: rising to the challenge of larger and richer datasets. Gigascience. 2015;4:7. doi: 10.1186/s13742-015-0047-8. [DOI] [PMC free article] [PubMed] [Google Scholar]
- 47.Marchini J, Howie B, Myers S, McVean G, Donnelly P. A new multipoint method for genome-wide association studies by imputation of genotypes. Nat Genet. 2007;39:906–913. doi: 10.1038/ng2088. [DOI] [PubMed] [Google Scholar]
- 48.Willer CJ, Li Y, Abecasis GR. METAL: fast and efficient meta-analysis of genomewide association scans. Bioinformatics. 2010;26:2190–2191. doi: 10.1093/bioinformatics/btq340. [DOI] [PMC free article] [PubMed] [Google Scholar]
- 49.Yang J, et al. Conditional and joint multiple-SNP analysis of GWAS summary statistics identifies additional variants influencing complex traits. Nat Genet. 2012;44:369–375. doi: 10.1038/ng.2213. [DOI] [PMC free article] [PubMed] [Google Scholar]
- 50.Welter D, et al. The NHGRI GWAS Catalog, a curated resource of SNP-trait associations. Nucleic Acids Res. 2014;42:D1001–D1006. doi: 10.1093/nar/gkt1229. [DOI] [PMC free article] [PubMed] [Google Scholar]
- 51.Malone J, et al. Modeling sample variables with an Experimental Factor Ontology. Bioinformatics. 2010;26:1112–1118. doi: 10.1093/bioinformatics/btq099. [DOI] [PMC free article] [PubMed] [Google Scholar]
- 52.Javierre BM, et al. Lineage-specific genome architecture links enhancers and non-coding disease variants to target gene promoters. Cell. 2016;167:1369–1384.e19. doi: 10.1016/j.cell.2016.09.037. [DOI] [PMC free article] [PubMed] [Google Scholar]
- 53.Lawrence M, et al. Software for computing and annotating genomic ranges. PLOS Comput Biol. 2013;9:e1003118. doi: 10.1371/journal.pcbi.1003118. [DOI] [PMC free article] [PubMed] [Google Scholar]
- 54.Amberger JS, Bocchini CA, Schiettecatte F, Scott AF, Hamosh A. OMIM. org: Online Mendelian Inheritance in Man (OMIM®), an online catalog of human genes and genetic disorders. Nucleic Acids Res. 2015;43:D789–D798. doi: 10.1093/nar/gku1205. [DOI] [PMC free article] [PubMed] [Google Scholar]
- 55.Kanehisa M, Sato Y, Kawashima M, Furumichi M, Tanabe M. KEGG as a reference resource for gene and protein annotation. Nucleic Acids Res. 2016;44:D457–D462. doi: 10.1093/nar/gkv1070. [DOI] [PMC free article] [PubMed] [Google Scholar]
- 56.Szklarczyk D, et al. STRINGv10: protein-protein interaction networks, integrated over the tree of life. Nucleic Acids Res. 2015;43:D447–D452. doi: 10.1093/nar/gku1003. [DOI] [PMC free article] [PubMed] [Google Scholar]
- 57.Smith RN, et al. InterMine: a flexible data warehouse system for the integration and analysis of heterogeneous biological data. Bioinformatics. 2012;28:3163–3165. doi: 10.1093/bioinformatics/bts577. [DOI] [PMC free article] [PubMed] [Google Scholar]
- 58.Franceschini A, et al. STRINGv9.1: protein–protein interaction networks, with increased coverage and integration. Nucleic Acids Res. 2013;41:D808–D815. doi: 10.1093/nar/gks1094. [DOI] [PMC free article] [PubMed] [Google Scholar]
- 59.Lek M, et al. Analysis of protein-coding genetic variation in 60,706 humans. Nature. 2016;536:285–291. doi: 10.1038/nature19057. [DOI] [PMC free article] [PubMed] [Google Scholar]
- 60.Iotchkova V, et al. GARFIELD—GWAS Analysis of Regulatory or Functional Information Enrichment with LD correction. 2016 Preprint at https://www.biorxiv.org/content/early/2016/11/07/085738.
- 61.Staley JR, et al. PhenoScanner: a database of human genotype–phenotype associations. Bioinformatics. 2016;32:3207–3209. doi: 10.1093/bioinformatics/btw373. [DOI] [PMC free article] [PubMed] [Google Scholar]
- 62.Giambartolomei C, et al. Bayesian test for colocalisation between pairs of genetic association studies using summary statistics. PLoS Genet. 2014;10:e1004383. doi: 10.1371/journal.pgen.1004383. [DOI] [PMC free article] [PubMed] [Google Scholar]
- 63.Hingorani A, Humphries S. Nature’s randomised trials. Lancet. 2005;366:1906–1908. doi: 10.1016/S0140-6736(05)67767-7. [DOI] [PubMed] [Google Scholar]
- 64.Nikpay M, et al. A comprehensive 1,000 Genomes-based genome-wide association meta-analysis of coronary artery disease. Nat Genet. 2015;47:1121–1130. doi: 10.1038/ng.3396. [DOI] [PMC free article] [PubMed] [Google Scholar]
- 65.Burgess S, Butterworth A, Thompson SG. Mendelian randomization analysis with multiple genetic variants using summarized data. Genet Epidemiol. 2013;37:658–665. doi: 10.1002/gepi.21758. [DOI] [PMC free article] [PubMed] [Google Scholar]
- 66.Burgess S, Dudbridge F, Thompson SG. Combining information on multiple instrumental variables in Mendelian randomization: comparison of allele score and summarized data methods. Stat Med. 2016;35:1880–1906. doi: 10.1002/sim.6835. [DOI] [PMC free article] [PubMed] [Google Scholar]
- 67.Burgess S, Thompson SG. Multivariable Mendelian randomization: the use of pleiotropic genetic variants to estimate causal effects. Am J Epidemiol. 2015;181:251–260. doi: 10.1093/aje/kwu283. [DOI] [PMC free article] [PubMed] [Google Scholar]
- 68.Burgess S, Dudbridge F, Thompson SG. Re: “Multivariable Mendelian randomization: the use of pleiotropic genetic variants to estimate causal effects”. Am J Epidemiol. 2015;181:290–291. doi: 10.1093/aje/kwv017. [DOI] [PubMed] [Google Scholar]
Associated Data
This section collects any data citations, data availability statements, or supplementary materials included in this article.


