

SUMMARY
Small molecule targeted recruitment of nucleases to RNA is a powerful method to affect RNA biology. Inforna, a sequence-based design approach to target RNA, enables the design of small molecules that bind and cleave RNA in a selective and substoichiometric manner. Herein, we investigate the ability of RNA targeted degradation to improve the selectivity of small molecules targeting RNA. The microRNA-210 hairpin precursor (pre-miR-210) is overexpressed in hypoxic cancers. Previously, a small molecule (Targapremir-210, TGP-210) targeted this RNA in cells, but with only a 5-fold window for DNA binding. Appendage of a nuclease recruitment module onto TGP-210 locally recruited ribonuclease L onto pre-miR-210, triggering its degradation. The chimera has enhanced selectivity compared to TGP-210 with nanomolar binding to the pre-miR-210, but no DNA binding, and is broadly selective for affecting RNA function in cells. Importantly, it cleaved pre-miR-210 substoichiometrically and induced apoptosis in breast cancer cells.
Graphical Abstract
eTOC Blurb
Costales et. al. study the selectivity of a bifunctional molecule that binds a hypoxia-associated microRNA and recruits local latent ribonuclease, enabling its targeted degradation and apoptosis in breast cancer cells. Applying this chimeric recruitment strategy increases potency and the selectivity window compared to the parent compound.
INTRODUCTION
RNA drug targets are pervasive in all cells and essentially all disease settings (Angelbello et al., 2018; Connelly et al., 2016; Donlic and Hargrove, 2018). The most common way to target RNA is to target unstructured regions with oligonucleotide-based methods that typically affect RNA biology by binding to complementary RNA to recruit endogenous ribonuclease H (RNase H), which then cleaves the RNA target. Oligonucleotides have been transformative medicines; however, they have platform-specific toxicities when delivered peripherally, such as thrombocytopenia in man (Frazier, 2015). Small molecules can be an alternative approach to target RNA as they have historically been lead medicines and their chemical matter can be broadly medicinally optimized (Disney et al., 2018; Rizvi and Smith, 2017). Human RNA, however, is thought to be recalcitrant to small molecule targeting and as such is classified as undruggable. Obtaining bioactive small molecules targeting human RNAs is challenging and thus general solutions to this complex molecular recognition problem requires new approaches.
Ideally, lead small molecules would be designed via sequence-based approaches, to broadly target and cleave RNA, similar to antisense oligonucleotides. Our group has set out to develop potentially generalizable and scalable methods to target RNA with small molecules from sequence. For example, we developed a library versus library screen termed two-dimensional combinatorial screening (2DCS) to define and score three-dimensionally folded RNA motif-small molecule interactions (Disney et al., 2008). These interactions are put into the Inforna server to enable rational design (Velagapudi et al., 2014). Inforna analyzes RNA sequence for folded structures that are found to bind small molecules from the 2DCS studies. This approach has defined bioactive compounds targeting both coding and non-coding RNAs broadly throughout the transcriptome and has enabled the design of lead molecules affecting function in human cells to pre-clinical animal models (Luo and Disney, 2014; Velagapudi et al., 2016).
Previously, Inforna enabled the design of a small molecule, Targapremir-210 (TGP-210), that targets the microRNA-210 hairpin precursor (Costales et al., 2017). MicroRNAs are initially synthesized as primary transcripts (pri-miRs) in the nucleus and are cleaved by the nuclease Drosha to generate a precursor microRNA hairpin (pre-miR) that is translocated to the cytoplasm where the cytoplasmic nuclease Dicer cleaves the RNA to liberate the mature microRNA (miR) (Bartel, 2004). These miR targets are dysregulated in a variety of disease settings (Bracken et al., 2016). For example, miR-210 is upregulated in cells that are hypoxic or are in a low oxygen environment. When cancer cells undergo hypoxia, cells begin to exhibit behavior associated with extracellular matrix remodeling and increased migratory and metastatic properties (Bavelloni et al., 2017). In humans, metastatic breast cancer can be detected via a liquid biopsy via miR-210 (Jung et al., 2012).
In hypoxic cancers, miR-210 functions by targeting the glycerol-3-phosphate dehydrogenase 1-like (GDP1L) mRNA to repress its translation. In a normoxic environment, the GPD1L protein binds to prolyl hydroxylase (PHD) to promote hyperhydroxylation of hypoxia inducible factor 1-alpha (HIF1α), thus mediating the polyubiquitination and subsequent degradation of this protein by the proteasome (Figure 1A) (Huang et al., 2009; Mathew and Simon, 2009). At low oxygen concentrations, such as in solid breast cancer tumors, miR-210 represses GPD1L mRNA that in turn, decreases PHD activity, stabilizing cytoplasmic HIF1α levels, allowing for its dimerization with hypoxia inducible factor 1-beta (HIF1β) in the nucleus, to form the active HIF1 transcription factor to turn on hypoxia-associated genes (Figure 1A). As miR-210 is among the genes upregulated by HIF1, overexpressed miR-210 triggers a positive feedback loop to drive further miR-210 expression (Kelly et al., 2011).
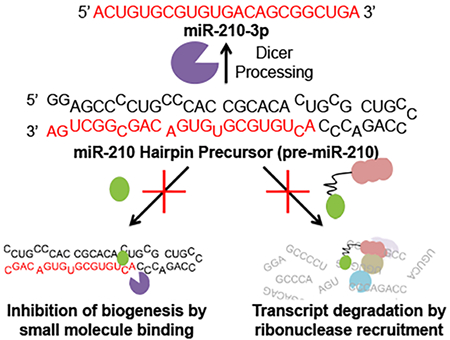
Figure 1. Overview of the microRNA-210 (miR-210) pathway and small molecule-mediated approaches for its inhibition.
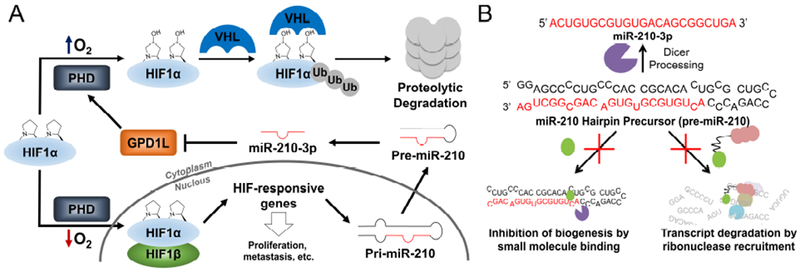
(A) MicroRNA-210 targets GPD1L, propagating a positive feedback loop with HIF1α. GPD1L, glycerol-3-phosphate dehydrogenase 1-like enzyme; HIF-1α, hypoxia-inducible factor 1-alpha; HIF-1β, hypoxia-inducible factor 1-beta; PHD, prolyl hydroxylase; Ub, ubiquitin; VHL, Von Hippel–Lindau tumor suppressor (E3 ubiquitin protein ligase); Pri-miR-210, microRNA-210 primary transcript; Pre-miR-210, miR-210 precursor. (B) Strategies to inhibit mature miR-210–3p levels using small molecules by binding to the Dicer site of the miR-210 hairpin precursor (pre-miR-210) to inhibit biogenesis or by small molecule-mediated RNA cleavage by local recruitment of latent ribonuclease (RNase L) to pre-miR-210.
The small molecule TGP-210 targets the Dicer site in pre-miR-210 and inhibits its Dicer processing, thus decreasing the biogenesis of mature miR-210-3p (Figure 1B) (Costales et al., 2017). This lead compound disrupted downstream hypoxic processes by enhancing GPD1L production to cause HIF1α dysregulation, resulting in apoptosis of only hypoxic cells. Apoptosis caused by the TGP-210 compound also inhibited tumor growth in a triple negative breast cancer mouse model and is a lead targeted therapeutic. In this study, we apply targeted RNA degradation approaches to improve the activity of the TGP-210 small molecule (Figures 1B and 2A).
Figure 2. In vitro cleavage and binding selectivity of TGP-210-RL.
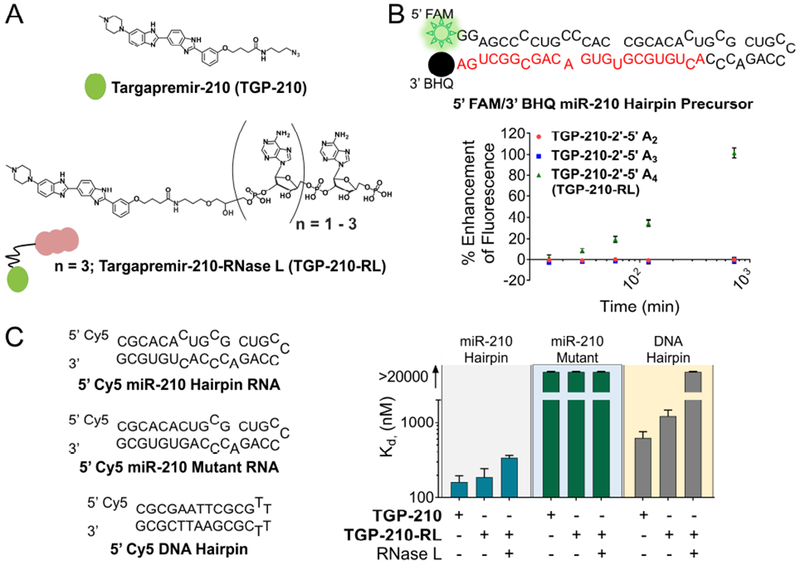
(A) Compounds used in this study. (B) Fluorescent cleavage assay with different lengths of 2’-5’ oligoadenylate attached to TGP-210, identifies linkage to 2’-5’ A4 as the active compound, TGP-210-RL. (C) Binding affinity of TGP-210, TGP-210-RL, and TGP-210-RL + RNase L to 5’ Cy5-labeled miR-210 Hairpin RNA, miR-210 Mutant RNA, and a DNA Hairpin by microscale thermophoresis (MST) analysis. Data represent means ± SEM of triplicates. See also Figure S1.
RESULTS & DISCUSSION
Previously, we have shown that attachment of short 2’-5’-linked oligoadenylate units (2’-5’ A) to RNA binding small molecules allows for the local targeted recruitment of latent ribonuclease (RNase L) to cleave RNAs in cells to which the small molecule binds (Costales et al., 2018). RNase L is an interferon-inducible endonuclease that, upon activation by 2’-5’ A, cleaves RNA in response to viral infections (Chakrabarti et al., 2011). We attached various units of 2’-5’ An (n = 2 – 4) to TGP-210 and tested the ability of these compounds to cleave pre-miR-210 using a fluorescent in vitro cleavage assay (Figures 2A and 2B). These studies showed that TGP-210 linked to 2’-5’ A4 (heretofore named TGP-210-RL) had the most potent cleavage effect (Figure 2B). Very limited cleavage activity was observed for the TGP-210 derivatives appended with the dimer and trimer 2’-5’ oligoadenylates (Figure 2B). Activation of RNase L, which is present in an inactive monomeric form in cells, only occurs upon its oligomerization by binding to 2’-5’ A, thus TGP-210-RL was tested for its ability to activate RNase L (Khabar et al., 2003). In vitro cross-linking studies of RNase L showed dose-responsive oligomerization of RNase L with TGP-210-RL, but not with TGP-210 treatment (Figure S1A).
The parent TGP-210 compound is known to bind DNA with a 5-fold selectivity window over the Dicer site in pre-miR-210 (Kd to DNA is 620 nM while Kd to pre-miR-210 mimic is 160 nM) (Figures 2C and S1B–S1D). To study the binding consequences of adding the 2’-5’ A4 nuclease recruiting module, binding affinities were measured by microscale thermophoresis (MST) to these targets with TGP-210-RL (Moon et al., 2018; Velagapudi et al., 2018; Costales et al., 2018). In these studies, the affinity to the pre-miR-210 mimic is modestly weaker compared to TGP-210 with a Kd of 190 nM (Figures 2C and S1B). The binding of TGP-210-RL to DNA increased to a 10-fold window of selectivity, occurring with a Kd of 1200 nM (Figure 2C). The TGP-210-RL did not bind to an RNA in which the Dicer site was mutated to a base pair, further demonstrating selective binding (Figures 2C and S1C). Since reports from heterobifunctional, proteolysis targeting chimeras (PROTACs) have shown that ternary complex formation (target:PROTAC:ligase) is important for activity and that PROTACs can have higher selectivity than their respective protein binding modules, the binding affinity of TGP-210-RL to pre-miR-210 and DNA was measured in the presence of RNase L (Bondeson et al., 2018). These studies showed that TGP-210-RL maintained selective binding to RNA with a Kd of 340 nM to pre-miR-210, while DNA binding was completely ablated with no measurable binding (Figures 2C and S1D). Thus, addition of the recruiter enhanced the binding selectivity of the RNA-targeted small molecule in vitro. Indeed, TGP-210-RL binding and recruitment of RNase L enabled in vitro cleavage of pre-miR-210 as observed by gel (Figure S1E). The biophysical characteristics of the ternary complex are extremely important to tune for affecting biological activity as has been shown in analyses of targeted protein degraders (Fisher and Phillips, 2018; Gadd et al., 2017; Hughes and Ciulli, 2017).
The compound TGP-210-RL was next tested for cellular permeability. The molecule was freely cell permeable and despite having the short oligonucleotide, it entered cells at 60% of the amount relative to the parent compound TGP-210, as measured by flow cytometry (Figure S2A). Confocal microscopy was further completed and the intrinsic fluorescence of the parent TGP-210 compound was localized mainly to the nucleus while the signal from TGP-210-RL was localized to the cytoplasm (Figure S2B). Similar to other short length, cell-permeable modified oligonucleotides, significant cell uptake of the TGP-210-RL small molecule-oligoadenylate conjugate was observed (Mykowska et al., 2015; Obad et al., 2011; Stein et al., 2010). The DNA off-targets are exclusively nuclear while the RNA pre-miR-210 is exclusively cytoplasmic. Furthermore, RNase L is predominantly localized to the cytoplasm in confluent cells (Al-Ahmadi et al., 2009). Collectively, both the binding affinity and localization experiments suggest that addition of the RNase L recruiting module enhanced the properties of the chimera for targeting pre-miR-210.
To assess the cellular effects of the compounds, TGP-210, TGP-210-RL, and 2’-5 A4 were tested for affecting miR-210 in hypoxic MDA-MB-231 cells. Both TGP-210 and TGP-210-RL decreased the levels of mature miR-210 as expected (Figure 3A). An increase in pre-miR-210 levels was observed with TGP-210 treatment, which is expected as the compound inhibits Dicer processing of this RNA in cells (Figure 3B). In contrast, TGP-210-RL decreased the levels of both miR-210 and pre-miR-210 and these results are expected if the compound actively cleaves the pre-miR-210 target transcript (Figures 3A and 3B). Only TGP-210 linked with 4 units of 2’-5’ A caused cleavage in cells, similar to the in vitro results (Figure S2C). Addition of the 2’-5’ A4 compound resulted in no significant effect on miR-210 and pre-miR-210 at any concentration tested, showing that cleavage is specific for having the RNA binder and the RNase L recruiter on a single compound, TGP-210-RL (Figure S2D) as has been previously observed (Costales et al., 2018).
Figure 3. On-target degradation of miR-210 in hypoxic MDA-MB-231 triple negative breast cancer cells by RNase L recruitment through TGP-210-RL.
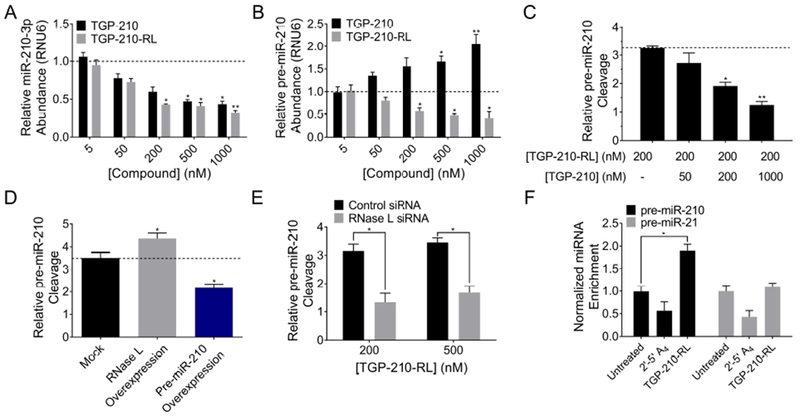
(A) Mature and (B) precursor miR-210 levels upon TGP-210 or TGP-210-RL treatment, as measured by RT-qPCR. (C) Cleavage of pre-miR-210 by TGP-210-RL was decreased upon parent compound TGP-210 competition. (D) Plasmid overexpression of RNase L or pre-miR-210 enhances or reduces TGP-210-RL (200 nM) cleavage activity, respectively. (E) Cleavage of pre-miR-210 by TGP-210-RL is reduced upon RNase L siRNA treatment, but not with control siRNA treatment. (F) Only upon TGP-210-RL (200 nM) treatment, RNase L immunoprecipitated fractions exhibit enriched pre-miR-210 levels, but not pre-miR-21 levels. *p < 0.05, **p < 0.01, as determined by a two-tailed Student t test. Data represent means ± SEM of biological triplicates. See also Figure S2 and Table S1.
To study if the pre-miR-210 cleaving capacity of TGP-210-RL was specific for RNase L, a series of control experiments were completed. First, cells were treated concurrently with a constant concentration of TGP-210-RL and increasing amounts of TGP-210 to bind to the pre-miR-210 target and compete off the nuclease recruiter. In these experiments, as the specific cleaving chimera and the parent compound compete for occupancy of the same binding site in pre-miR-210, addition of TGP-210 caused a decrease in cleavage of pre-miR-210 (Figure 3C). Second, transfection of RNase L to cells and followed by treatment with TGP-210-RL enhanced the cleavage capacity of the compound, while transfection of a plasmid overexpressing the pre-miR-210 target decreased the cleavage capacity of the compound (Figure 3D). These gain- and loss-of-function experiments indicate the RNase L dependence and pre-miR-210 selectivity of the cleavage caused by TGP-210-RL. Third, targeted siRNA ablation of RNase L, but not a control siRNA, decreased the cleavage of pre-miR-210 by TGP-210-RL (Figure 3E). These studies demonstrated that TGP-210-RL specifically cleaves pre-miR-210 via the targeted recruitment of RNase L to the target.
To measure if TGP-210-RL physically interacts and forms a ternary complex with RNase L and pre-miR-210 in cells, a co-immunoprecipitation experiment was completed by using an anti-RNase L antibody. In these experiments, immunoprecipitation was completed and the pulled down fraction was subjected to RT-qPCR with primers to detect pre-miR-210. An enrichment of pre-miR-210 in the RNase L-pulled down fraction was observed only when TGP-210-RL was applied in cells, while there was no enrichment in a highly expressed control microRNA hairpin precursor transcript, pre-miR-21 (Figure 3F). Furthermore, no enrichment of pre-miR-210 was observed with 2’-5’ A4 treatment, as expected (Figure 3F).
The TGP-210-RL compound cleaves pre-miR-210 in a catalytic and substoichiometric fashion. Using the intrinsic fluorescence of TGP-210-RL and quantitative RT-qPCR, the number of molecules of TGP-210-RL and the copies of pre-miR-210 cleaved by TGP-210-RL were measured in cells (Table S1). These analyses demonstrate that TGP-210-RL substoichiometrically cleaved 9.7 ± 1.9 molecules of pre-miR-210 per each molecule of TGP-210-RL after treatment for 24 h in cells (Table S1).
Next, the specificity of TGP-210-RL was broadly studied across many miRs via qPCR profiling to study the effects on all of the detectable miRs in MBD-MB-231 cells. Among over 370 detectible miRs, the most significantly inhibited was miR-210, demonstrating that small molecules that bind to pre-miR-210 and locally recruit Rnase L are selective (Figure 4A). No significant effect of TGP-210-RL on other hypoxia associated miRs and pre-miR-210 RNA isoforms, or RNAs with similar structure to pre-miR-210, was observed (Figure 4A). As pre-miR-210 ultimately affects GPD1L and thus HIF1α levels, their mRNA transcript levels were measured by RT-qPCR at 24 h and 48 h time points. As expected, upon TGP-210-RL treatment, GPD1L mRNA abundance was significantly de-repressed, while HIF1α mRNA was significantly decreased only after 48 h (Figure 4B). The same result was previously observed with miR-210 inhibition by TGP-210 and miR-210 antisense oligonucleotide treatment (Costales et al., 2017).
Figure 4. Modulation of the hypoxic circuit through selective inhibition of miR-210 causes apoptosis in hypoxic MDA-MB-231 cells.

(A) RT-qPCR analysis of validated miRNAs indicated miR-210 as the most significantly downregulated miR upon TGP-210-RL (200 nM) treatment. (B) Modulation of GPD1L and HIF1a transcripts with TGP-210-RL (200 nM) treatment after 24 h and 48 h, as determined by RT-qPCR. (C) Apoptosis in hypoxic MDA-MB-231 cells treated with miR-210-targeted locked nucleic acid (LNA-210), scramble locked nucleic acid (Scr-LNA), TGP-210, or TGP-210-RL, as measured by Caspase 3/7 activity. Cells that overexpress pre-miR-210 via a plasmid are shown in the yellow box. *p < 0.05, **p < 0.01, as determined by a two-tailed Student t test. Data represent means ± SEM of biological triplicates. See Figure S3 and Table S2.
To further study the selectivity of TGP-210-RL, total RNA-Seq was run after 24 h of compound treatment in hypoxia, to avoid measuring indirect effects due to apoptosis. Overall, no major changes to the transcriptome were observed, indicating no significant off-target effects of the compound (Figure S4A). The fold changes of predicted miR-210-3p targets were then queried to study on-target effects upon degrading pre-miR-210 (Agarwal et al., 2015). Of the miR-210-3p targets, 73% were upregulated in response to compound treatment, relative to the vehicle control, indicating on-target effects of the compound suppressing miR-210-3p (Figure S4B). In comparison, the predicted targets of control miRNAs, miR-23-3p and miR-107, which are both highly expressed hypoxia-associated miRNAs (Kulshreshtha et al., 2007), followed a binomial distribution, with no bias in upregulated targets observed, showing 58% and 57% upregulated targets, respectively (Figure S3C & S3D). Previous RNA-Seq studies with small molecules targeting miRNA similarly demonstrated limited off-target effects on the transcriptome, while causing a dramatic downstream biological impact and phenotype (Costales et al., 2019).
Next, the effect of TGP-210-RL on phenotype was measured. To serve as a positive and negative controls, locked nucleic acid (LNA) oligonucleotides targeting miR-210 (LNA-210) and a scrambled control (Scr-LNA) were studied in addition to TGP-210 and TGP-210-RL. These studies showed that LNA-210 caused apoptotic stimulation while Scr-LNA was inactive, as measured by increased caspase activity (Figure 4C). The effect of apoptosis between TGP-210 and TGP-210-RL were similar, but TGP-210-RL displayed greater activity, rivalling that of LNA-210, at 500 nM (Figure 4C). Given that TGP-210-RL gets into cells at about 50% of the amount of TGP-210, the nuclease recruitment enhances the activity of the compound by at least 2-fold. One important delineation between a targeted RNA degrader and a binder, however, is that the pre-miR is not pervasive in the former case but is in the latter. As a control, these same experiments were completed in a miR-210 overexpressed background, to determine if the compound-induced apoptosis was mediated through miR-210. Indeed, upon miR-210 overexpression, the miR-210-targeting compounds (LNA-210, TGP-210, and TGP-210-RL) no longer displayed apoptotic stimulation, further supporting the hypothesis that apoptosis is due to inhibition of miR-210 (Figure 4C). Under normoxic conditions, miR-210 is not overexpressed in cells, therefore, the effect of compound on apoptosis in normoxia was measured. No significant increase in apoptosis was observed with compound treatment under normoxic conditions, as expected when cells express lower levels of miR-210 (Figure S3E). Thus, the small molecule targeted degrader is a lead targeted therapeutic for miR-210.
SIGNIFICANCE
Several challenges in the discovery of small molecules targeting RNA are addressed herein. First, the discovery of bioactive ligands is an immense challenge. The Inforna platform allows one to rapidly define lead molecules that target RNA and their activity can be enhanced by development of compounds that recruit cellular nucleases. Second, binding to an RNA does not necessarily affect function, as target RNA can be bound at non-functional sites that will not alter cellular activity. RNA cleavage by recruiting nucleases would affect function regardless of a non-functional binding site. Third, a previously perceived insurmountable challenge in this area is that targeting RNAs with small molecules cannot be selective. Profiling studies show that selective inhibitory activities can be achieved when RNA is targeted for cleavage. Other small molecules show selectivity to RNA by simple binding and by targeted destruction and support the assertion of broad selectivity for small molecules binding RNA (Li and Disney, 2018; Rzuczek et al., 2017; Velagapudi et al., 2016). Fourth, enhanced selectivity by targeted cleavage through nuclease recruitment suggests that RNA can be targeted broadly by these approaches to develop a suite of targeted therapeutics. By integrating Inforna to enable sequence-based compound design and the ability to affect RNA cleavage, antisense-like design principles can be maintained, while conserving the functionalities of small molecules. Collectively, these studies support the assertion that drug design can be informed directly from human RNA sequence broadly. One challenge to expand this approach is to medicinally optimize the nuclease recruiting module. If parallels can be made to targeted protein degradation, medicinal optimization of the recruitment moiety is achievable (Burslem and Crews, 2017). Additionally, studies are on-going to extend this approach to recruit a panoply of nucleases to affect RNA cleavage (Arraiano et al., 2013; Ottis et al., 2017).
STAR METHODS
CONTACT FOR REAGENT AND RESOURCE SHARING
Further information and requests for resources and reagents should be directed to and will be fulfilled by the lead contact, Prof. Matthew Disney (disney@scripps.edu)
EXPERIMENTAL MODEL AND SUBJECT DETAILS
MDA-MB-231 (HTB-26; ATCC) cells were cultured in Roswell Park Memorial Institute (RPMI) 1640 media with L-glutamine & 25 mM HEPES (Corning) supplemented with 10% fetal bovine serum (FBS) (Sigma) and 1× Penicillin Streptomycin Solution (Corning). Cells cultured in normoxia were maintained at 37 °C in ambient atmosphere (~21% O2) with 5% CO2. Cells cultured in hypoxia were maintained at 37 °C, < 1% O2 in a nitrogen filled hypoxic chamber (Billups-Rothenberg, Inc.), and 5% CO2. Cells were directly purchased from ATCC, but were not authenticated.
For compound treatment (TGP-210, TGP-210-RL, LNA-210, Scr-LNA), compound stocks in DMSO or water were diluted in growth medium and added to cells for 24 – 48 h. For transfection of cells with plasmids (miR-210 overexpression plasmid or RNase L overexpression plasmid) Lipofectamine 2000 (Invitrogen) was used according to the manufacturer’s protocol. For transfection of cells with siRNAs (control siRNA-A or RNase L siRNA) or 2’-5’ A4, Lipofectamine RNAiMAX Reagent (Invitrogen) was used according to the manufacturer’s protocol.
METHOD DETAILS
In Vitro Fluorescent RNA Cleavage
A miR-210 Hairpin Precursor RNA labeled with a 5’ 6-Fluorescein (6FAM) and 3’ Black Hole Quencher (IQ4) (5’–6FAMAGCCCCUGCCCACCGCACACUGCGCUGCCCCAGACCCACUGUGCGUGUGACAGCGGCU–3’ IQ4; 5’ FAM/3’ BHQ miR-210 Hairpin Precursor RNA) was purchased from Chemgenes with HPLC purification. Solutions of 5’ FAM/3’ BHQ miR-210 Hairpin Precursor RNA (100 nM) were folded at 60 °C for 5 min and slowly cooled to room temperature in 1× RNase L Buffer (25 mM Tris-HCl, pH 7.4, 100 mM KCl) without MgCl2, β-mercaptoethanol or ATP. After folding, the RNA was supplemented with 10 mM MgCl2, fresh 7 mM β-mercaptoethanol, and 50 μM of ATP. Next, 50 nM of RNase L, prepared as described previously (Costales et al., 2018), and 100 nM of compounds (TGP-210-2’-5’ An derivatives, where n = 2-4) were prepared in 1× RNase L Buffer and added to the RNA. The samples were then transferred to Corning non-binding surface half area 96-well black plates. The samples were incubated at room temperature for the defined time points (15, 30, 60, 120, and 720 min) after which the fluorescence intensity (Ex: 485 nm, Em: 525 nm) was measured using a SpectraMax M5 plate reader. The percentage change in fluorescence intensity, where enhancement of fluorescence intensity was indicative of RNA cleavage, was determined by calculating the percentage change in sample fluorescent signals relative to the untreated fluorescent signal.
In vitro RNA cleavage mapping
Alternatively a 5’ 32P end labeled miR-210 hairpin precursor was in vitro transcribed as described previously (Costales et al., 2017). Aliquots of TGP-210-RL were diluted in RNase L Buffer, and then ~5000 counts of folded 5’ 32P end labeled pre-miR-210 RNA were added. Samples were incubated for 30 min at room temperature followed by addition of RNase L at an equimolar concentration of TGP-210-RL. The samples were incubated for 60 min at room temperature and then quenched by addition of an equal volume of 2× Loading Buffer (8M urea, 20 mM EDTA, 2 mM Tris-base, 0.01% bromophenol blue and 0.01% xylene cyanol). A base hydrolysis ladder was generated by incubating RNA at 95 °C in 1× Hydrolysis Buffer (50 mM NaHCO3, 1 mM EDTA, pH 9.4) for 5 or 10 min. To identify all G residues, pre-miR-210 was incubated with dilutions of T1 ribonuclease (ThermoFisher Scientific) in 1× Denaturing T1 Buffer (25 mM sodium citrate, pH 5, 7 M urea, 1 mM EDTA) for 20 min at room temperature. RNA fragments were resolved on a denaturing 15% polyacrylamide gel and imaged by phosphorimaging and QuantityOne software (BioRad).
In Vitro RNase L Oligomerization
An aliquot of RNase L (3 μM) in 1× RNase L Buffer was supplemented with 10 mM MgCl2, fresh 7 mM β-mercaptoethanol, and 50 μM of ATP. Dilutions of 2’-5’ A4, TGP-210, or TGP-210-RL were prepared in 1× RNase L Buffer supplemented with 10 mM MgCl2, fresh 7 mM β-mercaptoethanol, and 50 μM of ATP and added to the solution of RNase L in a total volume of 17.4 μL. The RNase L/compound solutions were incubated at room temperature for 5 min and then 1 μL of 44 mM dimethyl suberimidate (Thomas Scientific) in 0.4 M triethanolamine hydrochloride, pH 8.5, was added. After incubating at room temperature for 2 h, 3.6 μL of 6× Laemmli buffer (375 mM Tris-HCl, pH 6.8, 0.03% bromophenol blue, 0.6% β-mercaptoethanol, 12% SDS, 60% glycerol) was added. After heat denaturing the samples at 95 °C for 5 min, the samples were diluted 1:90 in 1× Laemmli buffer and then resolved by SDS-PAGE. After transferring to a PVDF membrane, the membrane was blocked in 1× TBST [1× TBS with 0.1% Tween-20 (v/v)] containing 5% nonfat milk for 1 h. The membrane was incubated with RNase L antibody (1:5000 dilution; Cell Signaling Technology: D4B4J) overnight at 4 °C in 1× TBST containing 5% nonfat dry milk. The membrane was washed three times for 5 min each with 1× TBST and then incubated with 1:10000 anti-rabbit IgG horseradish peroxidase secondary antibody conjugate (Cell Signaling Technology: 7074S) in 1× TBST containing 5% nonfat dry milk for 2 h at room temperature. After washing the membrane five times for 5 min each with 1× TBST, protein levels were quantified by chemiluminescence with SuperSignal West Pico Chemiluminescent Substrate (Pierce Biotechnology) per the manufacturer’s protocol. RNase L bands associated with monomeric or oligomeric signals were quantified using ImageJ software (National Institutes of Health).
Microscale Thermophoresis (MST) Binding Measurements
MST fluorescent measurements were performed on a Monolith NT.115 system (NanoTemper Technologies) using the fluorescence of a 5’ Cy5 labeled miR-210 Hairpin RNA (5’ – Cy5 CGCACACUGCGCUGCCCCAGACCCACUGUGCG), a 5’ Cy5 miR-210 Mutant RNA (5’ – Cy5 CGCACAGUGCGCUGCCCCAGACCCACUGUGCG), or a 5’ Cy5 DNA Hairpin (5’ – Cy5 CGCGAATTCGCGTTTTCGCGAATTCGCG) which were purchased from IDT with RNase-free HPLC purification and used without further purification. The RNA (5 nM) was prepared in 1× MST Buffer (8 mM Na2HPO4, 190 mM NaCl, 1mM EDTA, and 0.05% (v/v) Tween-20) and folded by heating at 60 °C for 5 min, and slowly cooling to room temperature. Compounds (TGP-210 or TGP-210-RL) were diluted in 1× MST Buffer and then were added to a final concentration of 20 μM, followed by 1:2 dilutions in 1× MST Buffer containing 5 nM RNA. Alternatively, RNase L in 1× MST Buffer was added to a final concentration of 50 nM in addition to compound and RNA. Samples were incubated for 30 min at room temperature and then loaded into premium-coated capillaries (NanoTemper Technologies). Fluorescence measurements (Ex: 605-645 nm, Em: 680-685 nm) were performed at 20% LED and 80% MST power, with a Laser-On time of 30 s and Laser-Off time of 5 s. The data were analyzed by thermophoresis analysis, and fitted by the quadratic binding equation in MST analysis software (NanoTemper Technologies). Dissociation constants were then determined by curve fitting using a single-site model.
Cellular Uptake by Flow Cytometry
The MDA-MB-231 cells were grown in 6-well plates to ~60% confluency and then incubated with dilutions of TGP-210 or TGP-210-RL for 48 h. Cells were removed from the plate using Accutase (Innovative Cell Technologies, Inc.) and washed twice with ice-cold 1× DPBS. Upon re-suspending ~1×10⁶ cells in 1× DPBS, compound uptake was measured by reading compound fluorescence upon excitation with a DAPI-UV laser. Gated viable cells were then analyzed for the compound uptake by taking the mean count values of samples in a DAPI-UV histogram and normalizing untreated and TGP-210 samples as 0% and 100%, respectively. At least 10,000 events were used for analysis.
Cellular Uptake by Confocal Microscopy
The MDA-MB-231 cells were grown to ~80% confluence in a Mat-Tek 96-well glass bottom plates in growth medium. Cells were treated with 5000 nM of TGP-210 or TGP-210-RL in complete growth medium for 24 h under hypoxic conditions. The growth media was removed and cells were then washed with 1× DPBS and fixed with 4% paraformaldehyde in 1× DPBS at 37 Ό and 5% CO2 for 10 minutes. The cells were then washed twice with 1× Hank’s Balanced Salt Solution (HBSS) and a 1:10000 dilution of SYTO 82 nuclear stain in 1× HBSS was added. After 10 min of incubation at room temperature, cells were washed three times in 1× HBSS and resuspended in 100 μL of 1× HBSS and intrinsic TGP-210 or TGP-210-RL fluorescence (DAPI channel) or SYTO 82 fluorescence (TRITC channel) were imaged using an Olympus FluoView 1000 confocal microscope at 40× magnification.
RNA Isolation and RT-qPCR
The MDA-MB-231 cells were treated in normoxic or hypoxic conditions for 24 – 48 h, as described above in the Experimental Model and Subject Details section. Total RNA was extracted from cells by using a Quick-RNA MiniPrep (Zymo Research) according to the manufacturer’s protocol. Subsequent reverse transcription reactions were completed on approximately 200-600 ng of total RNA using a miScript II RT Kit (Qiagen) according to the manufacturer’s protocol. The RT-qPCR samples were prepared using Power SYBR Green PCR Master Mix (Applied Biosystems) and completed on a 7900HT Fast Real Time PCR System (Applied Biosystems) according to the manufacturer’s protocol. RT-qPCR primers (Table S2) were purchased from Eurofins or IDT and used without further purification. RNA expression levels were determined using the ΔΔCt method and normalized using 18S ribosomal RNA or U6 small nuclear RNA as housekeeping genes. For qPCR miRNA profiling, a custom panel of miRNAs based on Qiagen’s MHS-001Z Gene Table miRNA profiling plate was used. Downstream analysis was performed using the miScript miRNA PCR Array template Version 1.1 using an adjusted version of the MHS-001Z Gene Table. Data was normalized using SNORD44 and RNU6 as housekeeping genes. Further data analysis, processing, and statistics were performed in the GraphPad Prism software. Upon treatment with chimeric compound TGP-210-RL, relative cleavage levels were calculated according to equation 1 (Eq. 1) in order to control for the effect of parent compound TGP-210, on pre-miR-210 expression:
| (Eq. 1) |
RNA Immunoprecipitation
The MDA-MB-231 cells were grown in 6-well plates to ~70% confluency and treated with 200 nM of 2’-5’ A4 or 200 nM TGP-210-RL diluted in cell media for 48 h under hypoxic conditions. The cell monolayer was washed with 1× DPBS, removed from the plate with Accutase (Innovative Cell Technologies, Inc.), and washed with ice-cold 1× DPBS. Cells were lysed in 100 μL of M-PER buffer supplemented with 80 U RNaseOUT Recombinant Ribonuclease Inhibitor (Invitrogen) and 1× Protease Inhibitor Cocktail III for Mammalian Cells (Research Products International Corp.) according to the manufacturer’s instructions. The samples were centrifuged at 13000 × g for 15 min and supernatant was removed. Supernatants were incubated overnight at 4 °C with Dynabeads Protein A (Life Technologies) that were bound to either β-actin mouse primary antibody (Cell Signaling Technologies; 3700S) or RNase L mouse primary antibody (Santa Cruz Biotechnology; sc-74405). After antibody incubation, the beads were washed three times with 1× DPBS supplemented with 0.02% Tween-20 and then total RNA was extracted from beads using a miRNeasy Mini Kit (Qiagen) according to manufacturer’s instructions. Glycogen (20 μg) was added before addition of ethanol to aid in RNA precipitation. RT-qPCR was completed as described above. Relative RNA expression levels were determined by the ΔΔCt method and normalized to 18S rRNA as a housekeeping gene. Normalized fold change was calculated by dividing relative expression levels of the gene of interest in the cDNA library prepared from RNA extracted from the RNase L immunoprecipitated fraction by the relative expression levels of the gene of interest in the cDNA library prepared from RNA extracted from the β-actin immunoprecipitated fraction, or equation 2 (Eq. 2):
| (Eq. 2) |
Caspase 3/7 Activity Measurements
Approximately 5,000 MDA-MB-231 cells were plated into white, cell-culture treated, 96-well plates (Corning). At ~60% confluency, cells were treated with dilutions of LNA-210, Scr-LNA, TGP-210, or TGP-210-RL and then placed under hypoxic or normoxic conditions. After 48 h, caspase 3/7 activity was measured using a Caspase-Glo 3/7 kit (Promega) according to the manufacturer’s protocol. Alternatively, MDA-MB-231 cells were transfected with a plasmid overexpressing pre-miR-210 (Genecopoeia; HmiR0167-MR04) using Lipofectamine 2000 (Invitrogen). After 5 h of transfection, cells were plated into white, cell-culture treated 96-well plates (Corning) and then treated as described above. Fold change in Caspase activity was calculated by normalizing treated samples to the untreated samples after subtracting background sample values.
Measurement of Catalytic Activity
The MDA-MB-231 cells were plated into a 24-well plates (Corning). At ~80% confluency, the media was aspirated and the cell monolayer was washed with 1× DPBS. TGP-210-RL (500 nM) or vehicle (DMSO) was diluted in cell culture medium and added to the cells, which were incubated for 24 h under hypoxic conditions. Cells were removed from hypoxia and then lysed using 250 μL of RNA Lysis Buffer from a Quick-RNA MiniPrep Kit (Zymo Research). A 50 μL aliquot was transferred to black, non-binding surface, half area 96-well plates (Corning). Fractions of untreated cell lysate were combined and used to generate a standard curve of TGP-210-RL in cell lysate, by spiking in known concentrations of TGP-210-RL (1.5625, 3.125, 6.25, 12.5, 25, 50, 100, 200 nM). Fluorescence intensity (Ex: 345 nm, Em: 460 nm) was then measured on a Molecular Devices SpectraMax M5 plate reader. Using the generated standard curve, the concentration of TGP-210-RL in the 50 μL cell lysate aliquot was extrapolated and the amount of TGP-210-RL in pmol in the full 250 μL volume was then calculated.
RNA was extracted from the cell lysates using a Quick-RNA MiniPrep Kit (Zymo Research), followed by RT-qPCR proceeded as described above. A standard curve was generated for the pre-miR-210 transcript using in vitro transcribed pre-miR-210 (10 ng, 1 ng, 0.1 ng, 0.01 ng, 0.001 ng, 0.0001 ng, 0 ng) completed with each run to accurately calibrate Ct values. The pre-miR-210 transcript was in vitro transcribed as described previously (Costales et al., 2018), using the DNA template for miR-210 precursor hairpin RNA (5’ – GCAGCCCCTGCCCACCGCACACTGCGCTGCCCCAGACCCACTGTGCGTGTGACAGCGGCTGATCTG) and the appropriate Forward (5’ – GGCCGGATCCTAATACGACTCACTATAGCAGCCCCTGCCCAC) and Reverse (5’ – CAGATCAGCCGCTGTCAC) primers. The amount of cleaved pre-miR-210 was then calculated by taking the difference between the pmol of pre-miR-210 in untreated samples and the pmol of pre-miR-210 in TGP-210-RL-treated samples. Catalytic activity, or turnover, was calculated by taking the ratio of the pmol of cleaved pre-miR-210 and the pmol of TGP-210-RL in the sample.
RNA-Seq
Hypoxic MDA-MB-231 cells were treated as described above for 24 h with TGP-210-RL and total RNA was extracted using a miRNeasy Mini Kit (Qiagen) using an on-column DNase I treatment. A Qubit 2.0 Fluorometer (Invitrogen) and an Agilent Technologies 2100 Bioanalyzer with an RNA nano chip were used to quantify and assess the quality of RNA, respectively. Only samples with RNA Integrity Number > 8.0 were used. NEBNext rRNA depletion modules (Catalog #: E6310L, New England Biosciences) were used to deplete rRNA on 500 ng of total RNA, according to manufacturer’s instructions. A NEBNext Ultra II Directional RNA kit (Catalog #: E7760, New England Biosciences) was used for library preparation according to the manufacturer’s instructions. RNA samples were then chemically fragmented, primed with random hexamers, and reverse transcribed to convert fragmented RNA to first strand cDNA. The RNA template was removed and dUTP was incorporated in place of dTTP, after which the second strand of cDNA was synthesized by end repair and 3’ end adenylation. A hairpin loop adaptor was used to ligate an adaptor A corresponding T nucleotide on the hairpin loop adaptor was used to ligate an adaptor to the double-stranded cDNA. Uracil-specific excision reagent (USER) enzyme was then used to remove the dUTP in the loop, as well as other incorporated U’s in the second strand. Final libraries were generated by PCR amplifying adaptor ligated DNA with Illumina barcoding primers, where fragments with both 5’ and 3’ adaptors would be enriched in the final PCR step. Libraries were normalized to 2 nM, validated by a Bioanalyzer DNA chip, pooled equally, and then sequenced on a NextSeq500 v2.5 flow cell (1.8 pM) using paired-end chemistry (2 × 40 bp). Approximately 20-25 million reads were generated per sample with a base quality score >Q30 (less than 1 error per 1000 bp).
Kallisto was used to quantify transcript abundance, followed by gene-level RNA-Seq differential expression analysis using the Sleuth package in R. TargetScanHuman v7.2 was used to search for predicted microRNA targets for miR-210-3p (only with conserved sites) and for miR-23-3p and miR-107 (top 100 predicted target genes, irrespective of site conservation ranked by cumulative weighted context++ score). The relative % fold change was calculated for each target genes of each microRNA from the RNA-Seq data, using equation 3 (Eq. 3):
| (Eq. 3) |
Significant discrepancy from a binomial distribution of upregulated and downregulated relative % fold change in the target genes were then analyzed using the binomial test function with 95% and 99% confidence in GraphPad Prism 7.
Chemical Synthesis
Abbreviations
TGP-210, Targapremir-210; 2’-5’ A, 2’-5’ linked oligoadenylates (Chemgenes); HATU, (1-[Bis(dimethylamino)methylene]-1H-1,2,3-triazolo[4,5-b]pyridinium 3-oxid hexafluorophosphate (Oakwood Chemical); HOAt, 1-Hydroxy-7-azabenzotriazole (Advanced Chem Tech); DIPEA, N,N-Diisopropylethylamine (Sigma-Aldrich); DMSO, dimethyl sulfoxide (EMD); MALDI-TOF, matrix-assisted laser desorption/ionization-time of flight mass spectrometry; HPLC, high performance liquid chromatography; TEAA, triethyl ammonium acetate.
Synthesis of Targapremir-210 linked to 2’-5’ oligoadenylates (TGP-210-2’-5’ An; n = 2-4)

In a 1.6 mL tube, a carboxylic acid derivative of TGP-210 (TGP-210-COOH) (10 μL, 20 mM, 200 nmoles), prepared as previously described (Costales et al., 2017), and coupling reagents HATU (2 μL, 100 mM, 200 nmoles) and HOAt (2 μL, 100 mM, 200 nmoles) were added together. The solution was incubated at room temperature for 10 min and then 50 nmol of oligoadenylate amine, (2’-5’ An-NH2 where n=2-4) (Chemgenes) and DIPEA (5 μL) were added to the tube. The reaction volume was adjusted with DMSO to 50 μΕ The reaction was then incubated at 37 °C with shaking. Reaction progress was monitored by MALDI-TOF using an Applied Biosystems MALDI-TOF/TOF Analyzer 4800 Plus using an a-cyano-4-hydroxycinnamic acid matrix in negative ion mode. The reaction solution was supplemented with additional coupling reagents (200 nmol each) after 8 hours as necessary. Upon reaction completion, DMSO was removed under reduced pressure and the mixture was purified by reverse phase HPLC. HPLC purification was performed using a Waters 1525 Binary HPLC pump equipped with a Waters 2487 dual absorbance detector system and a Waters Symmetry C18 5 μm, 4.6 × 150 mm column using a flow rate of 1 mL/min. A 60 min linear gradient method from 0-100% buffer A to buffer B was used, where buffer B is freshly prepared 50 mM TEAA, pH 7, in water/acetonitrile, 50/50 (v/v) and buffer A is freshly prepared 50 mM TEAA, pH 7, in water. Absorbance was monitored at 254 and 345 nm. Purity was analyzed on an analytical HPLC using the same instrument settings and either a 30 or 60 min using the same linear gradient method. See Figure S4.
TGP-210-2’-5’ A2: Isolated 3.4 nmol (yield = 7%); C55H68N17O20P3 calculated mass: 1378.3961 (M-H)−; found: 1378.5798.
TGP-210-2’-5’ A3: Isolated 18 nmol (yield = 36%); C65H80N22O26P4 calculated mass: 1707.4486 (M-H)−; found: 1707.6279.
TGP-210-2’-5’ A4: Isolated 8.1 nmol (yield = 16%); C75H92N27O32P5 calculated mass: 2036.5012, (M-H)−; found: 2036.8623.
QUANTIFICATION AND STATISTICAL ANALYSIS
All plots show means with error bars representing S.E.M., unless dictated otherwise. Experiments were completed at least in triplicate. Data were plotted and statistics were calculated using GraphPad Prism 7 software.
DATA AND SOFTWARE AVAILABILITY
The accession number for the original raw sequencing data for the RNA-Seq experiment is: GSE129307.
Supplementary Material
Table S2. Primers used for RT-qPCR. Universal reverse primer from Qiagen was used for each miRNA unless a specific reverse primer is indicated. Related to STAR Methods and Figure 4. Ct values displayed for miRNAs from qPCR profiling as AVG±SD (n=3). N.A.=not applicable.
KEY RESOURCE TABLE
| REAGENT or RESOURCE | SOURCE | IDENTIFIER |
|---|---|---|
| Antibodies | ||
| RNase L Rabbit monoclonal antibody | Cell Signaling Technology | CAT# D4B4J |
| Anti-rabbit IgG HRP-linked antibody | Cell Signaling Technology | CAT# 7074S |
| β-actin Mouse monoclonal antibody | Cell Signaling Technology | CAT# 3700S |
| RNase L Mouse monoclonal antibody | Santa Cruz Biotechnology | CAT# sc-74405 |
| Chemicals, Peptides, and Recombinant Proteins | ||
| 2’-5’ A4 oligoadenylate | Chemgenes | N/A |
| 2’-5’ A2/A3/A4 linked to amine (2’-5’ An-NH2) | Chemgenes | N/A |
| TGP-210 | (Costales et al., 2017) | N/A |
| TGP-210–2’-5’ A2/A3/A4 (TGP-210-RL) | This paper | N/A |
| SYTO 82 Orange Fluorescent Nucleic Acid Stain | Invitrogen | CAT# S11363 |
| Critical Commercial Assays | ||
| Quick-RNA Miniprep Kit | Zymo | CAT# R1055 |
| miRNeasy Mini Kit | Qiagen | CAT# 217004 |
| Caspase-Glo 3/7 Assay | Promega | CAT# G8091 |
| Oligonucleotides | ||
| Control siRNA-A | Santa Cruz Biotechnology | CAT# sc-37007 |
| RNase L siRNA (h) | Santa Cruz Biotechnology | CAT # sc-45965 |
| Primers used for RT-qPCR, see Table S2 | Integrated DNA Technologies/Eurofins MWG Operon | N/A |
| hsa-miR-210-3p, miRCURY LNA Power microRNA inhibitor | Qiagen | CAT# YI04103145-DDA |
| Negative control A, miRCURY LNA Power microRNA inhibitor control | Qiagen | CAT# YI00199006-DFA |
| 5’ FAM/3’ BHQ miR-210 Hairpin Precursor | Chemgenes | N/A |
| 5’ Cy5 miR-210 Hairpin RNA | Integrated DNA Technologies | N/A |
| 5’ Cy5 miR-210 Mutant RNA | Integrated DNA Technologies | N/A |
| 5’ Cy5 DNA Hairpin | Integrated DNA Technologies | N/A |
| Recombinant DNA | ||
| pEZX-MR04 – miR-210 overexpression plasmid | Genecopoeia | CAT# HmiR0167-MR04 |
| pcDNA3-RNaseL – RNase L overexpression plasmid | (Dong et al., 2001) | N/A |
| pGEX-4T-RNaseL-GST – RNase L protein expression plasmid | (Dong and Silverman, 1997) | N/A |
| Deposited Data | ||
| RNA-Seq data | This paper | GEO Accession: |
| Software and Algorithms | ||
| NT Analysis 1.5.41 | Nanotemper Technologies | N/A |
| TargetScanHuman v7.2 | (Agarwal et al., 2015) | N/A |
| QuantityOne | BioRad | N/A |
| ImageJ | NIH | N/A |
| Olympus Fluoview software version 3.0 | Olympus | N/A |
| GraphPad Prism 7 | GraphPad Prism Software, Inc. | N/A |
Highlights.
A small molecule locally recruits ribonuclease to degrade a hypoxia-associated RNA
Appendage of a ribonuclease recruitment module increases selectivity and potency
Degradation of target RNA induces apoptosis in hypoxic breast cancer cells
Targeted small molecules degradation of RNA sequence is broadly applicable
ACKNOWLEDGEMENTS
We thank the National Institutes of Health for funding (R01 GM97455, and DP1 NS096898 to M.D.D and the Scheller Graduate Student Fellowship and ACS Medicinal Chemistry Division Predoctoral Fellowship to M.G.C.). We thank the Fuirst Family foundation and The Frenchman’s Creek Women for Cancer Research for philanthropic support and inspiration. We thank the Genomics Core at Scripps Research for library preparation and sequencing. We thank Jessica Childs-Disney for critical review of the manuscript.
Footnotes
Publisher's Disclaimer: This is a PDF file of an unedited manuscript that has been accepted for publication. As a service to our customers we are providing this early version of the manuscript. The manuscript will undergo copyediting, typesetting, and review of the resulting proof before it is published in its final citable form. Please note that during the production process errors may be discovered which could affect the content, and all legal disclaimers that apply to the journal pertain.
DECLARATION OF INTERESTS
M.D.D. is the founder of Expansion Therapeutics
REFERENCES
- Agarwal V, Bell GW, Nam J-W, and Bartel DP (2015). Predicting effective microRNA target sites in mammalian mRNAs. eLife 4, e05005. [DOI] [PMC free article] [PubMed] [Google Scholar]
- Al-Ahmadi W, Al-Haj L, Al-Mohanna FA, Silverman RH, and Khabar KSA (2009). RNase L downmodulation of the RNA-binding protein, HuR, and cellular growth. Oncogene 28, 1782–1791. [DOI] [PMC free article] [PubMed] [Google Scholar]
- Angelbello AJ, Chen JL, Childs-Disney JL, Zhang P, Wang Z-F, and Disney MD (2018). Using Genome Sequence to Enable the Design of Medicines and Chemical Probes. Chem. Rev 118, 1599–1663. [DOI] [PMC free article] [PubMed] [Google Scholar]
- Arraiano CM, Mauxion F, Viegas SC, Matos RG, and Séraphin B (2013). Intracellular ribonucleases involved in transcript processing and decay: Precision tools for RNA. Biochim. Biophys. Acta Gene Regul. Mech 1829, 491–513. [DOI] [PubMed] [Google Scholar]
- Bartel DP (2004). MicroRNAs: genomics, biogenesis, mechanism, and function. Cell 116, 281–297. [DOI] [PubMed] [Google Scholar]
- Bavelloni A, Ramazzotti G, Poli A, Piazzi M, Focaccia E, Blalock W, and Faenza I (2017). MiRNA-210: A Current Overview. Anticancer Res. 37, 6511–6521. [DOI] [PubMed] [Google Scholar]
- Bondeson DP, Smith BE, Burslem GM, Buhimschi AD, Hines J, Jaime-Figueroa S, Wang J, Hamman BD, Ishchenko A, and Crews CM (2018). Lessons in PROTAC Design from Selective Degradation with a Promiscuous Warhead. Cell Chem. Biol 25, 78–87.e75. [DOI] [PMC free article] [PubMed] [Google Scholar]
- Bracken CP, Scott HS, and Goodall GJ (2016). A network-biology perspective of microRNA function and dysfunction in cancer. Nat. Rev. Genet 17, 719. [DOI] [PubMed] [Google Scholar]
- Burslem GM, and Crews CM (2017). Small-Molecule Modulation of Protein Homeostasis. Chem. Rev 117, 11269–11301. [DOI] [PubMed] [Google Scholar]
- Chakrabarti A, Jha BK, and Silverman RH (2011). New insights into the role of RNase L in innate immunity. J. Interf. Cytok. Res 31, 49–57. [DOI] [PMC free article] [PubMed] [Google Scholar]
- Connelly Colleen M., Moon Michelle H., and Schneekloth John S. (2016). The Emerging Role of RNA as a Therapeutic Target for Small Molecules. Cell Chem. Biol 23, 1077–1090. [DOI] [PMC free article] [PubMed] [Google Scholar]
- Costales MG, Haga CL, Velagapudi SP, Childs-Disney JL, Phinney DG, and Disney MD (2017). Small Molecule Inhibition of microRNA-210 Reprograms an Oncogenic Hypoxic Circuit. J. Am. Chem. Soc 139, 3446–3455. [DOI] [PMC free article] [PubMed] [Google Scholar]
- Costales MG, Hoch DG, Abegg D, Childs-Disney JL, Velagapudi SP, Adibekian A, and Disney MD (2019). A Designed Small Molecule Inhibitor of a Non-Coding RNA Sensitizes HER2 Negative Cancers to Herceptin. J. Am. Chem. Soc 141, 2960–2974. [DOI] [PMC free article] [PubMed] [Google Scholar]
- Costales MG, Matsumoto Y, Velagapudi SP, and Disney MD (2018). Small Molecule Targeted Recruitment of a Nuclease to RNA. J. Am. Chem. Soc 140, 6741–6744. [DOI] [PMC free article] [PubMed] [Google Scholar]
- Disney MD, Dwyer BG, and Childs-Disney JL (2018). Drugging the RNA World. Cold Spring Harbor Perspect. Biol 10. [DOI] [PMC free article] [PubMed] [Google Scholar]
- Disney MD, Labuda LP, Paul DJ, Poplawski SG, Pushechnikov A, Tran T, Velagapudi SP, Wu M, and Childs-Disney JL (2008). Two-dimensional combinatorial screening identifies specific aminoglycoside-RNA internal loop partners. J. Am. Chem. Soc 130, 11185–11194. [DOI] [PubMed] [Google Scholar]
- Dong B, Niwa M, Walter P, and Silverman RH (2001). Basis for regulated RNA cleavage by functional analysis of RNase L and Ire1p. RNA. 7, 361–373. [DOI] [PMC free article] [PubMed] [Google Scholar]
- Dong B, and Silverman RH (1997). A bipartite model of 2–5A-dependent RNase L. J. Biol. Chem 272, 22236–22242. [DOI] [PubMed] [Google Scholar]
- Donlic A, and Hargrove AE (2018). Targeting RNA in mammalian systems with small molecules. Wiley Interdiscip. Rev. RNA 9, e1477. [DOI] [PMC free article] [PubMed] [Google Scholar]
- Fisher SL, and Phillips AJ (2018). Targeted protein degradation and the enzymology of degraders. Curr. Opin. Chem. Biol 44, 47–55. [DOI] [PubMed] [Google Scholar]
- Frazier KS (2015). Antisense oligonucleotide therapies: the promise and the challenges from a toxicologic pathologist’s perspective. Toxicol. Pathol 43, 78–89. [DOI] [PubMed] [Google Scholar]
- Gadd MS, Testa A, Lucas X, Chan K-H, Chen W, Lamont DJ, Zengerle M, and Ciulli A (2017). Structural basis of PROTAC cooperative recognition for selective protein degradation. Nat. Chem. Biol 13, 514–521. [DOI] [PMC free article] [PubMed] [Google Scholar]
- Huang X, Ding L, Bennewith KL, Tong RT, Welford SM, Ang KK, Story M, Le QT, and Giaccia AJ (2009). Hypoxia-inducible mir-210 regulates normoxic gene expression involved in tumor initiation. Mol. Cell 35, 856–867. [DOI] [PMC free article] [PubMed] [Google Scholar]
- Hughes SJ, and Ciulli A (2017). Molecular recognition of ternary complexes: a new dimension in the structure-guided design of chemical degraders. Essays Biochem. 61, 505–516. [DOI] [PMC free article] [PubMed] [Google Scholar]
- Jung EJ, Santarpia L, Kim J, Esteva FJ, Moretti E, Buzdar AU, Di Leo A, Le XF, Bast RC Jr., Park ST, et al. (2012). Plasma microRNA 210 levels correlate with sensitivity to trastuzumab and tumor presence in breast cancer patients. Cancer 118, 2603–2614. [DOI] [PMC free article] [PubMed] [Google Scholar]
- Kelly TJ, Souza AL, Clish CB, and Puigserver P (2011). A hypoxia-induced positive feedback loop promotes hypoxia-inducible factor 1alpha stability through miR-210 suppression of glycerol-3-phosphate dehydrogenase 1-like. Mol. Cell. Biol 31, 2696–2706. [DOI] [PMC free article] [PubMed] [Google Scholar]
- Khabar KS, Siddiqui YM, al-Zoghaibi F, al-Haj L, Dhalla M, Zhou A, Dong B, Whitmore M, Paranjape J, Al-Ahdal MN, et al. (2003). RNase L mediates transient control of the interferon response through modulation of the double-stranded RNA-dependent protein kinase PKR. J. Biol. Chem 278, 20124–20132. [DOI] [PubMed] [Google Scholar]
- Kulshreshtha R, Ferracin M, Wojcik SE, Garzon R, Alder H, Agosto-Perez FJ, Davuluri R, Liu C-G, Croce CM, Negrini M, et al. (2007). A MicroRNA Signature of Hypoxia. Mol. Cell. Biol 27, 1859–1867. [DOI] [PMC free article] [PubMed] [Google Scholar]
- Li Y, and Disney MD (2018). Precise Small Molecule Degradation of a Noncoding RNA Identifies Cellular Binding Sites and Modulates an Oncogenic Phenotype. ACS Chem. Biol 13, 3065–3071. [DOI] [PMC free article] [PubMed] [Google Scholar]
- Luo Y, and Disney MD (2014). Bottom-up Design of Small Molecules that Stimulate Exon 10 Skipping in Mutant MAPT Pre-mRNA. ChemBioChem 15, 2041–2044. [DOI] [PMC free article] [PubMed] [Google Scholar]
- Mathew LK, and Simon MC (2009). mir-210: a sensor for hypoxic stress during tumorigenesis. Mol. Cell 35, 737–738. [DOI] [PMC free article] [PubMed] [Google Scholar]
- Moon MH, Hilimire TA, Sanders AM, and Schneekloth JS Jr. (2018). Measuring RNA-Ligand Interactions with Microscale Thermophoresis. Biochemistry 57, 4638–4643. [DOI] [PMC free article] [PubMed] [Google Scholar]
- Mykowska A, Wojtkowiak-Szlachcic A, Stepniak-Konieczna E, Sroka J, Taylor K, Sznajder LJ, Sobczak K, and Thornton CA (2015). Short antisense-locked nucleic acids (all-LNAs) correct alternative splicing abnormalities in myotonic dystrophy. Nucleic Acids Res. 43, 3318–3331. [DOI] [PMC free article] [PubMed] [Google Scholar]
- Obad S, dos Santos CO, Petri A, Heidenblad M, Broom O, Ruse C, Fu C, Lindow M, Stenvang J, Straarup EM, et al. (2011). Silencing of microRNA families by seed-targeting tiny LNAs. Nat. Genet 43, 371–378. [DOI] [PMC free article] [PubMed] [Google Scholar]
- Ottis P, Toure M, Cromm PM, Ko E, Gustafson JL, and Crews CM (2017). Assessing Different E3 Ligases for Small Molecule Induced Protein Ubiquitination and Degradation. ACS Chem. Biol 12, 2570–2578. [DOI] [PubMed] [Google Scholar]
- Rizvi NF, and Smith GF (2017). RNA as a small molecule druggable target. Bioorg. Med. Chem. Lett 27, 5083–5088. [DOI] [PubMed] [Google Scholar]
- Rzuczek SG, Colgan LA, Nakai Y, Cameron MD, Furling D, Yasuda R, and Disney MD (2017). Precise small-molecule recognition of a toxic CUG RNA repeat expansion. Nat. Chem. Biol 13, 188–193. [DOI] [PMC free article] [PubMed] [Google Scholar]
- Stein CA, Hansen JB, Lai J, Wu S, Voskresenskiy A, Hog A, Worm J, Hedtjarn M, Souleimanian N, Miller P, et al. (2010). Efficient gene silencing by delivery of locked nucleic acid antisense oligonucleotides, unassisted by transfection reagents. Nucleic Acids Res. 38, e3. [DOI] [PMC free article] [PubMed] [Google Scholar]
- Velagapudi SP, Cameron MD, Haga CL, Rosenberg LH, Lafitte M, Duckett DR, Phinney DG, and Disney MD (2016). Design of a small molecule against an oncogenic noncoding RNA. Proc. Natl. Acad. Sci. U.S.A 113, 5898–5903. [DOI] [PMC free article] [PubMed] [Google Scholar]
- Velagapudi SP, Costales MG, Vummidi BR, Nakai Y, Angelbello AJ, Tran T, Haniff HS, Matsumoto Y, Wang ZF, Chatterjee AK, et al. (2018). Approved Anti-cancer Drugs Target Oncogenic Non-coding RNAs. Cell Chem. Biol 25, 1086–1094.e1087. [DOI] [PMC free article] [PubMed] [Google Scholar]
- Velagapudi SP, Gallo SM, and Disney MD (2014). Sequence-based design of bioactive small molecules that target precursor microRNAs. Nat. Chem. Biol 10, 291–297. [DOI] [PMC free article] [PubMed] [Google Scholar]
Associated Data
This section collects any data citations, data availability statements, or supplementary materials included in this article.
Supplementary Materials
Table S2. Primers used for RT-qPCR. Universal reverse primer from Qiagen was used for each miRNA unless a specific reverse primer is indicated. Related to STAR Methods and Figure 4. Ct values displayed for miRNAs from qPCR profiling as AVG±SD (n=3). N.A.=not applicable.
Data Availability Statement
The accession number for the original raw sequencing data for the RNA-Seq experiment is: GSE129307.