

Abstract
Nanoparticle-based drug delivery systems have attracted significant interest owing to their promise as tunable platforms that offer improved intracellular release of the cargo therapeutics. However, significant challenges remain in maintaining the physiological stability of the mucosal matrix due to the nanoparticle-induced reduction in the matrix diffusivity and promotion of mucin aggregation. Such aggregation also adversely impacts the permeability of the nanoparticles and thus, diminishes the efficacy of the nanoparticle-based formulations. Here, we propose an entirely complementary approach to the existing nanoparticle functionalization methods to address these challenges by using trehalose, a naturally occurring disaccharide that offers exceptional protein stabilization. Plasmon-enhanced Raman spectroscopy and far-red fluorescence emission of the plasmonic silver nanoparticulate clusters were harnessed to create a unique dual-functional, aggregating and imaging agent that obviates the need of an additional reporter to investigate mucus-nanoparticle interactions. These spectroscopy-based density mapping tools uncovered the mechanism of mucus-nanoparticle interactions and established the protective role of trehalose microenvironment in minimizing the nanoparticle aggregation. Thus, in contrast to the prevailing belief, these results demonstrated that non-functionalized nanoparticles may rapidly penetrate through mucus barriers, and by leveraging the bioprotectant attributes of trehalose, an in vivo milieu for efficient mucosal drug delivery can be generated.
Keywords: Porcine jejunal mucus, Raman spectroscopy, SERS, drug delivery, trehalose
Overcoming Barriers
Overcoming the mucosal barrier has been a challenge for several nanotherapeutic agents. Here, we have reported a mechanistic overview of trehalose-mediated method for enhanced mucopermeation of nanoparticles which can be harnessed for drug-delivery and label-free imaging applications.
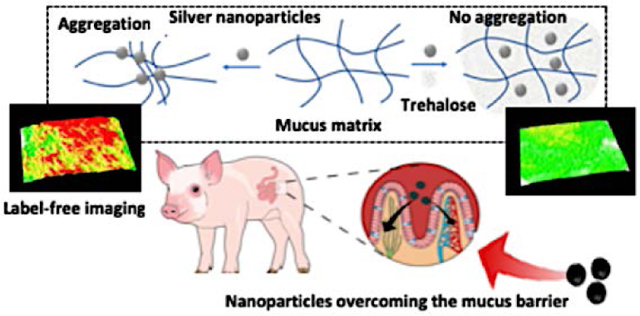
Graphical Abstract
1. Introduction
Targeted nanoparticles are an attractive concept for improved treatment of diseases refractory to the conventional therapeutics. Nanoparticle-based drug delivery systems offer the possibility of direct and controlled delivery to the epithelial tissues; thereby, reducing systemic toxicity and potential deterioration of the cargo therapeutics in serum.[1] Furthermore, integration of imaging agents into such nanoparticulate systems has given rise to promising theranostic platforms that enable visualization of drug delivery to, and action at the targeted sites.[2] Yet, translating this promise for improved diagnosis and/or therapy in vivo has proven to be challenging. For instance, a recent meta-analysis has revealed that only 0.7% (median) of the administered nanomedicinal dose is correctly delivered to the targeted sites.[3] A principal cause of the poor delivery efficiency is the inability of the nanoparticles to overcome the mucosal barrier in order to reach the underlying epithelial cells and avoid clearance. [4, 5]
Mucus provides with a nanoscopically heterogeneous highly adhesive gel, and plays a key role in the protective [6] and immunological functions.[7] Secreted by the specialized Goblet cells, mucus is deposited on the epithelial surfaces while being continuously produced and recycled within the body. Its prevalence in multiple parts of the body including, but not limited to, the eye,[8] gastrointestinal,[9] respiratory[10] and reproductive[11] tracts is based on its function as a highly efficient and selective physiological barrier capable of trapping the foreign particles and pathogens. The viscoelasticity of the mucosal layer is highly tunable (“spinnbarkeit”, e.g. thinning of cervical mucus before ovulation to facilitate motility of sperms)[12] and is modulated by the pathophysiological states.[13] The inherent defensive mechanism of mucus to trap foreign particles through polyvalent adhesive interactions also prevents ready mucopermeation of the nanocarriers with encapsulated drug molecules.
Central towards fulfilling the desired protective tasks are the stability and rheology of the entangled viscoelastic gel that forms the mucosal barrier. The hydrogel is principally constituted by dense mesh of mucin polymers along with sparse amounts of genetic materials, globular proteins, cellular debris, and glycolipids.[4] Mucins are highly glycosylated, negatively charged proteins (due to sialic acid, sulphate and carboxyl groups in the cross-linked oligosaccharides) with periodic hydrophobic regions. Other organic constituents of the mucus proteome also play a part in its biophysical properties.14 These non-mucin constituents form a part of the “mucin-interactome”,[14] which interacts with the mucin polymer through electrostatic, covalent or hydrophobic interactions; and, plays an important role in the mechano-active functions of the mucus. Given the intricate structure-function relationship, even minute alterations to the consistency of mucus often result in physiological dysfunctions.[15–17]
Due to its remarkable stabilization properties under varied chemical and thermal stresses, we reasoned that the α-linked disaccharide, trehalose, may facilitate maintenance of the rheological attributes of the mucosal layer. Trehalose has long been used as a bioprotectant for pharmaceutically relevant molecules including globular proteins during desiccation or lyophilization.[18] In addition to being a non-reducing sugar, trehalose is known to stabilize proteins through a combination of vitrification, water replacement and water entrapment mechanisms; while, exerts substantive protective action against oxidative stress.[19, 20] Given the considerable protein content of mucin, we hypothesized that trehalose-induced prevention of adverse nanoparticle interactions combined with conservation of the coordinated water molecules will enhance mucus dispersion and, thus, retain the intrinsic matrix hydration.
In particular, we proposed to use trehalose in facilitating the transport of non-functionalized nanoparticles through the mucosal layer by lessening nanoparticle agglomeration as well as by precluding aggregation of the mucus components. Multivalent mucus-particle interactions, particularly for nanoparticles with cationic surfaces, present a direct impedance to the transport, and have formed the basis for designing muco-adhesive particles.[21] In contrast, pioneering efforts by Hanes et al.[22] have shown the promise for mucopermeation when the nanoparticulate surfaces were passivated with dense coatings of hydrophilic PEG (polyethylene glycol) chains. Here, we seek to create an entirely complementary route to enhance nanoparticle transport through the mucus by expanding on the recently demonstrated bioprotectant attributes of trehalose in nanoparticle-cellular interactions.[23] In this study, such a role for trehalose is explored through molecular spectroscopy, rheological and nanostructural measurements using fresh undiluted porcine jejunal mucus under physiologically relevant conditions (37°C).
We employed three types of nanoparticles classified according to the surface charge and reactivities – positively charged polystyrene nanoparticles, negatively charged silica nanoparticles, and negatively charged surface reactive silver nanoparticles. By using the exquisite molecular specificity of the Raman spectroscopy, we revealed the unique mode of mucus interaction of each of these nanoparticles based on their surface properties. To facilitate detailed analyses of these mucus-based interactions, we also generated a label-free photonic tool by harnessing the protein aggregation-induced formation of emission hot-spots in the silver nanoparticle clusters. This nanoparticulate density mapping sensor leverages the underexplored far-red fluorescence activity of the plasmonic silver nanoparticles that permitted the use of the latter as an aggregating model system, as well as, an imaging agent. In contrast to the other approaches that attempt to measure such nanoparticle-mucus interactions, this method obviates the need for a separate exogenous reporter molecule. This nanoparticle aggregating model system was independently validated through the SERS (surface-enhanced Raman spectroscopy) measurements, which encodes the molecular interactions at the nanoscale.[24–27] SERS has surfaced as a powerful analytical tool because of its molecular specificity and high sensitivity, where the latter is attained by harnessing the localized surface plasmon resonance (LSPR) to significantly amplify the Raman signal of the analyte(s) in the vicinity of plasmonic substrates.[28–30] Owing to its advantages such as simplicity, photostability, quantifiability and multiplexing capability, SERS has been successfully employed for a wide range of applications in biomedical imaging and chemical sensing.[31–34] Several laboratries, including our own, have harnessed SERS in elucidating an array of biomolecule-nanoparticle interactions.[27, 35, 36] Of particular relevance, we have used these spectral tools to uncover the effect of trehalose-rich microenvironment on protein-nanoparticle interactions.[20, 23] Since the mucus presents a complex matrix of mucin glycoproteins, globular proteins, and other organic plus inorganic entities, it necessitates the use of a non-destructive, molecular-specific analytical tool such as SERS.
Together, these photonic and spectroscopic tools have helped in establishing for the first time the role of preferential nanoparticle-induced aggregation of the globular domains of mucin and non-mucin proteins, in alteration of rheological properties. Overall, our findings established trehalose as a multi-functional agent that is able to play distinct roles in facilitating the mucus dispersion and theranostic particle transport, and pave the way for in vivo studies featuring controlled drug delivery to the targeted sites.
2. Results and Discussion
The primary objective of this study was to design a non-functionalized route to reduce the inherent tendency of mucus to immobilize nanoparticles while maintaining (or enhancing) mucus dispersion and hydration. To test the efficacy of trehalose as a multi-functional agent, we performed a series of experiments: (A) to elucidate the impact of nanoparticle interaction with the mucin-interactome; and (B) to observe the influence of trehalose in reducing mucoadhesion of nanoparticles. These experiments were conducted using porcine jejunal mucus due to its similarity in rheological and structural properties with that of the mucus found in the human gut.[12, 37]
2.1. Investigation of the mucus-nanoparticle interactions
2.1.1. Analysis of the mucus-nanoparticle interactions with label-free Raman spectroscopy
Raman spectroscopy of mucus:
Raman spectroscopy was undertaken to elucidate the molecular mechanism of interaction between the nanoparticles and mucus, which is essential to gain a better understanding of the mucoadhesion and, hence, of nanoparticle transport. The Raman spectrum of porcine jejunal mucus is dominated by the modes from the heavily glycosylated mucin polymers along with the globular domains (Figure 1A). We chose to focus on the vibrational region corresponding to the amide transitions of the protein backbone as it is intrinsic to all the proteins, and is perhaps most correlatable to the protein conformation. Here, the presence of a broad amide I peak showed the presence of flexible or multiple conformations.[38] The amide I showed the presence of predominantly random coil conformation in the range of 1640–1650 cm−1. There was also a significant portion of β-sheet conformation corresponding to the peaks at around 1670–1690 cm−1 and, also from 1612–1640 cm−1.[39, 40] This observation is consistent with the fact that the central mucin polymers are inherently randomly coiled due to the heavy glycosylation and the presence of negatively-charged sugars that prevent the ordering of the mucin domains (Figure 1B).[41] A considerable presence of the β-sheets has also been found in certain mucins, such as, MUC5B, which is deemed critical for the globular domain specific functions, such as the intermolecular interactions, cross-linking and polymerization.[42] The presence of β-sheet amide I peaks confirmed the existence of these domains in MUC2 that constituted the porcine jejunal mucus. Additionally, we noted the presence of α-helical content, which is indicative of the presence of hundreds of globular proteins playing an active role in the biophysical properties of the mucus along with the globular domains in mucin itself (Figure 1C–G).[14] These globular proteins, notably Clca1, Zg16 and Klk1, are almost ~1300 in number, and were identified in the mucus with a relatively stable proteome consisting of 80% of the identified proteins.[43] The amino acid composition and structures of the Cys-rich regions of the mucin polymers were also similar to the secreted globular proteins and may contribute to the α-helical or β-sheet amide I modes. The cysteine residues are found in the carboxy- and amino-terminal non-repeat regions (Figure 2A and 2B). The mucin protein core also contained a centrally located tandem repeat region rich in residues, such as, Ser, Thr and Pro. The regions, where the cysteines formed disulphide bonds, contained Ser/Thr or O-glycosylation, and were characteristic of the globular secreted proteins. A detailed band assignment of the Raman spectrum on mucus is given in the Table S1 (Supporting Information).
Figure 1.
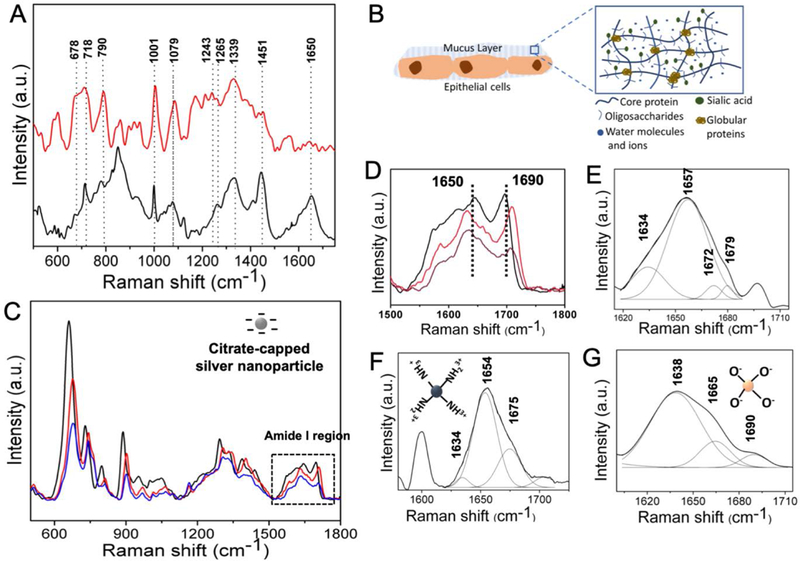
(A) Raman spectra recorded from the porcine jejunal mucus (black) and the mucus incubated with silver nanoparticles (red). (B) Schematic showing the various components of mucus including the core proteins, oligosaccharides and globular proteins. (C) Raman spectra of the purified mucin in the presence of different concentrations of silver nanoparticles - black, red and blue correspond to 50, 5 and 0.5 nM concentrations, respectively. (D)-(G) Amide I regions of (C), porcine jejunal mucus, mucus incubated with positively charged polystyrene nanoparticles, and negatively charged silica nanoparticles (both 100 μg/ml), respectively.
Figure 2.
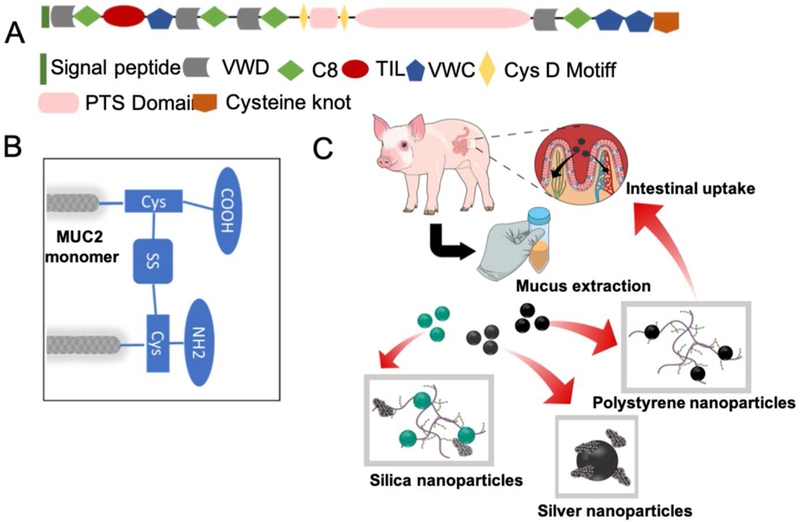
(A) The human intestinal MUC2 transcript encodes a 5179 amino acid protein. N-signal peptide at the N-terminus, VWD - von Willebrand factor domain structures, C8 - cysteine-rich domains, TIL - trypsin inhibitor-like cysteine-rich domains (TIL) and PTS - a 1614 amino acid central PTS domain. (B) The central repetitive domain of the MUC2 mucin monomer is rigid due to heavy glycosylation. They are linked through the cysteine residues via disulphide bonds. These areas are also prone to attachment to the surface-reactive silver nanoparticles. (C) The schematic of the nanoparticle-mucus interaction experiments. The mucus is first extracted and then incubated with three different types of nanoparticles. The negatively charged silica nanoparticles interacted weakly to the mucin and the globular proteins. The surface reactive silver nanoparticles interacted predominantly with the globular proteins while the positively charged polystyrene nanoparticles interacted with the mucin polymers. The way these nanoparticles interacted with the intestinal mucus dictate their intestinal uptake and release into the blood stream thereafter.
Mucus-nanoparticle interactions:
The interaction of the nanoparticles with the various mucin components depended upon their surface reactivity, charge and size.[4] In order to investigate these interactions in details, we chose three different types of nanoparticles – (A) silver nanoparticles - with high surface reactivity, negatively charged and mean size of 60 nm, (B) silica nanoparticles – negatively charged with mean size of 100 nm, (C) polystyrene nanoparticles - positively charged with mean size of 100 nm (Figure 2C). We performed a detailed amide I analysis for each of these nanoparticles to: (A) understand the alterations induced by a particular class of nanoparticles on the secondary protein structure, and (B) identify the secondary structural motifs that specifically interact with the particular class of nanoparticles. When incubated with the silver nanoparticles (0.5–5 nM), we observed a significant change in the mucus spectra including that of the amide regions (Figure 1A). The formation of the silver nanoparticle-protein conjugates provided a favorable condition for SERS enhancement (Figure S2), and only the modes which lied in the proximity of, or were in direct contact, to the nanoparticles were selectively enhanced.[44] Silver nanoparticles caused a drastic decrease in the amide I intensity of mucus, similar to the earlier reported cases of lysozyme and other globular proteins.[45] There was also a shift in the amide III mode from 1260–1243 cm−1 indicative of the α-helix to random coil transition. Interestingly, when the SERS measurements were performed on purified mucin with different concentrations of the silver nanoparticle, no such changes were noted in the amide I and III regions indicating that silver nanoparticles did not cause structural changes to the mucin polymers (Figure 1B). Collectively, these observations confirmed that the silver nanoparticles selectively interacted, denatured and aggregated the mucin-associated globular proteins. The denaturing interactions were also encoded in the modes corresponding to the aromatic amino acid side chains. The change of the proteins conformations, either exposed or buried the amino acid residues, caused alterations of the intensities from the corresponding modes. For example, the 1001 cm−1 peak, corresponding to the ring breathing mode of phenylalanine, increased in intensity along with the 1530 cm−1 peak due to the tryptophan.
In contrast, regarding the polystyrene nanoparticles (100 μg/ml), the components of the amide I modes were not radically altered (Figures 1F) indicating minimal interactions with the globular proteins. However, in case of the silica nanoparticles (100 μg/ml), the changes in the components of the amide I mode were present, albeit less pronounced than the silver nanoparticles (Figure 1G). These results explained why the silica nanoparticles were non-mucoadhesive and, only had a weak interaction with the mucus components including the globular proteins, whereas, the positively charged polystyrene nanoparticles were mucoadhesive and interacted selectively with the negatively charged polymeric mucin components of the mucus. Figure 2C provides a schematic explaining the interactions of the different nanoparticles with various mucus components. Elucidation of these differential interactions is critical towards understanding the complex process of mucoadhesion, which in turn dictates the transport of the nanoparticles through the mucosal barriers.
2.1.2. Analysis of the viscoelastic properties of the mucus in the presence of nanoparticles
Use of the cationic nanoparticles, along with hydrophobic cores, is a well-known technique to induce mucoadhesion.[46] The adhesive nature of mucus is due to the high density of negatively charged glycans, harboring strong proton acceptor as well as donor groups that bind to hydrophobic naked protein domains and lipids. Therefore, introduction of positively charged polystyrene nanoparticles induced sufficient polyvalent interactions and immobilized the nanoparticles. Hence, deploying cationic polystyrene nanoparticles provided a reliable measure of trehalose’s ability to protect against binding of the nanoparticles, and the resultant change in the viscosity and aggregation. Here, we employed polystyrene nanoparticles of 100±10 nm size and +(23±2) mV in surface potential. At the macroscale, mucus behaves as a non-Newtonian gel distinguished from classical solids and liquids by its response towards shear rate and shear stress; while, at the nanoscale, it behaves as a low viscosity fluid. To study the alterations to the physiological behavior (or its lack thereof) due to the presence of trehalose, freshly acquired porcine jejunal mucus was used without being subjected to freeze-thaw cycles or prolonged storage under refrigeration. The results of rheological measurements on mucus exposed to these cationic nanoparticles (Figure 3A and 3B; Figure S3) showed that the cationic polystyrene nanoparticle-treated mucus exhibited increase in both the Gˊ (elastic modulus) and G˝ (viscous modulus) as a result of the significant changes in the viscoelasticity.
Figure 3.
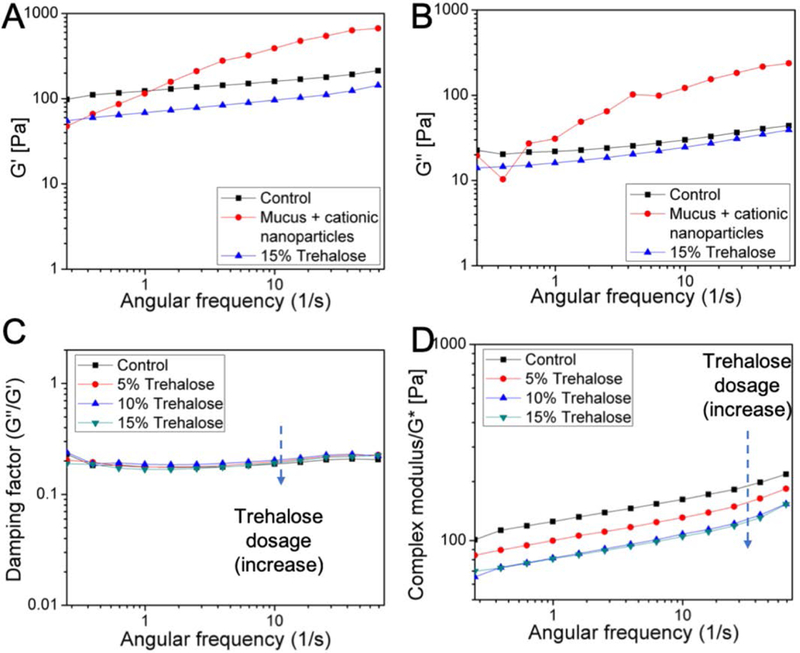
(A) and (B) Trehalose (15%) protected porcine jejunal mucus from increase in both the Gˊ and G˝ following 2 h exposure to the cationic 100 nm polystyrene nanoparticles (100 μg/ml). (C) and (D) The damping factor and the complex modulus (G*) of mucus in different concentrations (5, 10 and 15%) of trehalose. Trehalose decreased G* but not the damping factor of porcine jejunal mucus in a dose-dependent manner.
2.2. Trehalose mediation of the mucus-nanoparticle interactions
2.2.1. Rheological impact of the addition of trehalose on nanoparticle-induced stress
First, the effect of trehalose on the viscoelastic properties of mucus in the absence of nanoparticles was determined (Figure 3C and 3D). The storage modulus Gˊ (elastic response) and loss modulus G˝ (viscous behavior) of the porcine jejunal mucus in the absence (control) or presence of 5%, 10% and 15% trehalose (w/v) were measured by oscillatory rheology at 37°C (Figure S3) after 2 h exposure. Clearly, trehalose decreased both the Gˊ and G˝ in a dose-dependent manner with respect to the control. From these measurements, the damping factor (tan δ = G˝/Gˊ) and the complex modulus (G*) were also determined (Figure 3A and B). Compared to the control, trehalose did not cause any change in the damping factor, which reflected the degree of association within the mucin polymers; thereby, indicating that trehalose did not induce any fundamental disturbance to the mucosal mesh. In contrast, the G* parameter, which is indicative of cumulative yield stress, was decreased in the presence of trehalose in a dose-dependent way.
These observations revealed that the exposure to trehalose made mucus less stiff, which suggests that the addition of trehalose could diminish aggregation of the globular constituents in the mucus. Additionally, trehalose (15%) offered protection against the aggregation of mucin polymers induced by the cationic aminated polystyrene nanoparticles (100 μg/ml), by slowing down or minimizing the nanoparticle-mucin interactions. While the cationic nanoparticles caused a rapid increase in both the Gˊ and G˝ of mucus, such effects were missing in exposed samples pre-treated with trehalose (Figure 3A and 3B).
From the particle tracking experiments on mucus (Figure 4), both the mean speed (m/h) and linearity/straightness of the tracks were found to have increased considerably in the presence of trehalose within the mucus samples (Figure S4, Movies S5 and S6). The cationic polystyrene nanoparticles were observed to aggregate (Figure 4B) and showed very little permeation in the control mucus, which was reflected in their sluggish speed. Additionally, the cationic polystyrene nanoparticles caused micro-aggregation of the control mucus that resulted in greatly increased tortuosity of the average paths (Figure S4). Compared to the cationic particles, the anionic polystyrene nanoparticles and fluorescent silica nanoparticles expectedly showed higher speed and lower tortuosity of the tracks in mucus. Nevertheless, the mean speed increased, and average track length decreased, for all the varieties of nanoparticles tested in trehalose-treated mucus (Figure 4C), with the differences being more pronounced for the positively charged polystyrene nanoparticles.
Figure 4.
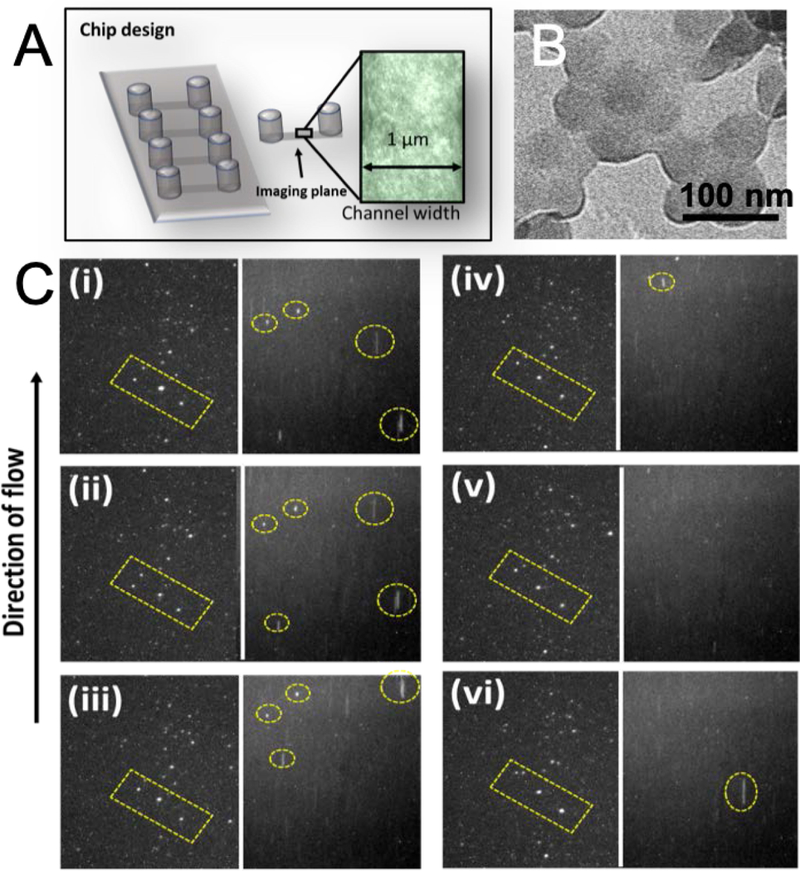
(A) Experimental set up and zoomed view of a microchannel (l×b×h = 17×1×0.1 mm3) filled with porcine jejunal mucus for imaging (10×). (B) The TEM (transmission electron microscopy) image of the aggregated polystyrene nanoparticles in the presence of mucus. (C) Nanoparticle tracking in the absence (left panels) and presence (right panels) of trehalose. Frames (i)-(vi) capture the anionic fluorescent silica nanoparticles permeating through mucus at every 10 frames. The yellow dotted rectangles show the relative position of the silica nanoparticles in trehalose-free environment, while the yellow circles in presence of trehalose.
2.2.2. Label-free imaging of nanoparticle-mucus interactions in trehalose-rich milieu
In order to selectively study the mucus-nanoparticle interactions and the potential changes in the presence of trehalose, we developed a new functional imaging tool employing plasmonic silver nanoparticles. While the small size, negative charge and hydrophilic nature of nanoparticles facilitate (in principle) easy permeation and minimum mucoadhesion, the surface of the nanoparticles are prone to (non-specifically) attach to certain functional groups, such as, the thiols and disulfides (Figure 2C), leading to further aggregation. The latter form an integral part of the mucin interactome along with the associated globular proteins. The latter leads to mucoadhesion of the silver nanoparticles changing the viscoelastic nature of the mucus and hindering nanoparticle transport. We hypothesized that such aggregate formation could also be leveraged to generate an intrinsic imaging tool that does not necessitate the addition of exogenous fluorophore or contrast agents. Our hypothesis is based on the formation of electromagnetic hot-spots in its aggregated form (Figure 5A), wherein the emission from the aromatic amino acids of the proteins and other fluorescent moieties are enhanced by orders of magnitude. On the other hand, when the nanoparticles did not interact with the mucus matrix and existed as isolated entities, they failed to enhance the fluorescence. In the former scenario of aggregate formation, characteristic far-red emission was observed, as has previously been reported with tryptophan.47 The magnitude of shift depends on the environment of the chromophore and may exceed that observed on transition from a solid to liquid solvent with a normal mid-band excitation.
Figure 5.
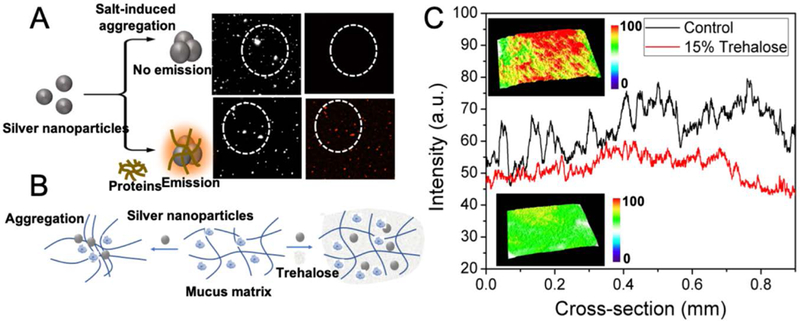
(A) Schematic of mucus-induced aggregation of the silver nanoparticles that resulted in far-red emission. The top two panels show the dark field and fluorescence images of the silver nanoparticles aggregated by salt (control); and, the bottom two panels show the dark-field and fluorescence images of silver nanoparticles aggregated by lysozyme (a model protein). The differences between the top and bottom panels (specifically the red fluorescent dots in the latter) show that the far-red emission is selectively observed in case of the protein-aggregated nanoparticles. (B) Schematic showing how addition of the nanoparticles aggregate the mucus matrix causing its collapse and impeding nanoparticle transport; whereas, in the presence of trehalose, the aggregation of the mucus is greatly reduced. (C) Plots of emission intensities of mucus treated with the silver nanoparticles in presence (red) and absence (black; control) of trehalose. Insets show the representative 3D surface plots of silver nanoparticle cluster distribution showing the increased formation of aggregates (top panel) in the mucus in absence of trehalose, and the absence of aggregates in the presence of trehalose (bottom panel).
Here, we extended the concept to observe the far-red emission of proteins, which exhibit dipole relaxation non-equilibrium excited states and longer dipolar relaxation times.[47] Control experiments with salt aggregated silver nanoparticles failed to show any emission validating our premise of emission stemming from the nanoparticle-protein aggregates (Figure 5A). Thus, the observation of far-red fluorescence gave rise to a powerful aggregation marker that can be utilized to functionally image the mucoadhesion and any potential changes in a trehalose-rich microenvironment (Figure 5B). Representative real-time fluorescence emission profiles of the control mucus and mucus with trehalose (15%) are shown as the insets of Figure 5C. The surface plots of the mucus, with or without trehalose, measured through representative sections of the fluorescence images were compared. The surface plots for control mucus were consistently more uneven showing a mixture of peaks and troughs, which directly underscored the heterogeneity of mucus in the presence of silver nanoparticles. The aggregation of the latter gave rise to spatially confined plasmonic hot-spots corresponding to the microscopic heterogeneous domains. On the contrary, the trehalose-mixed mucus samples exhibited a more even pattern in the computed surface plots signifying a reduced micro-heterogeneity. The fluorescence emission profiles with an abundance of the higher intensity (red) spots at the top panel were indicative of the increased aggregation of the nanoparticles in the control mucus samples. The studies were performed in a microfluidic channel (similar to the one shown in Figure 4A) and the extremely small amount of mucus required to fill up the closed microchannels did not impede light penetration while also prevented clumping of the mucus due to the aerial oxidation.
The presence of micro-heterogeneity (or its lack thereof) was also confirmed with the help of Raman imaging of the mucus in the presence of silver nanoparticles. The hot-spots formed as a result of nanoparticle-protein interaction enhanced the Raman signals. Here, we used PCA (principal component analysis) on the acquired Raman profiles to perform dimensionality reduction,[36] and to identify potential spectral differences in the presence/absence of trehalose. The multidimensional radial visualization plot, based on the principal component (PC) scores, showed the clustering behavior and separation of the samples with and without the trehalose (Figure 6A). The multidimensional radial visualization plot, created through RadViz using a VizRank algorithm[48] on the PC-scores, showed complete separation among the samples with and without trehalose (Figure 6A). The clustering of scores was narrower in the presence of trehalose reinforcing the inherent homogeneity of mucus in such environments (Figure 6B). Along similar lines, the Raman maps, reconstructed using the PC-scores (Figure 6C), displayed more heterogeneity in the aggregated mucus in the absence of trehalose.
Figure 6.
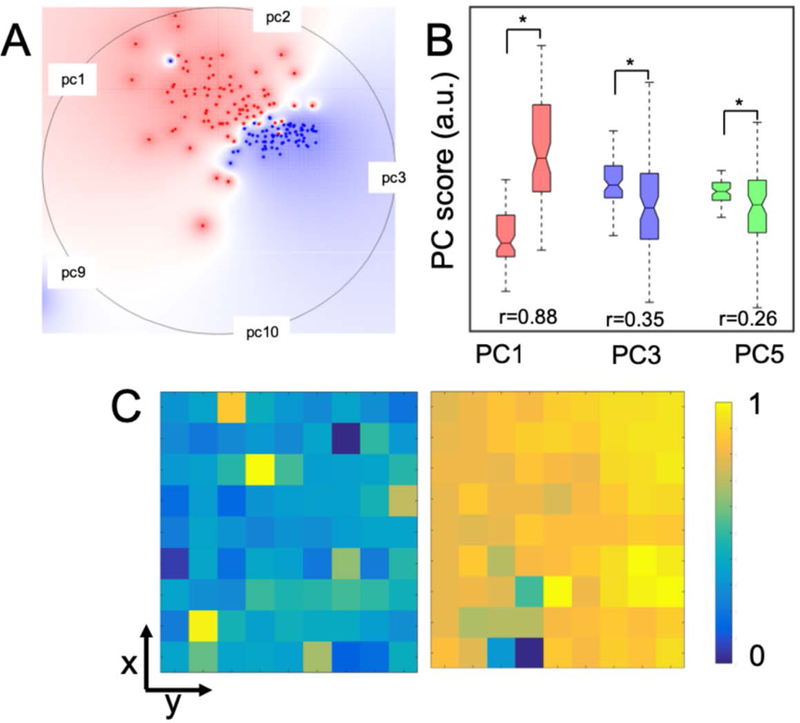
(A) Radial visualization plot highlighting class separation using the VizRank algorithm. Multidimensional radial visualization plot based on the PC scores showed the clustering behavior of the spectra belonging to the silver nanoparticle-mucus conjugates in the presence of trehalose (blue dots), and, in its absence (red dots). (B) PC score box plots of the silver nanoparticle-mucus conjugates with (left) and without trehalose (right). The difference in scores that were statistically significant at p<0.05 level (Wilcoxon rank sum test) are marked by asterisk (*) symbols. The effect size (r) showing the difference between the two groups is provided for comparison. (C) Spatial maps of normalized PC3 scores for silver nanoparticle-mucus conjugates without (left panel) and with trehalose (right panel).
When trehalose was present in the mucus, the amide I band intensity was higher than that observed in its absence (Figure 7A), and there was no interference from trehalose itself (Figure S7). The amide III features also showed the preservation of the modes of native mucus (at ~1300 cm−1), though few alterations were observed. The mode at 1079 cm−1, corresponding to Cα-N (cys) stretching, was supressed in the presence of trehalose indicating reduced uncoiling of the protein domains. Hence, we can reasonably infer that the interaction of the silver nanoparticles in the presence of trehalose did not lead to complete denaturation of the globular domains in the mucin and non-mucin components. The SERS spectra of the purified mucin and jejunal mucus in the presence of silver nanoparticles showed negligible changes (Figure 7B), reiterating the fact that trehalose itself did not induce structural changes to the mucin polymers at molecular levels. It is worth noting that the addition of trehalose also did not cause any discernible change of pH in the mucus samples, as revealed through the FLIM (fluorescence lifetime imaging) measurements (Supporting Information S8 and Figure S9).
Figure 7.
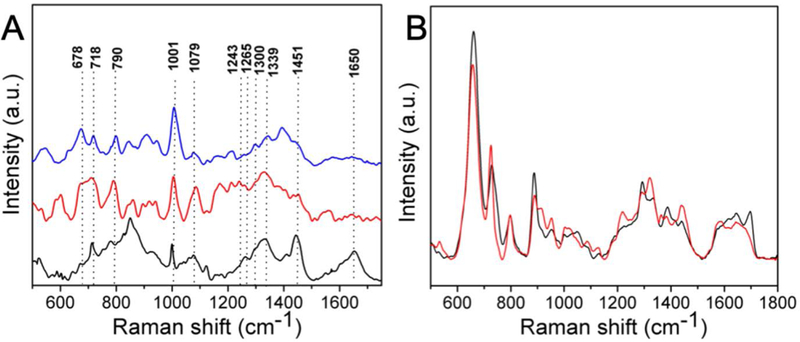
(A) Raman spectra of the porcine jejunal mucus (black), mucus mixed with the silver nanoparticles (red), and mucus mixed with silver nanoparticles plus 15% trehalose (blue). (B) SERS spectra of the purified mucin in the absence (black) and presence (red) of 15% trehalose.
3. Concluding Remarks
Encapsulation of the drugs within nanocarriers has attracted significant attention in the literature due to the possibility of direct and sustained delivery to the epithelial cells in mucus-covered tissues. Nevertheless, the permeation of the mucus barrier and its entrapment of foreign particles have made the practical realization of such a therapeutic route challenging. The core strategy to design nanomedicines with improved mucopermeation has relied heavily on functionalizing the nanoparticle surfaces with low molecular weight polyethylene glycol (PEGylation).[49] Alternatives to PEG have also been introduced such as poly(2-alkyl-2-oxazolines), polysarcosine, poly(vinyl alcohol), zwitterionic polymers and mucolytic enzymes.[50] Hydroxyl-containing non-ionic water-soluble polymers have also been explored.[50] Alternately, a chemically tunable microenvironment would offer an attractive strategy to prevent nanoparticles from adversely reacting or adhering to the mucus hydrogel. However, reports on tuning the microenvironment of the mucus to make it more conducive for administration of drug formulations are limited. The two interconnected foci of this work were to: (A) understand the molecular and rheological facets of mucus-nanoparticle interactions by applying spectroscopic imaging methods; (B) investigate the feasibility of using trehalose to reduce nanoparticle aggregation in the mucus environment.
Our findings showed that, in the presence of a trehalose-rich milieu, the rheological properties of mucus did not show appreciable changes, even when the nanoparticles were introduced. Mucus from the porcine jejunum mostly consists of MUC2-rich mucin, which are assembled in trimers and form extensive lamellar porous networks.[51] From the Raman and SERS measurements, we observed that the mucoadhesive nanoparticles, such as, the positively charged polystyrene nanoparticles, interacted with the negatively charged MUC2 glycoproteins, and hence, were trapped in the mucus. However, negatively charged nanoparticles, such as, the silica and silver nanoparticles, could permeate through the pores of the lamellae in the mucus; while, occasionally being trapped due to the steric hindrance and hydrophobic interactions. These nanoparticles could also pass through the transient channels between the lamellae, rather than the networks.[51]
Previous studies unfortunately have largely ignored the role of non-mucin components, and how the interacting nanoparticles behaved in their presence. From our molecular spectroscopy data, it is clear that the interactions of nanoparticles with globular proteins were specific to the charge and the surface reactivity of the nanoparticles. Although non-mucoadhesive nanoparticles diffused through the mucus without significant influence from the other mucus components, the diffusivity of nanoparticles interacting with these non-mucin components may be affected. The rheological factors, such as the damping factor, clearly showed the adverse effects of the nanoparticles and the protective nature of trehalose - which effectively lessened mucoadhesion. In other words, trehalose was able to resist the nanoparticle-induced denaturation of the globular proteins to a significant degree, as demonstrated through our spectroscopic measurements. We envision that, with further refinement, the generation of a trehalose-rich localized microenvironment in vivo can significantly reduce the adverse interactions between mucin polymers, the globular proteins of the mucin-interactome and the nanoparticle surfaces. A particular embodiment may utilize a polymeric drug delivery system that encapsulates trehalose and therapeutic nanoparticles,[52] in order to improve the transmucosal delivery of the latter at the targeted sites.
4. Experimental section
Collection and preparation of the porcine jejunal mucus:
Fresh porcine mucus was collected and preserved, as reported earlier.[53] Briefly, porcine entrails from three adult pigs were collected from the abattoirs in Krebs-Hanseleit solution. The jejunum was dissected out and sectioned into pieces within an h from excision. The jejunal pieces were opened with an incision through the anti-mesenteric border before being washed with deionized water in order to clean up any remaining acid chyme. Mucus was collected in falcon tubes with a custom-built suction instrument. A stream of nitrogen flow at 4°C was maintained over the filled falcon tubes overnight in order to prevent oxidation, and to allow time for the collected mucus samples to equilibrate. All experiments were conducted within 72 h of mucus collection, and centrifugation steps that are known to alter the viscoelasticity of mucus were avoided. As a control, purified mucin from porcine stomach was used (Sigma Aldrich, product number M2378).
Rheological measurements:
Experiments to determine mucus rheology were performed, as described previously,[53] using a rotational rheometer (MCR301, Anton Paar) with the temperature maintained at 37°C by means of a Peltier heating system. Briefly, untreated (control) or trehalose-treated mucus samples (1 ml) were measured in a parallel-plate configuration (diameter 25 mm, TruGap®) with angular frequency (ω) increasing from 0.025–62.8/s. The gap between the plates was 1 mm. The data were analyzed by Rheoplus® software (V3.21). All experiments were done in triplicates (n=3). The damping factor (tan δ = G´´/G´) was calculated from G´ and G´´ from each frequency sweep experiment.
Micro-slide experiments and epifluorescence imaging:
Optically translucent microslides with six parallel microchannels (μ-Slide VI0.1, Ibidi GmbH, Germany) of rectangular cross section (l×b×h = 17×1×0.1 mm3; 1.7 μl) were used for epifluorescence and FLIM. The use of this microfluidic platform permitted the conservation of the mucus specimens; while, also ensuring a thin and reproducible imaging section. The microchannels were filled with ca. 30 μl of mucus (with or without trehalose) and silver nanoparticles (0.5–5 nM) for density mapping measurements, as detailed below. The end-reservoirs were connected to a syringe and a gentle suction pressure was applied to fill the microchannels with mucus. Epifluorescence measurements were performed using an inverted Nikon Andor microscope (4/10×) at λex/em=470/525 nm. Control experiments were performed with empty microchannels, and the background signals recorded were used as baselines for analyses of the fluorescent samples. The acquired images were analyzed by FIJI® (NIH, USA) software with plug-in for 3D interactive surface plots.
Nanoparticle tracking experiments:
Single particle tracking (SPT) experiments were performed as described before.[54] In short, the microchannels filled with the porcine jejunal mucus, with or without trehalose (15%), were exposed to aqueous dispersions (100 μg/ml) of the fluorescent polystyrene and silica nanoparticles. The polystyrene nanoparticles were prepared as previously described.[53] The silica nanoparticles were synthesized and dye-labeled using a modified Stöber method (Figure S1C).[55] One of the end-reservoirs (60 μl) was filled with ~30 μl of nanoparticle dispersions to allow mucopermeation under osmotic pressure while the other was filled with 30 μl of water. Imagery data acquisition was done in an inverted microscope (4×) at 37°C with 100 cycles each of 5.5 s exposure at 10 s intervals (Movies S5 and S6). The data were analyzed with Imaris® (Bitplane Inc, Switzerland) and FIJI® (NIH, Bethesda, MD, US) softwares to extract numerical readouts from at least 170 independent tracks for each type of permeating nanoparticles at t = 0, 15, 30 and 60 min based on the following two parameters: mean speed (m/h) and linearity (straightness) of tracks. The linearity of tracks was extrapolated into a R2 scale of 0–1, where values of 0 and 1 presented complete non-linearity and absolute linearity, respectively. The numerical data were plotted in Origin2015® (OriginLab Corporation) and significantly different data (p<0.05) obtained for trehalose-treated mucus samples, compared to the control untreated ones, were marked with an asterisk (*) symbol.
Nanoparticle permeation assay:
Silver nanoparticles were prepared by a modified Lee-Meisel method.[56] 100 ml of HPLC grade water (Fisher Scientific) containing 18 mg of AgNO3 (silver nitrate) was brought to the boiling point, and 5 ml of 1% trisodium citrate (Sigma Aldrich) was added under constant stirring. Heating was continued for an h following which the solution was brought back to room temperature while still being stirred. The nanoparticles were characterized by absorbance and zeta potential measurements to determine their absorption maximum and surface charge (Figure S1). Transmission electron microscopy (TEM) was performed using carbon and formvar-coated 300 mesh copper grids (square mesh) to determine the size distribution. The imaging of the samples was done on a FEI Talos system at 200 mV. For the nanoparticle permeation assay, mucus samples were mixed with 5%, 10% and 15% D-(+)-trehalose dihydrate (Sigma Aldrich, 90210). Mucus samples treated with trehalose were kept at 37°C for 2 h before any measurements as well as prior to further exposure to silver and polystyrene nanoparticles (100 nm, obtained commercially from Sigma Aldrich). To study mucus-nanoparticle interactions, a constant 100 μg/ml concentration of nanoparticles was used.
Silver nanoparticle aggregation, Raman spectroscopy and far-red emission experiments:
Aggregation of the silver nanoparticles and the far-red fluorescence from the resultant aggregates were studied using fluorescence and dark field imaging. An upright Nikon NIE microscope with a dark-field condenser and 100× objectives was used for imaging of the nanoparticle aggregates. To test the feasibility of leveraging the far-red fluorescence of nanoparticle aggregates, a model system constituted by the nanoparticles coated with lysozyme (Sigma Aldrich) was first used. Aggregation was induced by addition of 100 mM NaCl solution. Control experiments were also performed using aggregated nanoparticles without the protein moieties. The excitation and the emission filter wavelengths used were 480 nm and 565 nm, respectively. The Raman spectroscopy, SERS measurements and imaging were performed with a Horiba Xplora Plus Raman microscope with an excitation of 785 nm and a 100× objective. Typical accumulation time used to acquire the spectra was 60 s. The spectra were smoothened using a five-point FFT algorithm. Further spectral processing was done using Origin2015®. The dimensionality reduction technique, PCA, was applied to the spectral data to access the clustering and separability of spectra in the absence and presence of trehalose. The scores were obtained using the MATLAB R2014b (Mathworks, Natwick, MA, USA) and were imported onto the Orange data mining software.[57] The RadViz and VizRank algorithms were used to create radial visualization plots. Scores corresponding to PCs yielding maximum class separation were included through the VizRank algorithm. The differences in medians of the PC scores of the samples, with and without trehalose, were considered significant if the two-sided Wilcoxon rank sum test p-value was <0.05. The differences between the groups were quantified through effect size calculated using the Wendt formula for rank biserial correlation.[58]
Supplementary Material
Acknowledgements
SB would like to thank Patsy Kearns (UCD) for technical assistance. IB acknowledges support from DP2GM128198-01, P41-EB015871-31, and RO1CA207208. SS acknowledges funding from American Society of Laser for Medicine and Surgery (ASLMS). SB would like to acknowledge UCD OBRSS (Output Based Research Support Scheme) for funding.
Footnotes
Supporting Information
Supporting Information is available from the Wiley Online Library or from the author.
Contributor Information
Soumik Siddhanta, Department of Mechanical Engineering, Johns Hopkins University, Baltimore, MD 21218, USA.
Sourav Bhattacharjee, School of Veterinary Medicine, University College Dublin (UCD), Dublin, Ireland.
Sabine M. Harrison, School of Agriculture & Food Science, University College Dublin (UCD), Dublin, Ireland
Dimitri Scholz, Conway Institute of Biomolecular & Biomedical Research, University College Dublin (UCD), Dublin, Ireland.
Ishan Barman, Department of Mechanical Engineering, Johns Hopkins University, Baltimore, MD 21218, USA; Department of Oncology, The Johns Hopkins University School of Medicine, Baltimore, MD 21287, USA; Department of Radiology and Radiological Science, The Johns Hopkins University School of Medicine, Baltimore, MD, 21287, USA.
References
- [1].Suh J, Dawson M, Hanes J, Adv. Drug Deliv. Rev. 2005, 57, 63. [DOI] [PubMed] [Google Scholar]
- [2].Li C, Nat. Mater. 2014, 13, 110. [DOI] [PMC free article] [PubMed] [Google Scholar]
- [3].Wilhelm S, Tavares A, Dai Q, Ohta S, Audet J, Dvorak HF, Chan W, Nat. Rev. Mater. 2016, 1, 16014. [Google Scholar]
- [4].Lai SK, Wang Y, Hanes J, Adv. Drug Deliv. Rev. 2009, 61, 158. [DOI] [PMC free article] [PubMed] [Google Scholar]
- [5].Shan W, Zhu X, Liu M, Li L, Zhong J, Sun W, Zhang Z, Huang Y, ACS Nano 2015, 9, 2345. [DOI] [PubMed] [Google Scholar]
- [6].Cornick S, Tawiah A, Chadee K, Tissue Barriers 2015, 3, e982426. [DOI] [PMC free article] [PubMed] [Google Scholar]
- [7].Naughton J, Duggan G, Bourke B, Clyne M, Gut Microbes 2014, 5, 48. [DOI] [PMC free article] [PubMed] [Google Scholar]
- [8].Higgins GT, Allan RB, Hall R, Field EA, Kaye SB, Br. J. Ophthalmol. 2006, 90, 964. [DOI] [PMC free article] [PubMed] [Google Scholar]
- [9].Johansson ME, Hansson GC, Nat. Rev. Immunol. 2016, 16, 639. [DOI] [PMC free article] [PubMed] [Google Scholar]
- [10].Fahy JV; Dickey BF Airway mucus function and dysfunction. N. Engl. J. Med. 2010, 363, 2233. [DOI] [PMC free article] [PubMed] [Google Scholar]
- [11].Wira CR, Rodriguez-Garcia M, Patel MV, Nat. Rev. Immunol. 2015, 15, 217. [DOI] [PMC free article] [PubMed] [Google Scholar]
- [12].Lai SK, Wang Y, Wirtz D, Hanes J, Adv. Drug Deliv. Rev. 2009, 61, 86. [DOI] [PMC free article] [PubMed] [Google Scholar]
- [13].Martyn F, McAuliffe FM, Wingfield M, Hum. Reprod. 2014, 29, 2092. [DOI] [PubMed] [Google Scholar]
- [14].Radicioni G, Cao R, Carpenter J, Ford AA, Wang TT, Li Y, Kesimer M, Mucosal Immunol. 2016, 9, 1442. [DOI] [PMC free article] [PubMed] [Google Scholar]
- [15].KufeNat DW. Rev. Cancer 2009, 9, 874.19935676 [Google Scholar]
- [16].Garland AL, Walton WG, Coakley RD, Tan CD, Gilmore RC, Hobbs CA, Tripathy A, Clunes LA, Bencharit S, Stutts MJ, Proc. Natl. Acad. Sci. USA 2013, 110, 15973. [DOI] [PMC free article] [PubMed] [Google Scholar]
- [17].Boucher RC, Annu. Rev. Med. 2007, 58, 157. [DOI] [PubMed] [Google Scholar]
- [18].Sundaramurthi P, Suryanarayanan R, Phy Chem J. Lett. 2009, 1, 510. [Google Scholar]
- [19].Kaushik JK, Bhat R, J. Biol. Chem. 2003, 278, 26458. [DOI] [PubMed] [Google Scholar]
- [20].Siddhanta S, Barman I, Narayana C, Soft Matter 2015, 11, 7241. [DOI] [PubMed] [Google Scholar]
- [21].Yamamoto H, Kuno Y, Sugimoto S, Takeuchi H, Kawashima Y, J. Control. Rel. 2005, 102, 373. [DOI] [PubMed] [Google Scholar]
- [22].Suk JS, Lai SK, Wang Y, Ensign LM, Zeitlin PL, Boyle MP, Hanes J, Biomaterials 2009, 30, 2591–2597. [DOI] [PMC free article] [PubMed] [Google Scholar]
- [23].Siddhanta S, Zheng C, Narayana C, Barman I, Chem. Sci. 2016, 7, 3730–3736. [DOI] [PMC free article] [PubMed] [Google Scholar]
- [24].Feliu N, Hassan M, Garcia Rico E, Cui D, Parak W, Alvarez-Puebla R, Langmuir 2017, 33, 9711. [DOI] [PubMed] [Google Scholar]
- [25].Hamada K, Fujita K, Smith NI, Kobayashi M, Inouye Y, Kawata S, J. Biomed. Opt. 2008, 13, 044027. [DOI] [PubMed] [Google Scholar]
- [26].Siddhanta S, Paidi SK, Bushley K, Prasad R, Barman I, ChemPhysChem 2017, 18, 72. [DOI] [PubMed] [Google Scholar]
- [27].Karthigeyan D, Siddhanta S, Kishore AH, Perumal SS, Ågren H, Sudevan S, Bhat AV, Balasubramanyam K, Subbegowda RK, Kundu TK, Proc. Natl. Acad. Sci. USA 2014, 111, 10416. [DOI] [PMC free article] [PubMed] [Google Scholar]
- [28].Porter MD, Lipert RJ, Siperko LM, Wang G, Narayanan R, Chem. Soc. Rev. 2008, 37, 1001. [DOI] [PubMed] [Google Scholar]
- [29].Kneipp K, Wang Y, Kneipp H, Perelman LT, Itzkan I, Dasari RR, Feld MS, Phys. Rev. Lett. 1997, 78, 1667. [DOI] [PubMed] [Google Scholar]
- [30].Nie S, Emory SR, Science, 1997, 275, 1102. [DOI] [PubMed] [Google Scholar]
- [31].Lane LA, Nie S, Chem. Rev. 2015, 115, 10489. [DOI] [PubMed] [Google Scholar]
- [32].Wang Y, Yan B, Chen L, Chem. Rev. 2012, 113, 1391. [DOI] [PubMed] [Google Scholar]
- [33].Zong C, Xu M, Xu LJ, Wei T, Ma X, Zheng XS, Hu R, Ren B, Chem. Rev. 2018, 118, 4946. [DOI] [PubMed] [Google Scholar]
- [34].Schlücker S, Angew. Chem. Intl. Ed. 2014, 53, 4756. [DOI] [PubMed] [Google Scholar]
- [35].Siddhanta S, Wróbel MS, Barman I, Chem. Commun. 2016, 52 9016. [DOI] [PubMed] [Google Scholar]
- [36].Paidi SK, Siddhanta S, Strouse R, McGivney JB, Larkin C, Barman I, Anal. Chem. 2016, 88, 4361. [DOI] [PubMed] [Google Scholar]
- [37].Tomkiewicz RP, Albers GM, Ramirez OE, Rubin BK, Sanctis GTD, King M, Can. J. Physiol. Pharmacol. 1995, 73, 165. [DOI] [PubMed] [Google Scholar]
- [38].Maiti NC, Apetri MM, Zagorski MG, Carey PR, Anderson VE, J. Am. Chem. Soc. 2004, 126, 2399. [DOI] [PubMed] [Google Scholar]
- [39].Barth A, Zscherp C, Q. Rev. Biophys. 2002, 35, 369. [DOI] [PubMed] [Google Scholar]
- [40].Siddhanta S, Narayana C, Nanomat. Nanotechnol. 2012, 2, 2. [Google Scholar]
- [41].Perez-Vilar J, Hill RL, J. Biol. Chem. 1999, 274, 31751. [DOI] [PubMed] [Google Scholar]
- [42].Davies HS, Singh P, Deckert-Gaudig T, Deckert V, Rousseau K, Ridley CE, Dowd SE, Doig AJ, Pudney PD, Thornton DJ, Blanch EW, Anal. Chem. 2016, 88, 11609. [DOI] [PMC free article] [PubMed] [Google Scholar]
- [43].Rodríguez-Piñeiro AM, Bergström JH, Ermund A, Gustafsson JK, Schütte A, Johansson ME, Hansson GC, Am. J. Physiol. Gastrointest. Liver Physiol. 2013, 305, G348. [DOI] [PMC free article] [PubMed] [Google Scholar]
- [44].Sharma B, Frontiera RR, Henry A, Ringe E, Van Duyne RP, Mater. Today 2012, 15, 16. [Google Scholar]
- [45].Porubcan RS, Watters KL, McFarland JT, Arch. Biochem. Biophys. 1978, 186, 255. [DOI] [PubMed] [Google Scholar]
- [46].Dawson M, Krauland E, Wirtz D, Hanes J, Biotechnol. Prog. 2004, 20, 851. [DOI] [PubMed] [Google Scholar]
- [47].Demchenko AP, Ladokhin AS, Eur. Biophys. J. 1988, 15, 369–379. [DOI] [PubMed] [Google Scholar]
- [48].Leban G, Zupan B, Vidmar G, Bratko I, Data Min. Knowl. Discov. 2006, 13, 119. [Google Scholar]
- [49].Mitragotri S, Burke PA, Langer R, Nat. Rev. Drug Discov. 2014, 13, 655. [DOI] [PMC free article] [PubMed] [Google Scholar]
- [50].Khutoryanskiy VV, Adv. Drug. Deliv. Rev. 2018, 124, 140. [DOI] [PubMed] [Google Scholar]
- [51].Round AN, Rigby NM, Garcia A de la Torre, Macierzanka A, Mills EC, Mackie AR, Biomacromolecules 2012, 13, 3253. [DOI] [PubMed] [Google Scholar]
- [52].Giri J, Li W, Tuan RS, Adv. Mater. 2011, 23, 4861. [DOI] [PMC free article] [PubMed] [Google Scholar]
- [53].Bhattacharjee S, Mahon E, Harrison SM, McGetrick J, Muniyappa M, Carrington SD, Brayden DJ, Nanomedicine NBM (Elsevier) 2017, 13, 863. [DOI] [PubMed] [Google Scholar]
- [54].Bhattacharjee S, Gaspar MM, Scholz D, Almeida AJ, Brayden DJ, Ther. Deliv. 2018, 9, 419. [DOI] [PubMed] [Google Scholar]
- [55].Gao X, He J, Deng L, Cao H, Opt. Mater. 2009, 31, 1715. [Google Scholar]
- [56].Lee PC, Meisel D, J. Phys. Chem. 1982, 86, 3391. [Google Scholar]
- [57].Demšar J, Curk T, Erjavec A, Gorup Č, Hočevar T, Milutinovič M, Možina M, Polajnar M, Toplak M, Starič A, J. Mach. Learn. Res. 2013, 14, 2349. [Google Scholar]
- [58].Wendt HW, Eur. J. Soc. Psychol. 1972, 2, 463. [Google Scholar]
Associated Data
This section collects any data citations, data availability statements, or supplementary materials included in this article.