Abstract
Growing evidence highlights an association between an imbalance in the composition and abundance of bacteria in the breast tissue (referred as microbial dysbiosis) and breast cancer in women. However, studies on the breast tissue microbiome have not been conducted in non-Hispanic Black (NHB) women. We investigated normal and breast cancer tissue microbiota from NHB and non-Hispanic White (NHW) women to identify distinct microbial signatures by race, stage, or tumor subtype. Using 16S rRNA gene sequencing, we observed that phylum Proteobacteria was most abundant in normal (n = 8), normal adjacent to tumor (normal pairs, n = 11), and breast tumors from NHB and NHW women (n = 64), with fewer Firmicutes, Bacteroidetes, and Actinobacteria. Breast tissues from NHB women had a higher abundance of genus Ralstonia compared to NHW tumors, which could explain a portion of the breast cancer racial disparities. Analysis of tumor subtype revealed enrichment of family Streptococcaceae in TNBC. A higher abundance of genus Bosea (phylum Proteobacteria) increased with stage. This is the first study to identify racial differences in the breast tissue microbiota between NHB and NHW women. Further studies on the breast cancer microbiome are necessary to help us understand risk, underlying mechanisms, and identify potential microbial targets.
Subject terms: Bacterial genetics, Breast cancer
Introduction
Breast cancer is the most common cancer in women worldwide1. In the United States, more than 200,000 new breast cancer cases will be diagnosed this year alone2. Of these women, non-Hispanic black (NHB) women are more likely to die from breast cancer compared to other racial/ethnic groups3. Additionally, NHB women are more likely to be diagnosed with an aggressive form of breast cancer, known as triple negative breast cancer (TNBC) that does not respond to hormonal breast cancer therapies4,5.
The cause for the racial disparities in breast cancer risk and outcomes observed between NHB and NHW women is unclear; however, mounting evidence suggests that an imbalance in the collective genome of microorganisms, referred to as microbial dysbiosis, may be associated with the development of human diseases including cancer6–8. More recently, breast tissues have been observed to have their own unique microbiome that is distinct between pathologically defined normal, benign, and malignant breast tissues6,9–11. However, these studies did not include NHB women in their analysis.
In the present study, we defined unique microbial signatures in normal breast and breast tumor with paired normal adjacent breast tissue samples obtained from NHB and NHW women using 16S rRNA gene sequencing for the first time. This study highlights that disease state, tumor subtype, race, and stage of breast cancer display an altered microbiome and should be measured in all breast cancer studies to better understand how microbial dysbiosis influences breast cancer development and outcomes in ethnically diverse populations and if biomarkers can be identified to stratify risk or response to treatment.
Results
Patient demographic and breast tissue characteristics
We analyzed a total of 83 breast tissue samples, of which pathologically adjacent normal breast tissues (normal pair) were obtained from 11 breast cancer patients (Supplementary Table 1). Table 1 presents the selected demographic and tissue characteristics of patients’ breast tissue samples. A total of 64 breast cancer tissues were collected from women with stage I-IV breast cancer (tumor) and 8 from women who underwent breast reduction mammoplasty (normal). Approximately 24% of the study participants were NHB, 75% NHW, and 64% were premenopausal. The mean age of breast cancer patients in this study was significantly higher than healthy controls (47 ± 1.24 versus 30 ± 3.86, p < 0.0001). A total of 13 stage 1, 24 stage II, and 19 stage III and IV breast cancer tissues were analyzed in this study. We combined stages III and IV breast tumors together due to low number of stage IV breast tumors. Staging information was unavailable for 8 breast cancer tissue specimens. We also analyzed breast cancer tissues by the 4 major breast tumor subtypes: luminal A, luminal B, human epidermal growth factor receptor 2 (HER2), and TNBC12,13. Of the breast cancer tissues, 34% were Luminal A, 22% Luminal B, 9% HER2, and 23% TNBC. Tumor receptor status was not available for 7 of the breast cancer tissue specimens.
Table 1.
Patient breast tissue characteristics.
| Variable | Total patients (n = 72) | Normal (n = 8) | aTumor (n = 64) |
|---|---|---|---|
| Mean Age, years | |||
| Average (range) | 45 (18–72) | 30 (18–52) | 47 (25–72) |
| Ethnicity | |||
| NHB | 17 | 5 | 12 |
| NHW | 54 | 3 | 51 |
| Missing | 1 | 0 | 1 |
| Menopausal Status | |||
| Premenopausal | 46 | 7 | 39 |
| Postmenopausal | 24 | 1 | 23 |
| Missing | 2 | 0 | 2 |
| Stage | |||
| 1 | NA | NA | 13 |
| 2 | NA | NA | 24 |
| 3/4 | NA | NA | 19 |
| Missing | NA | NA | 8 |
| Tumor Subtype | |||
| Luminal A | NA | NA | 22 |
| Luminal B | NA | NA | 14 |
| HER2 | NA | NA | 6 |
| TNBC | NA | NA | 15 |
| Missing | NA | NA | 7 |
aThe total number of tissue samples used in this study (n = 83) also includes adjacent normal breast tissue samples, labeled normal pairs (n = 11) from the same breast cancer patient.
Abbreviations: NHB: Non-Hispanic Blacks; NHW: Non-Hispanic Whites; TNBC: triple negative breast cancer; NA: not applicable; SD: standard deviation.
Breast tissue microbiome characteristics in normal and breast tumor tissues
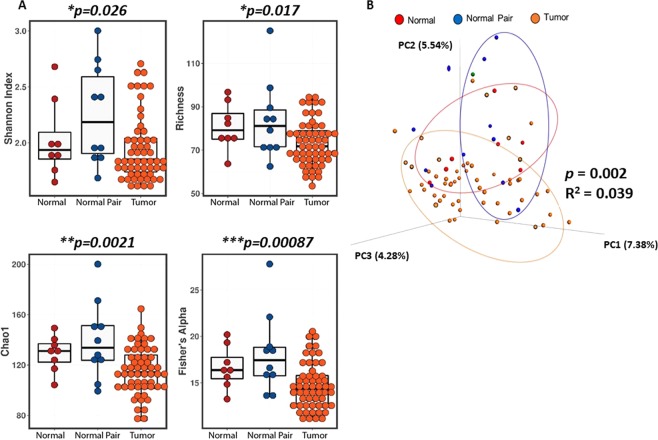
The Shannon index between normal, normal pair, and tumor disease states was significantly different, p = 0.026 (Fig. 1A). Additionally, normal and normal pair breast tissues had significantly higher alpha diversity as assessed by Richness (p = 0.017), Chao1 (p = 0.0021), and Fisher’s alpha (p = 0.00087) metrics, compared with breast tumor tissue (Fig. 1A). To determine differences in beta diversity, we visualized the overall differences between the microbiome profiles of the three groups using Principal Coordinate Analysis (PCoA) of unweighted UniFrac distances (Fig. 1B). We observed that normal samples clustered significantly different than tumor samples (Adonis: R2 = 0.039, p = 0.002, 999 permutations). Normal and adjacent normal tissue samples displayed greater dissimilarity along PC2 (5.54%) compared with breast tumor tissues. Supplementary Table 2 further illustrates differences in alpha and beta diversity and analysis of similarities (ANOSIM) between two comparison groups.
Figure 1.
Microbial diversity exists between normal breast tissue, tumor and adjacent normal breast. (A) Bar graphs compare the alpha-diversity (Shannon diversity), Richness, Chao1, and Fisher’s alpha measures of read counts between normal (n = 8), normal pair (n = 11), and tumor (n = 64) tissue sample types (Shannon index, P = 0.026; Richness, P = 0.07; Chao, P = 0.0021; Fisher’s alpha, P = 0.00087). (B) Principal coordinates (PCs) plots show the clustering pattern of the three groups based on unweighted UniFrac distance and is colored by sample types (red circles - normal, blue circles - normal pair, orange circles – tumor samples); P = 0.002 and R2 = 0.039.
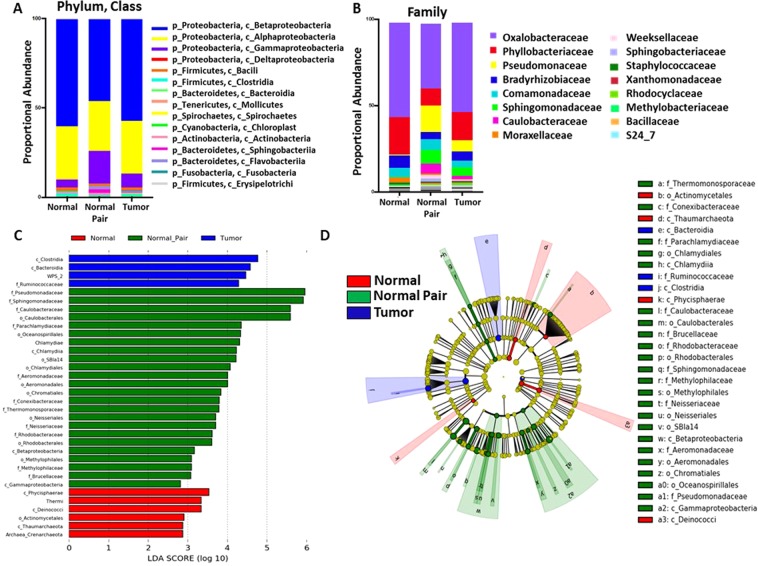
The microbial composition between normal, normal pair, and tumor tissues differed at the phylum, class, and family levels (Fig. 2A,B). At the phylum level, Proteobacteria (classes Betaproteobacteria, Alphaproteobacteria, and Gammaproteobacteria) dominated in the breast, followed by Firmicutes, Bacteroidetes and Actinobacteria, in that order (Fig. 2A). At the family level, Oxalobacteraceae in phylum Proteobacteria, dominated in normal, normal pair, and tumor tissues. Additionally, the relative abundance of family Pseudomonadaceae (phylum Proteobacteria), a microorganism implicated in antibiotic resistance14, was higher in normal pair and tumor breast tissues as compared to normal tissues (Fig. 2B). To further evaluate microbiome differences between normal, normal pair, and tumor breast tissues, Linear discriminant analysis Effect Size (LEfSe) analysis was used to discover different compositions of microbiota and to identify significant cancer-associated biomarkers (Fig. 2C,D). Class Clostridia, Bacteroidia, WPS_2, and family Ruminococcaceae was most abundant in tumor samples (Linear Discriminant Analysis (LDA > 4) while families specific to phylum Proteobacteria: Pseudomonadaceae, Sphingomonadaceae, and Caulobacteraceae (LDA > 5) was abundant in normal pairs (LDA > 5) (Fig. 2C,D).
Figure 2.
Breast microbiota are distinct between normal, normal pair, and tumor breast tissues. (A) Taxonomic profiles of normal (n = 8), normal pair (n = 11), and breast tumor tissue (n = 64) microbiota at phylum level and (B) family level for taxa with a relative abundance >0.5% are shown. (C) Linear Discriminate Analysis (LDA) scores predict microbiota associated with normal (n = 8), normal pair (n = 11), and breast tumor tissue (n = 64) microbiomes. (D) Circular cladogram of differentially abundant taxa increased in normal (n = 8), normal pair (n = 11), and breast tumor (n = 64) tissues. Each letter in concentric ring of nodes represents a taxonomic rank by either class, order, or family. Black arrows indicate taxa identified as significantly increased in normal tissues as compared to breast tumors.
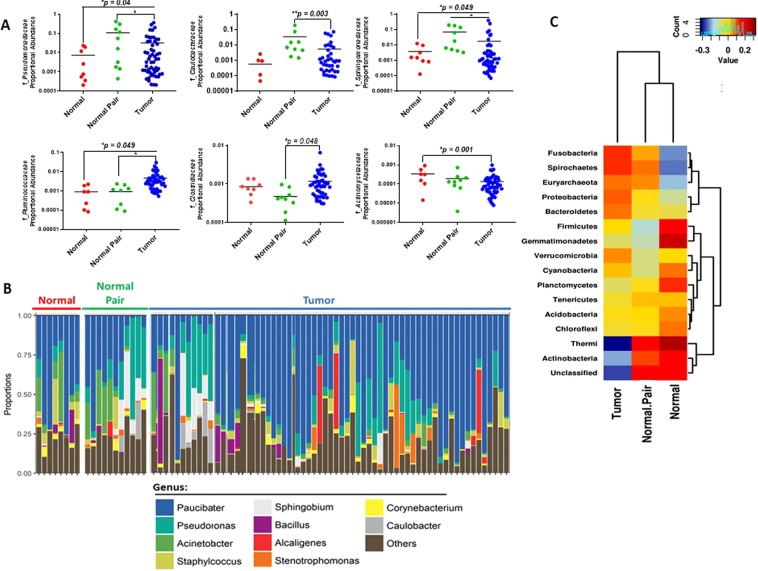
We further examined inter-individual differences in abundance of microbiota in normal, normal pair, and tumor breast tissues at the family (Fig. 3A) and genus level (Fig. 3B). At the family level, Pseudomonadaceae (phylum Proteobacteria), Sphingomonadaceae (phylum Bacteroidetes), and Ruminococcaceae (phylum Firmicutes) was significantly lower in normal tissues as compared to tumor tissues whereas Actinomycetaceae (phylum Actinobacteria) was significantly higher in normal breast tissues (Fig. 3A). By contrast, the relative abundance of family Ruminococcaceae and Clostridia (phylum Firmicutes) was significantly lower in normal pair tissues as compared to breast tumor tissues. Inter-individual differences in relative abundance of bacteria was also evident at the genus level between normal, including normal pairs, and breast tumor tissues (Fig. 3B). We further generated a Spearman heatmap to visualize all phyla levels across normal, normal pair and tumors (Fig. 3C). This analysis demonstrated fewer Thermi and Actinobacteria and elevated Fusobacteria and Spirochetes in tumor tissues than in non-tumor tissue samples.
Figure 3.
Proportional abundances of microbiota families differ between normal and breast tumor tissues. (A) Individual differences in proportional abundances of the most significantly altered microbial families between normal (n = 8), normal pair (n = 11), and breast tumor (n = 64) tissues. Shown are scatter plots of the mean +/− standard error measurement. A p < 0.05 is considered statistically significant. (B) Bar plots illustrating the relative abundances of genus level microbiota in normal (n = 8), normal pair (n = 11), and breast tumor (n = 64) tissues. (C) Spearman heatmap illustrating levels of phyla in breast tumors by tissue type. Blue color represents rare or absent phyla while red color represents abundant phyla. Hierarchical clustering of phyla and sample types are displayed as dendrograms.
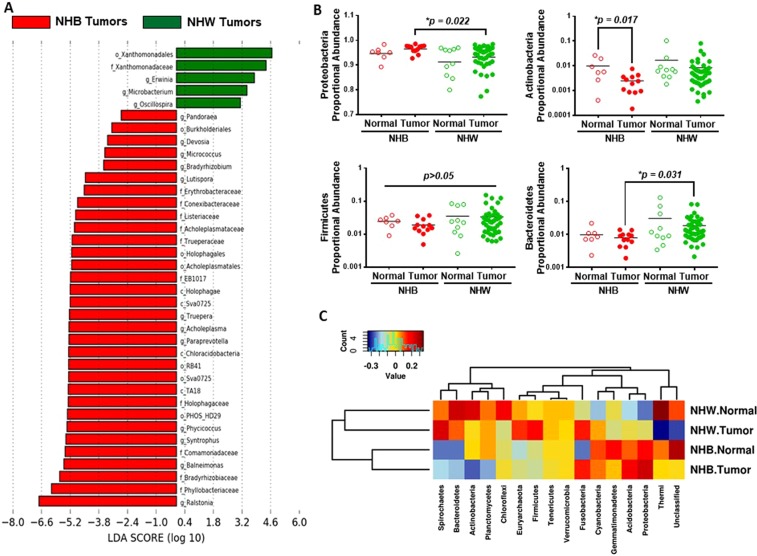
We next stratified normal and tumor samples to assess microbial differences between NHB and NHW women (Fig. 4). The differences in the quantity of bacteria at the order, family, and genus level between NHB and NHW breast tumors are shown in Fig. 4A. Family Xanthomonadaceae (LDA > 4) was most abundant in breast tumors of NHW women, whereas genus Ralstonia (both phylum Proteobacteria) was most abundant in breast tumors of NHB women (Fig. 4A). We also observed significant inter-individual differences in relative abundance of phylum Actinobacteria among breast tumors of NHB women as compared to normal breast tissues from NHB women (Fig. 4B). Phylum Bacteroidetes was significantly lower among NHB breast tumors as compared to NHW breast tumors (Fig. 4B). Finally, a Spearman heatmap illustrated the relative abundance of phyla among normal and breast tumors of NHB women compared to NHW women (Fig. 4C).
Figure 4.
Proportional abundances of breast microbiota differ by race. (A) LDA scores were computed for the most differential microbiota abundance between breast tumors by race. (B) Scatter plots illustrating the proportional abundance of the four major phyla (Proteobacteria, Actinobacteria, Firmicutes, and Bacteroidetes) between normal (n = 19, including normal pairs) and breast tumor (n = 64) tissues of AA (and EA women. A p < 0.05 is considered statistically significant. (C) Spearman heatmap illustrating levels of phyla in breast tumors between NHB and NHW women. Blue color represents rare or absent phyla while red color represents abundant phyla. Hierarchical clustering of phyla and sample types are displayed as dendrograms.
TNBC tumors are more abundant in Firmicutes compared to other breast tumor subtypes
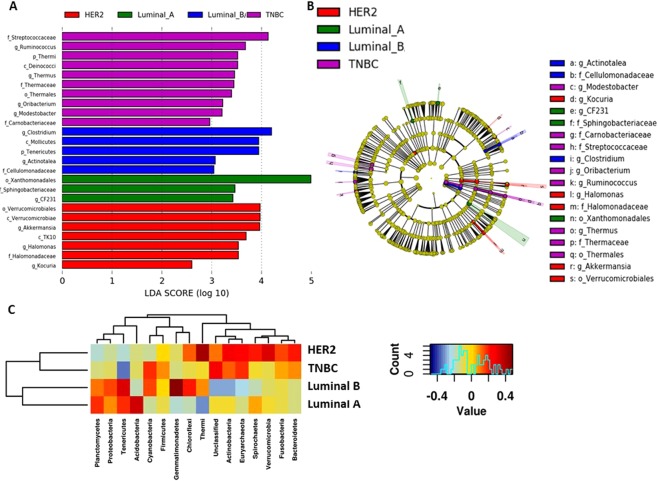
In order to determine if microbial differences exist between the four major breast tumor subtypes, LEfSe analysis was used to discover different compositions of microbiota and identify significant breast tumor subtype-associated biomarkers (Fig. 5). TNBC was more abundant in genus Streptococcaceae, and Ruminococcus (both phylum Firmicutes) (LDA > 3.5) (Fig. 5A,B). Luminal B tumors were most abundant in genus Clostridium (phylum Firmicutes). Luminal A tumors were most abundant in order Xanthomonadales (phylum Proteobacteria) (LDA > 5). HER2 tumors were abundant in genus Akkermasia (phylum Verrucomicrobia) (LDA = 4). A Spearman heatmap demonstrated phyla level changes across HER2, luminal A, luminal B, and TNBC tumor subtypes (Fig. 5C), where luminal subtypes demonstrated greater Tenericutes, Proteobacteria, and Planctomycetes phyla. HER2 breast tumors demonstrated greatest abundance of phyla Thermi and Verrucomicrobia while TNBC tumors demonstrated the highest total abundance of phyla Euryarchaeota, Cyanobacteria, and Firmicutes.
Figure 5.
Breast tumor subtypes reveal microbial differences. (A) LDA scores were computed for abundance between breast tumor subtypes. (B) Circular cladogram reporting taxa consistently differential among the different breast tumor subtypes detected using LEfSe. Colors indicate the group and letters represent the taxa in which each differential clade was most abundant. A p < 0.05 is considered statistically significant. (C) Spearman heatmap illustrating levels of phyla in breast tumors by subtype. Blue color represents rare or absent phyla while red color represents abundant phyla. Hierarchical clustering of phyla and sample types are displayed as dendrograms.
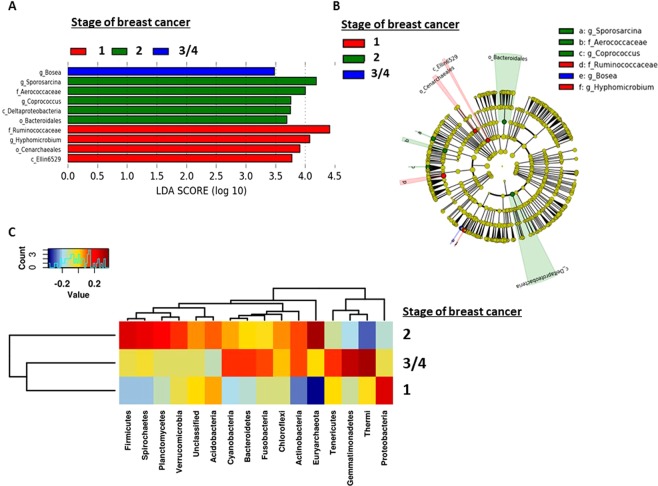
Lastly, we determined the extent to which microbiota may be associated with stage of breast cancer (Fig. 6). Family Ruminococcaceae (phylum Firmicutes), and genus Hyphomicrobium (phylum Proteobacteria) were abundant in stage 1 breast tumors (Fig. 6A,B). Stage 2 breast tumors contained increased genus Sporosarcina (phylum Firmicutes). Stage 3 and 4 breast tumors showed abundance of only genus Bosea (phylum Proteobacteria) (Fig. 6A,B). At the phylum level, Spearman heatmap demonstrated elevated Proteobacteria in stage 1; Euryarchaeota, Firmicutes, and Spirochaetes in stage 2, and elevated Thermi, Gemmatimonadetes, and Tenericutes in stage 3/4 (Fig. 6C). Phylogenetic Investigation of Communities by Reconstruction of Unobserved States (PICRUSt) analysis revealed enrichment in photosynthesis proteins in stages 3 and 4 tumors while stage 1 tumors were enriched in energy metabolism, fat digestion and absorption and stage 2 tumors are enriched in phosphotransferase system proteins (Supplementary Fig. S1). These findings suggest that abundance and composition of certain microbiota may be associated with breast tumor subtype and stage of breast cancer.
Figure 6.
Breast microbiota are different by stage of breast cancer. (A) LDA scores were computed for abundance between stages of breast cancer. (B) Circular cladogram reporting taxa consistently differential among the different stages of breast cancer detected using LEfSe. Colors indicate the group and letters represent the taxa in which each differential clade was most abundant. A p < 0.05 is considered statistically significant. (C) Spearman heatmaps illustrating levels of phyla in breast tumors by stage. Blue color represents rare or absent phyla while red color represents abundant phyla. Hierarchical clustering of phyla and sample types are displayed as dendrograms.
Discussion
It is well documented that NHB women are more likely to be diagnosed with TNBC and are most likely to die from breast cancer compared to all other ethnic groups2,4,12,15,16. However, NHB women are underrepresented in breast cancer research studies17,18, including studies investigating the breast microbiome. Our study is the first to show differences in the breast tissue microbiota between NHB and NHW women. Specifically, we observed that NHB tumors were most enriched in genus Ralstonia while NHW tumors were most enriched in order Xanthomonadales, both belong to phylum Proteobacteria. Constantini et al. were the first to observe the presence of Ralstonia in core needle biopsy breast tissue19. There has also been a correlation between the presence of Ralstonia and most cancer types, including breast cancer20. Thus, it is plausible that enrichment of Ralstonia could be a marker of carcinogenesis.
Within the last five years, a wealth of knowledge has been gained from studies examining microbial dysbiosis in breast tissues of women with and without breast cancer6,9,10,19,21–25. One of the first published studies on the microbiota of breast cancer tissues was by Xuan et al. who identified an association between microbial dysbiosis and breast cancer using next-generation sequencing on DNA isolated from breast tumor tissue and paired normal adjacent tissue from the same patient21. Likewise, Hieken et al. reported differentially abundant taxa from the phyla Firmicutes, Actinobacteria, Bacteroidetes, and Proteobacteria in breast and skin tissues9. Using 16S rRNA sequencing on DNA isolated from breast tissues of women of European descent with and without breast cancer, Urbaniak et al. reported that Bacillus, Staphylococcus, Enterobacteriaceae (unclassified), Comamonadaceae (unclassified), and Bacteroidetes (unclassified) was most abundant in Canadian and Irish breast cancer patients10,22. Similar findings have been observed in tumors and paired normal tissues obtained from Mediterranean women19 and Chinese women6. The largest breast cancer microbiome study to date was from The Cancer Genome Atlas (TCGA) where RNA sequencing was used to comprehensively analyze the microbiome of 668 breast tumor tissues and 72 non-cancerous adjacent tissues25. Unfortunately, these investigations lack inclusion of women of primarily African descent.
Another major finding from our study was the identification of distinct microbiota associated with tumor subtypes and early stage versus advanced stages of breast cancer. Specifically, we observed that TNBC tissues was abundant in family Streptococcaceae (LDA > 4). Hermansson et al. identified an increased abundance of Streptococcaceae in breast milk but the authors caution that Streptococcaceae may have originated from the maternal skin or even the environment26. Another study found a strong association between OTUs in Streptococcaceae and obesity in approximately 600 American adults27. Collectively, these findings suggest that Streptococcaceae may be associated with increased TNBC risk in obese women. However, to date, only one study described a distinct microbial profile specific for TNBC23. In that study, Banerjee et al. screened 100 formalin-fixed paraffin embedded archival TNBC samples using a pan-pathogen array chip technology to identify select microbes in TNBC FFPE archival tissues23. In contrast to our findings, they detected Prevotella at the highest level in TNBC. The discrepancy in enrichment of bacteria in TNBC identified in our study and that of Banerjee et al. may be due to the lack of bacterial probes to detect Streptococcus bacteria, potential bacterial contamination due to retrospective collection of non-sterile FFPE archival breast tissues, different racial composition, and regional/dietary differences not accounted for.
In addition to breast tumor subtype, we found that stage 1 breast tumors were abundant in all four major phyla whereas stage 2 breast tumors appeared to be less diverse, and stages 3 and 4 breast tumors were abundant in only one bacteria genus: Bosea, which belongs to phylum Proteobacteria. Unfortunately, little is known regarding the role of Bosea in human disease. However, Heiken et al. also observed that malignancy correlated with abundant in taxa of lower abundance including the genera Fusobacterium, Atopobium, Gluconacetobacter, Hydrogenophaga and Lactobacillus that are members of the phyla Fusobacteria, Actinobacteria, Proteobacteria, and Firmicutes, respectively9. By contrast, Meng et al. found that the relative abundance of genus Agrococcus, which belongs to phylum Actinobacteria, increased with the development of malignancy6. Further studies are warranted to determine whether these microbiome signatures can be used as potential biomarkers for predicting tumor subtype, stage of breast cancer and disease progression.
Although a limitation of our study is the small sample size and limited demographic data on obesity status and dietary consumption, which are known to influence the gut microbiota and disease development28,29, we were able to identify distinct differences in the microbiota by race, tumor subtype, stage of breast cancer, and disease status. We further validated the presence of the four major breast tissue phyla in our study using 16S rRNA gene sequencing.
In an attempt to reproduce microbiome studies, efforts must be made to preserve the integrity and minimize contamination of surgical breast tissue specimens by immediately snap freezing the tissue in liquid nitrogen and storing long-term at −80 °C to limit exposure to the environment since microbial characteristics can change rapidly with environmental conditions6,30. Additionally, protocols need to be standardized and appropriate cross-protocol controls, including DNA extraction reagents, should be included to identify differences in environment-specific contamination, nucleotide extraction, and bioinformatic classification31. Collectively, our findings highlight that disease state, tumor subtype, race, and stage of breast cancer display an altered microbiome and should be measured in all breast cancer studies using shotgun metagenomics to reveal deeper characterization and identification of a larger number of microbial species32.
In conclusion, progress has been made to support the existence of a breast tissue microbiome. Yet, we have only begun to scratch the surface on to what extent microbial dysbiosis may be linked to breast cancer risk. Further research is needed to understand how microbial dysbiosis influences breast cancer development and treatment outcomes, particularly among ethnically diverse populations who suffer disproportionately from breast cancer health disparities.
Materials and Methods
Tissue collection and processing
Fresh, snap frozen aseptically obtained surgical breast tissue specimens from NHB and NHW women (ages 18 to 90 years) with and without breast cancer and clinical information was obtained from the Cooperative Human Tissue Network (Birmingham, AL). Written informed consent was obtained from each participant prior to obtaining breast tissues from the Cooperative Human Tissue Network. Upon receipt, breast tissue samples (n = 83) were immediately stored and maintained at −80 °C until further processing. A total of 19 breast tissues were surgically obtained from NHB women, 62 total breast samples from NHW women, and race/ethnicity was unknown for 1 breast cancer patient who provided both a surgical breast cancer tissue sample and pathologically normal adjacent (normal pair) breast tissue sample. Women free of disease (Normal) underwent reduction mammoplasty for macromastia and their breast tissues were aseptically collected in the operating room. Breast cancer (Tumor) and adjacent normal breast tissue pairs (Normal Pair) from the same donor (n = 11) were also included in this study for comparison. The tissue immediately adjacent (up to 5 cm) to the collected breast cancer tissue sample was evaluated and confirmed by a pathologist to be histologically free of any tumor cells or lesions. Pathological data about the donor breast tissue specimen, including hormone receptor status and grade and stage of breast cancer was obtained from pathological reports. This study was conducted in accordance with the Declaration of Helsinki, and the protocol was approved by the Institutional Review Board of the University of Tennessee Health Science Center (IRB #16-04717-NHSR).
DNA extraction and 16s rRNA gene sequencing
DNA was isolated from breast tissues under a sterile lamina flow hood using the Qiagen DNA Isolation kit (Qiagen) and quantified by Nanodrop and Quant-iT PicoGreen dsDNA Assay Kit (Invitrogen). Blank controls were used for quality control. DNA was placed into a MoBio PowerMag Soil DNA Isolation Bead Plate. DNA was extracted following MoBio’s instructions on a KingFisher robot. Bacterial 16S sequencing was performed by Microbiome Insights, Vancouver, Canada. Bacterial 16S rRNA genes were PCR-amplified with dual-barcoded primers targeting the V4 region, as per the protocol of Kozich et al. (2013). Amplicons were sequenced with an Illumina MiSeq using the 250-bp paired-end kit (v.2). Sequences were denoised, taxonomically classified using Greengenes (v13_8) as the reference database, and clustered into 97%-similarity operational taxonomic units (OTUs) with QIIME (Quantitative Insights into Microbial Ecology) 1.9.1. The potential for contamination was addressed by co-sequencing DNA amplified from specimens and from four each of template-free controls and DNA extraction kit reagents processed the same way as the specimens. Two positive controls, consisting of cloned SUP05 DNA, were also included (number of copies = 2*10^6). Operational taxonomic units were considered putative contaminants (and were removed) if their mean abundance in controls reached or exceeded 25% of their mean abundance in specimens.
16S statistical analysis
Following filtering, samples were rarified to a depth of 4000 sequences. Principal Coordinate (PC) analyses were based on unweighted UniFrac distances using even OTU samples, and were generated in EMPeror33. Variation in community structure was assessed with permutational multivariate analysis of variance using distance matrices (ADONIS) with treatment group as the main fixed factor and using 999 permutations for significance testing. We used linear discriminant analysis of effect size (LEfSe) to test for significance and perform high-dimensional biomarker identification34. Raw OTU tables were imported into Calypso 8.84 for further analysis, including alpha diversity and Spearman heatmaps35. Alpha diversity and richness were estimated with the Shannon index, Chao1 (estimator of abundance), Fisher’s alpha, and Richness metrics. Spearman’s heatmaps were calculated based on phyla level abundances with sample and taxa clustering displayed with dendrograms. The significance of diversity differences was tested with one-way ANOVA. The calculation of P-values was done with Mann Whitney t-test.
Supplementary information
Acknowledgements
This research was supported by the University of Tennessee Health Science Center CORNET Cancer Award, Methodist Mission and Center for Integrative and Translational Genomics to AS-D and sequencing support by Microbiome Insights, Vancouver, Canada.
Author Contributions
A.S.-D. designed research; A.S. and J.F.P. conducted research; A.S.-D. and J.F.P. analyzed data; A.S.-D. wrote the paper; A.S.-D., J.F.P., G.V., B.L.-C. and L.M. revised critically for content; A.S.-D. had primary responsibility for final content. All authors reviewed and approved the final manuscript.
Data Availability
Raw microbiome data analyzed for the current study is provided in supplementary files.
Competing Interests
The authors declare no competing interests.
Footnotes
Publisher’s note: Springer Nature remains neutral with regard to jurisdictional claims in published maps and institutional affiliations.
Alana Smith and Joseph F. Pierre contributed equally.
Supplementary information
Supplementary information accompanies this paper at 10.1038/s41598-019-48348-1.
References
- 1.Bray F, et al. Global cancer statistics 2018: GLOBOCAN estimates of incidence and mortality worldwide for 36 cancers in 185 countries. CA: a cancer journal for clinicians. 2018;68:394–424. doi: 10.3322/caac.21492. [DOI] [PubMed] [Google Scholar]
- 2.DeSantis CE, Ma J, Goding Sauer A, Newman LA, Jemal A. Breast cancer statistics, 2017, racial disparity in mortality by state. CA: a cancer journal for clinicians. 2017;67:439–448. doi: 10.3322/caac.21412. [DOI] [PubMed] [Google Scholar]
- 3.DeSantis CE, et al. Breast cancer statistics, 2015: Convergence of incidence rates between black and white women. CA: a cancer journal for clinicians. 2016;66:31–42. doi: 10.3322/caac.21320. [DOI] [PubMed] [Google Scholar]
- 4.Newman LA. Breast cancer disparities: high-risk breast cancer and African ancestry. Surgical oncology clinics of North America. 2014;23:579–592. doi: 10.1016/j.soc.2014.03.014. [DOI] [PubMed] [Google Scholar]
- 5.Newman LA, Kaljee LM. Health Disparities and Triple-Negative Breast Cancer in African American Women: A Review. JAMA surgery. 2017;152:485–493. doi: 10.1001/jamasurg.2017.0005. [DOI] [PubMed] [Google Scholar]
- 6.Meng S, et al. Study of Microbiomes in Aseptically Collected Samples of Human Breast Tissue Using Needle Biopsy and the Potential Role of in situ Tissue Microbiomes for Promoting Malignancy. Frontiers in oncology. 2018;8:318. doi: 10.3389/fonc.2018.00318. [DOI] [PMC free article] [PubMed] [Google Scholar]
- 7.Chen J, Domingue JC, Sears CL. Microbiota dysbiosis in select human cancers: Evidence of association and causality. Seminars in immunology. 2017;32:25–34. doi: 10.1016/j.smim.2017.08.001. [DOI] [PMC free article] [PubMed] [Google Scholar]
- 8.Tsilimigras MC, Fodor A, Jobin C. Carcinogenesis and therapeutics: the microbiota perspective. Nature microbiology. 2017;2:17008. doi: 10.1038/nmicrobiol.2017.8. [DOI] [PMC free article] [PubMed] [Google Scholar]
- 9.Hieken TJ, et al. The Microbiome of Aseptically Collected Human Breast Tissue in Benign and Malignant Disease. Scientific reports. 2016;6:30751. doi: 10.1038/srep30751. [DOI] [PMC free article] [PubMed] [Google Scholar]
- 10.Urbaniak C, et al. The Microbiota of Breast Tissue and Its Association with Breast Cancer. Applied and environmental microbiology. 2016;82:5039–5048. doi: 10.1128/AEM.01235-16. [DOI] [PMC free article] [PubMed] [Google Scholar]
- 11.Wang H, et al. Breast tissue, oral and urinary microbiomes in breast cancer. Oncotarget. 2017;8:88122–88138. doi: 10.18632/oncotarget.21490. [DOI] [PMC free article] [PubMed] [Google Scholar]
- 12.Vidal G, Bursac Z, Miranda-Carboni G, White-Means S, Starlard-Davenport A. Racial disparities in survival outcomes by breast tumor subtype among African American women in Memphis, Tennessee. Cancer medicine. 2017;6:1776–1786. doi: 10.1002/cam4.1117. [DOI] [PMC free article] [PubMed] [Google Scholar]
- 13.Howlader N, Cronin KA, Kurian AW, Andridge R. Differences in Breast Cancer Survival by Molecular Subtypes in the United States. Cancer epidemiology, biomarkers & prevention: a publication of the American Association for Cancer Research, cosponsored by the American Society of Preventive Oncology. 2018;27:619–626. doi: 10.1158/1055-9965.EPI-17-0627. [DOI] [PubMed] [Google Scholar]
- 14.Pang Z, Raudonis R, Glick BR, Lin TJ, Cheng Z. Antibiotic resistance in Pseudomonas aeruginosa: mechanisms and alternative therapeutic strategies. Biotechnol Adv. 2019;37:177–192. doi: 10.1016/j.biotechadv.2018.11.013. [DOI] [PubMed] [Google Scholar]
- 15.Jemal A, et al. Factors That Contributed to Black-White Disparities in Survival Among Nonelderly Women With Breast Cancer Between 2004 and 2013. Journal of clinical oncology: official journal of the American Society of Clinical Oncology. 2018;36:14–24. doi: 10.1200/JCO.2017.73.7932. [DOI] [PubMed] [Google Scholar]
- 16.Sineshaw HM, et al. Association of race/ethnicity, socioeconomic status, and breast cancer subtypes in the National Cancer Data Base (2010-2011) Breast cancer research and treatment. 2014;145:753–763. doi: 10.1007/s10549-014-2976-9. [DOI] [PubMed] [Google Scholar]
- 17.Radecki Breitkopf C, et al. Linking Education to Action: A Program to Increase Research Participation Among African American Women. Journal of women’s health. 2018;27:1242–1249. doi: 10.1089/jwh.2017.6791. [DOI] [PMC free article] [PubMed] [Google Scholar]
- 18.Smith Alana, Vidal Gregory, Pritchard Elizabeth, Blue Ryan, Martin Michelle, Rice LaShanta, Brown Gwendolynn, Starlard-Davenport Athena. Sistas Taking a Stand for Breast Cancer Research (STAR) Study: A Community-Based Participatory Genetic Research Study to Enhance Participation and Breast Cancer Equity among African American Women in Memphis, TN. International Journal of Environmental Research and Public Health. 2018;15(12):2899. doi: 10.3390/ijerph15122899. [DOI] [PMC free article] [PubMed] [Google Scholar]
- 19.Costantini L, et al. Characterization of human breast tissue microbiota from core needle biopsies through the analysis of multi hypervariable 16S-rRNA gene regions. Scientific reports. 2018;8:16893. doi: 10.1038/s41598-018-35329-z. [DOI] [PMC free article] [PubMed] [Google Scholar]
- 20.Robinson KM, Crabtree J, Mattick JS, Anderson KE, Dunning Hotopp JC. Distinguishing potential bacteria-tumor associations from contamination in a secondary data analysis of public cancer genome sequence data. Microbiome. 2017;5:9. doi: 10.1186/s40168-016-0224-8. [DOI] [PMC free article] [PubMed] [Google Scholar]
- 21.Xuan C, et al. Microbial dysbiosis is associated with human breast cancer. PloS one. 2014;9:e83744. doi: 10.1371/journal.pone.0083744. [DOI] [PMC free article] [PubMed] [Google Scholar]
- 22.Urbaniak C, et al. Microbiota of human breast tissue. Applied and environmental microbiology. 2014;80:3007–3014. doi: 10.1128/AEM.00242-14. [DOI] [PMC free article] [PubMed] [Google Scholar]
- 23.Banerjee S, et al. Distinct microbiological signatures associated with triple negative breast cancer. Scientific reports. 2015;5:15162. doi: 10.1038/srep15162. [DOI] [PMC free article] [PubMed] [Google Scholar]
- 24.Chan AA, et al. Characterization of the microbiome of nipple aspirate fluid of breast cancer survivors. Scientific reports. 2016;6:28061. doi: 10.1038/srep28061. [DOI] [PMC free article] [PubMed] [Google Scholar]
- 25.Thompson KJ, et al. A comprehensive analysis of breast cancer microbiota and host gene expression. PloS one. 2017;12:e0188873. doi: 10.1371/journal.pone.0188873. [DOI] [PMC free article] [PubMed] [Google Scholar]
- 26.Hermansson H, et al. Breast Milk Microbiota Is Shaped by Mode of Delivery and Intrapartum Antibiotic Exposure. Front Nutr. 2019;6:4. doi: 10.3389/fnut.2019.00004. [DOI] [PMC free article] [PubMed] [Google Scholar]
- 27.Peters BA, et al. A taxonomic signature of obesity in a large study of American adults. Scientific reports. 2018;8:9749. doi: 10.1038/s41598-018-28126-1. [DOI] [PMC free article] [PubMed] [Google Scholar]
- 28.Lee CJ, Sears CL, Maruthur N. Gut microbiome and its role in obesity and insulin resistance. Annals of the New York Academy of Sciences. 2019 doi: 10.1111/nyas.14107. [DOI] [PubMed] [Google Scholar]
- 29.Toor Devinder, Wsson Mishi Kaushal, Kumar Prashant, Karthikeyan G., Kaushik Naveen Kumar, Goel Chhavi, Singh Sandhya, Kumar Anil, Prakash Hridayesh. Dysbiosis Disrupts Gut Immune Homeostasis and Promotes Gastric Diseases. International Journal of Molecular Sciences. 2019;20(10):2432. doi: 10.3390/ijms20102432. [DOI] [PMC free article] [PubMed] [Google Scholar]
- 30.Franzosa EA, et al. Relating the metatranscriptome and metagenome of the human gut. Proceedings of the National Academy of Sciences of the United States of America. 2014;111:E2329–2338. doi: 10.1073/pnas.1319284111. [DOI] [PMC free article] [PubMed] [Google Scholar]
- 31.Sinha R, et al. Next steps in studying the human microbiome and health in prospective studies, Bethesda, MD, May 16-17, 2017. Microbiome. 2018;6:210. doi: 10.1186/s40168-018-0596-z. [DOI] [PMC free article] [PubMed] [Google Scholar]
- 32.Laudadio I, et al. Quantitative Assessment of Shotgun Metagenomics and 16S rDNA Amplicon Sequencing in the Study of Human Gut Microbiome. OMICS. 2018;22:248–254. doi: 10.1089/omi.2018.0013. [DOI] [PubMed] [Google Scholar]
- 33.Vazquez-Baeza Y, Pirrung M, Gonzalez A, Knight R. EMPeror: a tool for visualizing high-throughput microbial community data. Gigascience. 2013;2:16. doi: 10.1186/2047-217X-2-16. [DOI] [PMC free article] [PubMed] [Google Scholar]
- 34.Segata N, et al. Metagenomic biomarker discovery and explanation. Genome biology. 2011;12:R60. doi: 10.1186/gb-2011-12-6-r60. [DOI] [PMC free article] [PubMed] [Google Scholar]
- 35.Zakrzewski M, et al. Calypso: a user-friendly web-server for mining and visualizing microbiome-environment interactions. Bioinformatics. 2017;33:782–783. doi: 10.1093/bioinformatics/btw725. [DOI] [PMC free article] [PubMed] [Google Scholar]
Associated Data
This section collects any data citations, data availability statements, or supplementary materials included in this article.
Supplementary Materials
Data Availability Statement
Raw microbiome data analyzed for the current study is provided in supplementary files.


