Abstract
Background
Adrenocortical adenomas (ACAs) can lead to the autonomous secretion of aldosterone responsible for primary aldosteronism (PA), which is the most common form of secondary arterial hypertension. However, the authentic fundamental mechanisms underlying ACAs remain unclear.
Objective
Isobaric tags for relative and absolute quantitation (iTRAQ)-based proteomics and bioinformatics analyses from etiological studies of ACAs were performed to screen the differentially expressed proteins (DEPs) and investigate the relevant mechanisms of their occurrence and development. Results could help determine therapeutic targets of clinical significance.
Methods
In the present study, iTRAQ-based proteomics was applied to analyze ACA tissue samples from normal adrenal cortex tissues adjacent to the tumor. Using proteins extracted from a panel of four pairs of ACA samples, we identified some upregulated proteins and other downregulated proteins in all four pairs of ACA samples compared with adjacent normal tissue. Subsequently, we predicted protein–protein interaction networks of three DEPs to determine the authentic functional factors in ACA.
Results
A total of 753 DEPs were identified, including 347 upregulated and 406 downregulated proteins. The expression of three upregulated proteins (E2F3, KRT6A, and ALDH1A2) was validated by Western blot in 24 ACA samples. Our data suggested that some DEPs might be important hallmarks during the development of ACA.
Conclusions
This study is the first proteomic research to investigate alterations in protein levels and affected pathways in ACA using the iTRAQ technique. Thus, this study not only provides a comprehensive dataset on overall protein changes but also sheds light on its potential molecular mechanism in human ACAs.
Electronic supplementary material
The online version of this article (10.1186/s12864-019-6030-5) contains supplementary material, which is available to authorized users.
Keywords: iTRAQ, Adrenocortical adenoma, Proteomics, Differentially expressed protein
Background
Primary aldosteronism (PA) is considered the most common cause of endocrine hypertension [1, 2]; it occurs in approximately 10–20% of hypertensive patients. Adrenocortical adenomas (ACAs) can lead to the autonomous secretion of aldosterone responsible for PA [3], which is the most frequent form of secondary arterial hypertension [4, 5]. Even though previous proteomic studies have already focused on differentially expressed proteins (DEPs) and made adequate progress in the understanding of the genetic bases of aldosterone- and cortisol-producing ACAs in the past few years [6–8], the authentic molecular mechanism and fundamental biological activities of DEPs underlying ACA remain ambiguous.
Additionally, quantitative proteomics, as an important methodology based on mass spectrometry, is widely used in the biological and clinical research of various diseases, such as the monitoring of specific disease biomarkers or the identification of functional modules and pathways [9–12]. Bioinformatic analysis of the dynamic transcriptome and expression regulation may guide future research on the mechanisms of ACA. Both isobaric tags for relative and absolute quantitation (iTRAQ) and label-free methods have been broadly applied for quantitative proteomics [13–16]. These techniques are compatible with high-throughput and high speed and can improve the reproducibility of prefractionation of complex peptide mixtures [17–19]. Nevertheless, proteomic studies about ACA are limited. Establishing differentially expressed protein–protein interaction (PPI) networks using bioinformatic data will lead to an improved understanding of the pathogenesis of ACA.
In this work, iTRAQ-based proteomic analysis was conducted based on the etiological study of adrenal adenoma to screen DEPs and explore the relevant mechanisms of its occurrence and development. Results of this study may be used to determine therapeutic targets of clinical significance, which might lay a theoretical foundation for the early diagnosis and effective treatment of adrenal adenoma.
Results
In this study, iTRAQ was used to assess proteome changes between adrenocortical adenoma tissue and adjacent normal adrenal cortex tissue. On the basis of data acquisition, 753 DEPs were identified: 347 upregulated and 9406 downregulated proteins.
Gene ontology (GO) analysis results
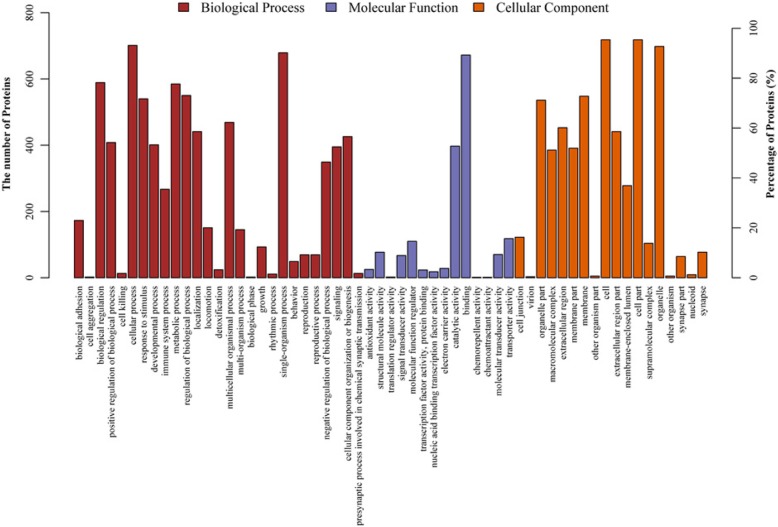
GO is a standardized functional classification system that provides a dynamically updated standardized vocabulary to describe the properties of genes and gene products in an organism from three perspectives: biological process, molecular function, and cell component [20] (Fig. 1).
Fig. 1.
Gene Ontology (GO) analysis of differentially expressed proteins in adrenocortical adenomas compared with control. GO analysis was performed according three terms: Molecular Functions, Biological Process and Cellular Component
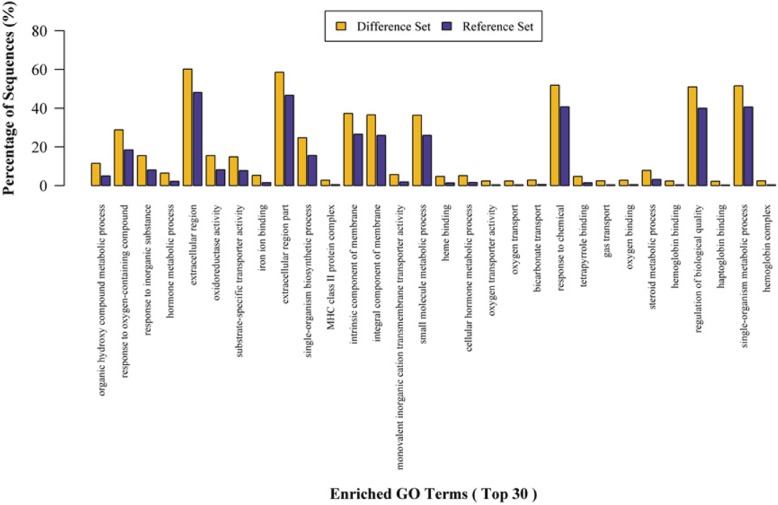
The GO annotation of target proteins can classify these involved proteins in terms of biological process, molecular function, and cellular component (Fig. 2). Although the proportion of each classification can reflect the impact of biological factors on each classification in the experimental design to a certain extent, evaluations on the significance of each classification depending on the ratio alone are inaccurate. Notably, the distributions of each classification should be considered in overall protein collection, such as all qualitative proteins in an experiment or all known proteins of the species.
Fig. 2.
GO enrichment analysis (Difference set: target protein set; Reference set: background protein set)
Among the 753 DEPs, 347 and 406 proteins were significantly upregulated and downregulated in ACA samples, respectively. The top 16 upregulated proteins included E2F3 protein (Table 1). Of the 16 proteins, keratin was the most upregulated protein, and its level was increased by 3.39-fold in ACA samples. Conversely, 406 proteins were significantly downregulated in ACA samples, and the top 16 downregulated proteins are listed in Table 2.
Table 1.
Top 16 increased expressed proteins in adrenal adenoma compared with normal tissue
| Accession | Gene Name | Description | A/B | P value |
|---|---|---|---|---|
| P04259 | KRT6B | Keratin, type II cytoskeletal 6B | 3.39341 | 3.45E-24 |
| P08263 | GSTA1 | Glutathione S-transferase A1 | 3.29119 | 4.50E-23 |
| Q499G5 | E2F3 | E2F3 protein | 2.93248 | 4.08E-19 |
| Q05315 | CLC | Galectin-10 | 2.85897 | 2.68E-18 |
| P61927 | RPL37 | 60S ribosomal protein L37 | 2.85584 | 2.90E-18 |
| P08779 | KRT16 | Keratin, type I cytoskeletal 16 | 2.81279 | 8.77E-18 |
| P04196 | HRG | Histidine-rich glycoprotein | 2.74085 | 5.56E-17 |
| A0A0E3DDZ3 | HLA-DPB1 | MHC class II antigen | 2.6654 | 3.87E-16 |
| Q8NFP4 | MDGA1 | MAM domain-containing glycosylphosphatidylinositol anchor protein 1 | 2.34899 | 1.30E-12 |
| P02741 | CRP | C-reactive protein | 2.25659 | 1.37E-11 |
| Q16772 | GSTA3 | Glutathione S-transferase A3 | 2.20795 | 4.70E-11 |
| B2R920 | cDNA, FLJ94170 | 2.11487 | 4.88E-10 | |
| F8TVR8 | HLA-DRB1 | MHC class II antigen | 2.11385 | 5.01E-10 |
| A7DWG6 | HLA-DRB1 | MHC class II antigen | 2.05556 | 2.14E-09 |
| Q3T906 | GNPTAB | N-acetylglucosamine-1-phosphotransferase subunits alpha/beta | 2.03206 | 3.83E-09 |
| A0A024RB62 | METTL1 | tRNA (guanine-N(7)-)-methyltransferase | 2.02347 | 4.73E-09 |
Table 2.
Top 16 decreased expressed proteins in adrenal adenoma compared with normal tissue
| Accession | Gene Name | Description | A/B | P value |
|---|---|---|---|---|
| Q9Y639 | NPTN | Neuroplastin | 0.789565 | 0.0499304 |
| I7GW38 | ND3 | NADH-ubiquinone oxidoreductase chain 3 | 0.789522 | 0.0498772 |
| Q9H993 | ARMT1 | Protein-glutamate O-methyltransferase | 0.789151 | 0.0494224 |
| Q8TDY4 | ASAP3 | Arf-GAP with SH3 domain, ANK repeat and PH domain-containing protein 3 | 0.788918 | 0.049138 |
| Q9NRG7 | SDR39U1 | Epimerase family protein SDR39U1 | 0.788899 | 0.0491147 |
| Q16851 | UGP2 | UTP--glucose-1-phosphate uridylyltransferase | 0.78888 | 0.0490915 |
| Q6UX07 | DHRS13 | Dehydrogenase/reductase SDR family member 13 | 0.788815 | 0.0490121 |
| Q02978 | SLC25A11 | Mitochondrial 2-oxoglutarate/ malate carrier protein | 0.788382 | 0.0484886 |
| A0A024QZ64 | ALDOC | Fructose-bisphosphate aldolase | 0.788057 | 0.048099 |
| H3BQQ1 | CMC2 | COX assembly mitochondrial protein 2 homolog | 0.787879 | 0.0478859 |
| P34949 | MPI | Mannose-6-phosphate isomerase | 0.787826 | 0.047823 |
| P22748 | CA4 | Carbonic anhydrase 4 | 0.787682 | 0.0476521 |
| Q9BTX3 | TMEM208 | Transmembrane protein 208 | 0.787579 | 0.0475292 |
| A0A0S2Z5N0 | BEND5 | BEN domain containing 5 isoform 1 | 0.787255 | 0.0471465 |
| F2YHL7 | APOBEC3F | Apolipoprotein B mRNA editing enzyme cytidine deaminase | 0.787215 | 0.0471 |
| Q49B96 | COX19 | Cytochrome c oxidase assembly protein COX19 | 0.786704 | 0.0465007 |
KEGG pathway analysis
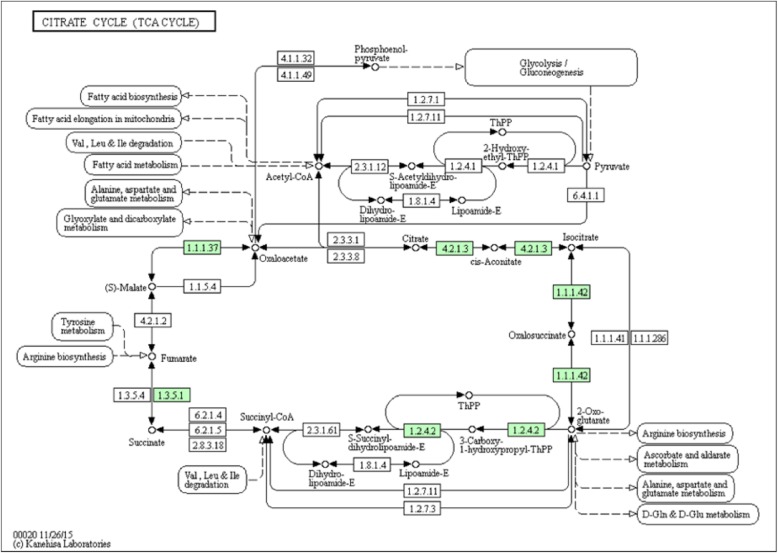
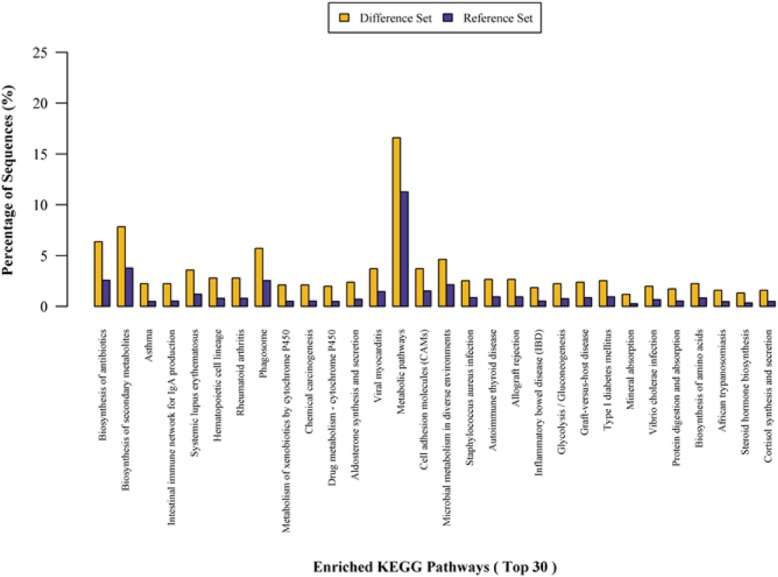
To obtain functional pathway information, we further analyzed the DEPs using the KEGG database. KEGG pathway analysis identified the signaling pathways of DEPs (Figs. 3 and 4).
Fig. 3.
KEGG pathway functional analysis (The numbers represent the ID of proteins in the KEGG pathway, and the green numbers indicate the ID of differentially expressed proteins)
Fig. 4.
KEGG pathway enrichment analysis (Difference set: target protein set; Reference set: background protein set)
PPI network of three DEPs
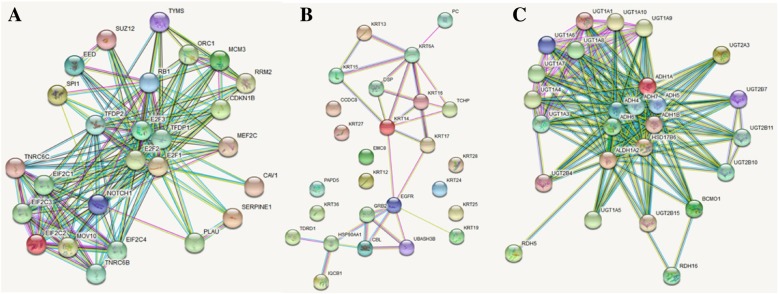
The interaction network of three DEPs between ACA samples and adjacent normal adrenal gland tissue was predicted using the String database (Fig. 5).
Fig. 5.
Protein-protein interaction (PPI) network based on the DEPs-. The round nodes indicate individual proteins. Regulations of protein abundance are shown as red (up-regulation) or green (down-regulation) circles. a PPI network based on the up-regulated DEP- E2F3. b PPI network based on the down-regulated DEP- KRT6A. c PPI network based on the up-regulated DEP- ALDH1A2
Verification of three DEPs by Western blot
We then validated the expression of E2F3, KRT6A, and ALDH1A2 in the abovementioned 24 ACA samples. Western blot analysis revealed that E2F3 and KRT6A expression increased in ACA samples compared with that in adjacent normal adrenal gland tissue (Fig. 6). By contrast, ALDH1A2 expression significantly decreased in ACA samples.
Fig. 6.
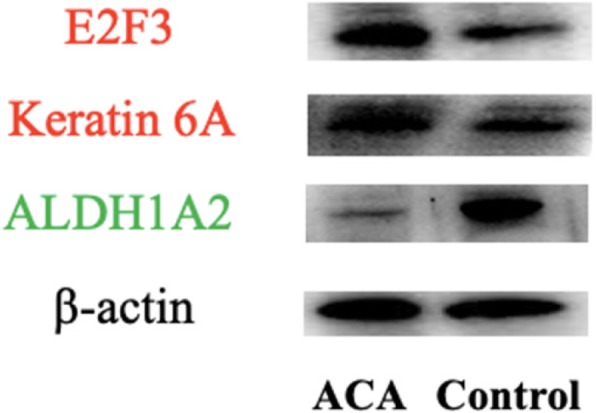
Representative characteristics of adrenocortical adenomas patients for Western blot validation. E2F3 and KRT6A expression increased in ACA samples compared with that in adjacent normal adrenal gland tissue. By contrast, ALDH1A2 expression significantly decreased in ACA samples
Discussion
iTRAQ is one of the most advanced technology in modern quantitative proteomics [21, 22]; it combines stable isotope labeling with tandem mass spectrometry [23–25] to compare the relative amount of proteins from normal and diseased samples in a single experiment. Wang WS et al. [26] revealed that myoferlin is a novel prognostic predictor in pancreatic adenocarcinoma through iTRAQ-based quantitative proteomics. In the present study, we used this method to detect protein expression changes in ACAs to identify DEPs that are critical for the molecular mechanism. In particular, we conducted GO and pathway analyses to explore the role of upregulated proteins in ACA progression. Selected DEPs (E2F3, KRT6A, and ALDH1A2) were validated by Western blot. This work will provide a valuable basis for further studies in the field of transformative medicine.
Transcription factor E2F3 is mainly involved in cell proliferation. It participates in transcription repression in quiescent cells by interacting with histone deacetylase and primarily controls genes regulating S phase entry and DNA synthesis. Some studies predicted that E2F3 transcription factor might be a promising biomarker in various cancer and metabolism diseases [27–29]. For instance, to predict overall survival and cause-specific survival in prostate cancer, E2F3 is considered a relatively independent factor [30]. Furthermore, E2F3a stimulates the proliferation of ovarian cancer cells through EGFR-driven mitogenic cell signals [31]. In lung cancer cells, miR-200b can target E2F3 to lessen cell sensitivity to docetaxel [32]. Martinez et al. [33] revealed that E2F3 is involved in DNA damage-induced apoptosis and can regulate the DNA damage response. Thus, E2F3 is a multifunctional factor that is worth further investigations.
Epidermis-specific type I keratin is generally involved in the activation of follicular keratinocytes after wounding, but it does not play a major role in keratinocyte proliferation or migration. Keratin 6A also participates in the regulation of epithelial migration by inhibiting the activity of SRC during wound repair [34]. Chan JKL et al. [35] verified that manipulating K6a phosphorylation or UPS activity may provide opportunities to harness the innate immunity of epithelia against infection. ALDH1A2 as substrates can recognize free retinal and cellular retinol-binding protein-bound retinal. It mainly metabolizes octanal and decanal but does not metabolize citral, benzaldehyde, acetaldehyde, and propanal efficiently [36, 37]. Shou S et al. [38] revealed that defects in IPCD and digit separation in Hoxa13 mutant mice may be partly caused by reduced levels of RA signaling stemming from a loss in the direct regulation of Aldh1a2.
Besides the proteins we mentioned above, some other studies [39, 40] have revealed that immunohistochemistry detecting CYP11B1 and B2 expression was very promising for patients with primary aldosteronism in establishing a final histopathological diagnosis. We also found CYP11B1 in our differentially expressed protein list, but not in the top 16. This might be due to the individual differences. But we can still pay more attention to this procedure, which could be part of the histopathological routine in all operated primary aldosteronism.
In addition, the discrimination of distinct prognosis between ACA and adrenocortical carcinoma (ACC) deserves our close attention. ACA is a curable neuroendocrine tumor that is usually treated via surgery, whereas ACC is a malignant tumor with a low five-year mortality rate and very poor prognosis [41, 42]. Therefore, future proteomic studies may focus on meaningful markers that allow the differentiation between ACA and ACC [6]. An improved understanding of the pathophysiology in these tumors may be obtained by reading lists of hundreds of differentially expressed genes and cellular pathways. There are already some relevant proteomic studies about adrenal cortical tumors [43, 44]. But we still need to go further.
Thus, the PPI network predicted by bioinformatic analysis can provide some useful indications for follow-up scientific research and meaningful clues to explore and detect the binding residues under specific chemical and physical statuses [45–48]. Further improvement is necessary to achieve substantial interactions [49–51]. Developing powerful methods (such as deep neural networks) and obtaining a systematic understanding of the basic mechanisms of PPI require additional time. We hope that the current work will motivate PPI forecasters to conduct further research.
Conclusions
The iTRAQ technique is a powerful tool for the identification of protein isoforms and comparative proteome studies. In this study, we identified 753 DEPs in ACA tissue compared with the control. Further studies are necessary to understand the functions of the identified proteins (E2F3, KRT6A, and ALDH1A2) in ACAs. A better understanding of the mechanisms underlying the upregulation of these proteins may be important for therapeutic purposes in PA due to ACAs.
Methods
Clinical specimens of adrenal adenoma tissue collection
The experimental group randomly collected four clinical specimens of human ACAs from June 2015 to December 2018 in the Second Hospital of Jilin University. The age and gender of all included patients were randomly selected. No adjuvant therapy, such as radiotherapy or chemotherapy, was performed before surgery. ACA tissue was confirmed by pathology after operation. Each patient’s tissue was obtained within 30 min after surgical resection and divided into two parts. One tissue was immersed in 4% formalin solution, and the other tissue was stored in sterile nitrogen tubes in liquid nitrogen. The control group was selected from normal adrenal cortex tissues adjacent to the tumorwhich appears normal under the microscope and was confirmed by pathologists in our hospital (Additional file 1: Figure S1). This experimental study was approved by the Ethics Committee of the Second Hospital of Jilin University.
iTRAQ
The detailed procedure has been described previously [52]. In brief, the protein samples were precipitated with acetone–TCA and digested by trypsin to generate proteolytic peptides, which were labeled with iTRAQ reagents. The combined peptide mixtures were analyzed by LC-MS/MS for both identification and quantification. Functional enrichment analysis was performed using GO (http://www.geneontology.org/) for biological process, cellular component, and molecular function. Pathway enrichment analysis of protein clusters was performed by KEGG mapping (http://www.genome.jp/kegg/).
PPI network construction
STRING v10.1 (http://string-db.org/) was applied to analyze the PPI of DEPs identified in the current study and to construct PPI networks. The protein interaction information was extracted from the orthologous proteins of clinical human ACA tissues. The active prediction methods, such as database, experiment, and text mining, were enabled [53].
Western blot
Proteins extracted from patient samples were separated by 10% SDS–PAGE and then transferred to PVDF membranes (Millipore, Bedford, MA, USA). Membranes were blocked for 1 h in Tris-buffered saline containing Tween (TBST; 20 mM Tris–HCl [pH 7.6], 137 mM NaCl, 0.1% Tween-20) and 5% BSA. After incubation with primary antibodies at 4 °C overnight, the membranes were then washed three times with TBST and incubated with horseradish peroxidase (HRP)-conjugated secondary antibodies (anti-rabbit or anti-mouse IgG: 1:4000, Sigma, USA) for 2 h at room temperature. Bound antibodies were detected by HRP-conjugated rabbit anti-mouse antibody. Band density was quantified by ImageJ and normalized to GAPDH.
Statistical analysis
Data are given as the mean ± SEM. GraphPad Prism Software (San Diego, CA, USA) was used for statistical analysis. The significance of differences between groups was determined by a non-paired Student’s t-test.
Additional file
Figure S1. The representative image of medullar-free normal cortex. (DOC 7087 kb)
Acknowledgements
Not Applicable.
Abbreviations
- ACA
Adrenocortical adenoma
- DEPs
Differentially expressed proteins
- iTRAQ
Isobaric tags for relative and absolute quantitation
- PA
Primary aldosteronism
- PPI
Protein–protein interaction
Authors’ contributions
HM, RWL, and KW conducted the literature search and wrote the paper. RWL and KW designed the study, obtained funding, and provided technical support. HM, XD, XJ, YW, BJL, CLS, MSJ, and XRZ participated in the main experiments and collected the data. All authors read and approved the final manuscript.
Funding
This study was supported by the Medical And Health Industry Development Guide Funds of Jilin Province (No. 201603034YY) to Ke Wang, the Special funds for Industrial Innovation in Jilin Province (#2016C043–3) to Ke Wang, and the Natural Science Foundation of Jilin Province (No. 20180101103JC) to Ranwei Li. Ke Wang and Ranwei Li designed the study, obtained funding, provided technical and data support.
Availability of data and materials
All the supporting data are included as additional files.
Ethics approval and consent to participate
This experimental study was approved by the Ethics Committee of the Second Hospital of Jilin University. These patients signed an informed consent form for the experimental study.
Consent for publication
Not applicable.
Competing interests
The authors declare that they have no competing interests.
Footnotes
Publisher’s Note
Springer Nature remains neutral with regard to jurisdictional claims in published maps and institutional affiliations.
He Ma and Ranwei Li contributed equally to this work.
Contributor Information
He Ma, Email: 48486282@qq.com.
Ranwei Li, Email: 386008473@qq.com.
Xin Di, Email: meng.ch@163.com.
Xin Jin, Email: drjinxin@jlu.edu.cn.
Yan Wang, Email: 405996602@qq.com.
Bingjie Lai, Email: 36361695@qq.com.
Cailian Shi, Email: 578505186@qq.com.
Mingxin Ji, Email: 165249609@qq.com.
Xinran Zhu, Email: 876131459@qq.com.
Ke Wang, Email: kewangm1@hotmail.com.
References
- 1.Galati SJ. Primary aldosteronism: challenges in diagnosis and management. Endocrinol Metab Clin N Am. 2015;44(2):355–369. doi: 10.1016/j.ecl.2015.02.010. [DOI] [PubMed] [Google Scholar]
- 2.Weiner ID. Endocrine and hypertensive disorders of potassium regulation: primary aldosteronism. Semin Nephrol. 2013;33(3):265–276. doi: 10.1016/j.semnephrol.2013.04.007. [DOI] [PMC free article] [PubMed] [Google Scholar]
- 3.James BB, Adina TF, Richard AJ. Primary Aldosteronism: practical approach to diagnosis and management. Circulation. 2018;138(8):823–835. doi: 10.1161/CIRCULATIONAHA.118.033597. [DOI] [PMC free article] [PubMed] [Google Scholar]
- 4.Zennaro MC, Boulkroun S, Fernandes-Rosa F. Genetic Causes of Functional Adrenocortical Adenomas. Endocr Rev. 2017;38(6):516–537. doi: 10.1210/er.2017-00189. [DOI] [PubMed] [Google Scholar]
- 5.Calebiro D, Di Dalmazi G, Bathon K, Ronchi CL, Beuschlein F. cAMP signaling in cortisol-producing adrenal adenoma. Eur J Endocrinol. 2015;173(4):M99–106. doi: 10.1530/EJE-15-0353. [DOI] [PubMed] [Google Scholar]
- 6.Jouinot Anne, Armignacco Roberta, Assié Guillaume. Genomics of benign adrenocortical tumors. The Journal of Steroid Biochemistry and Molecular Biology. 2019;193:105414. doi: 10.1016/j.jsbmb.2019.105414. [DOI] [PubMed] [Google Scholar]
- 7.Faillot S, Assie G. ENDOCRINE TUMOURS: The genomics of adrenocortical tumors. Eur J Endocrinol. 2016;174(6):R249–R265. doi: 10.1530/EJE-15-1118. [DOI] [PubMed] [Google Scholar]
- 8.Nakamura Y, Yamazaki Y, Felizola SJ, Ise K, Morimoto R, Satoh F, Arai Y, Sasano H. Adrenocortical carcinoma: review of the pathologic features, production of adrenal steroids, and molecular pathogenesis. Endocrinol Metab Clin N Am. 2015;44(2):399–410. doi: 10.1016/j.ecl.2015.02.007. [DOI] [PubMed] [Google Scholar]
- 9.Anderson NL, Anderson NG, Pearson TW, Borchers CH, Paulovich AG, Patterson SD, Gillette M, Aebersold R, Carr SA. A human proteome detection and quantitation project. Mol Cell Proteomics. 2009;8(5):883–886. doi: 10.1074/mcp.R800015-MCP200. [DOI] [PMC free article] [PubMed] [Google Scholar]
- 10.Eckhard U, Marino G, Butler GS, Overall CM. Positional proteomics in the era of the human proteome project on the doorstep of precision medicine. Biochimie. 2016;122:110–118. doi: 10.1016/j.biochi.2015.10.018. [DOI] [PubMed] [Google Scholar]
- 11.Sabino F, Hermes O, Egli FE, Kockmann T, Schlage P, Croizat P, Kizhakkedathu JN, Smola H, auf dem Keller U. In vivo assessment of protease dynamics in cutaneous wound healing by degradomics analysis of porcine wound exudates. Mol Cell Proteomics. 2015;14(2):354–370. doi: 10.1074/mcp.M114.043414. [DOI] [PMC free article] [PubMed] [Google Scholar]
- 12.Vizovišek M, Vidmar R, Fonović M, Turk B. Current trends and challenges in proteomic identification of protease substrates. Biochimie. 2016;122:77–87. doi: 10.1016/j.biochi.2015.10.017. [DOI] [PubMed] [Google Scholar]
- 13.Trinh HV, Grossmann J, Gehrig P, Roschitzki B, Schlapbach R, Greber UF, Hemmi S. iTRAQ-based and label-free proteomics approaches for studies of human adenovirus infections. Int J Proteomics. 2013;2013:581862. doi: 10.1155/2013/581862. [DOI] [PMC free article] [PubMed] [Google Scholar]
- 14.Latosinska A, Vougas K, Makridakis M, Klein J, Mullen W, Abbas M, Stravodimos K, Katafigiotis I, Merseburger AS, Zoidakis J, Mischak H, Vlahou A, Jankowski V. Comparative Analysis of Label-Free and 8-Plex iTRAQ Approach for Quantitative Tissue Proteomic Analysis. PLoS One. 2015;10(9):e0137048. doi: 10.1371/journal.pone.0137048. [DOI] [PMC free article] [PubMed] [Google Scholar]
- 15.Wang H, Alvarez S, Hicks LM. Comprehensive comparison of iTRAQ and label-free LC-based quantitative proteomics approaches using two Chlamydomonas reinhardtii strains of interest for biofuels engineering. J Proteome Res. 2012;11(1):487–501. doi: 10.1021/pr2008225. [DOI] [PubMed] [Google Scholar]
- 16.Sandberg A, Branca RM, Lehtiö J, Forshed J. Quantitative accuracy in mass spectrometry based proteomics of complex samples: the impact of labeling and precursor interference. J Proteome. 2014;96:133–144. doi: 10.1016/j.jprot.2013.10.035. [DOI] [PubMed] [Google Scholar]
- 17.Wang H, Li Y, Yang L, Yu B, Yan P, Pang M, Li X, Yang H, Zheng G, Xie J, Guo R. Mass spectrometry-based, label-free quantitative proteomics of round spermatids in mice. Mol Med Rep. 2014;10(4):2009–2024. doi: 10.3892/mmr.2014.2460. [DOI] [PMC free article] [PubMed] [Google Scholar]
- 18.Heroux MS, Chesnik MA, Halligan BD, Al-Gizawiy M, Connelly JM, Mueller WM, Rand SD, Cochran EJ, LaViolette PS, Malkin MG, Schmainda KM, Mirza SP. Comprehensive characterization of glioblastoma tumor tissues for biomarker identification using massspectrometry-based label-free quantitative proteomics. Physiol Genomics. 2014;46(13):467–481. doi: 10.1152/physiolgenomics.00034.2014. [DOI] [PMC free article] [PubMed] [Google Scholar]
- 19.Smits AH, Jansen PW, Poser I, Hyman AA, Vermeulen M. Stoichiometry of chromatin-associated protein complexes revealed by label-free quantitative massspectrometry-based proteomics. Nucleic Acids Res. 2013;41(1):e28. doi: 10.1093/nar/gks941. [DOI] [PMC free article] [PubMed] [Google Scholar]
- 20.Ashburner M, Ball CA, et al. Gene ontology: tool for the unification of biology. The Gene Ontology Consortium. Nat Genet. 2000;25(1):25–29. doi: 10.1038/75556. [DOI] [PMC free article] [PubMed] [Google Scholar]
- 21.Luan X, Cao Z, Xing Z, Liu M, Gao M, Meng B, Fan R. Comparative proteomic analysis of pituitary glands from Huoyan geese between pre-laying and laying periods using an iTRAQ-based approach. PLoS One. 2017;12(9):e0185253. doi: 10.1371/journal.pone.0185253. [DOI] [PMC free article] [PubMed] [Google Scholar]
- 22.Unwin RD, Griffiths JR, Whetton AD. Simultaneous analysis of relative protein expression levels across multiple samples using iTRAQ isobaric tags with 2D nano LC-MS/MS. Nat Protoc. 2010;5(9):1574–1582. doi: 10.1038/nprot.2010.123. [DOI] [PubMed] [Google Scholar]
- 23.Shum AMY, Poljak A, Bentley NL, Turner N, Tan TC, Polly P. Proteomic profiling of skeletal and cardiac muscle in cancer cachexia: alterations in sarcomeric and mitochondrial protein expression. Oncotarget. 2018;9(31):22001–22022. doi: 10.18632/oncotarget.25146. [DOI] [PMC free article] [PubMed] [Google Scholar]
- 24.Jamaluddin M. Fairuz B., Nagendra Prathima B., Nahar Pravin, Oldmeadow Christopher, Tanwar Pradeep S. Proteomic Analysis Identifies Tenascin-C Expression Is Upregulated in Uterine Fibroids. Reproductive Sciences. 2018;26(4):476–486. doi: 10.1177/1933719118773420. [DOI] [PubMed] [Google Scholar]
- 25.Klimek-Piotrowska W, Krawczyk-Ożóg A, Suski M, Kapusta P, Wołkow PP, Hołda MK. Comparative iTRAQ analysis of protein abundance in the human sinoatrial node and working cardiomyocytes. J Anat. 2018;232(6):956–964. doi: 10.1111/joa.12798. [DOI] [PMC free article] [PubMed] [Google Scholar]
- 26.Wang WS, Liu XH, Liu LX, Lou WH, Jin DY, Yang PY, Wang XL. iTRAQ-based quantitative proteomics reveals myoferlin as a novel prognostic predictor in pancreatic adenocarcinoma. J Proteome. 2013;91:453–465. doi: 10.1016/j.jprot.2013.06.032. [DOI] [PubMed] [Google Scholar]
- 27.Yang J, Zhang HF, Qin CF. MicroRNA-217 functions as a prognosis predictor and inhibits pancreatic cancer cell proliferation and invasion via targeting E2F3. Eur Rev Med Pharmacol Sci. 2017;21(18):4050–4057. [PubMed] [Google Scholar]
- 28.Iwahori S, Kalejta RF. Phosphorylation of transcriptional regulators in the retinoblastoma protein pathway by UL97, the viral cyclin-dependent kinase encoded by human cytomegalovirus. Virology. 2017;512:95–103. doi: 10.1016/j.virol.2017.09.009. [DOI] [PMC free article] [PubMed] [Google Scholar]
- 29.Trikha P, Sharma N, Pena C, Reyes A, Pécot T, Khurshid S, Rawahneh M, Moffitt J, Stephens JA, Fernandez SA, Ostrowski MC, Leone G. E2f3 in tumor macrophages promotes lung metastasis. Oncogene. 2016;35(28):3636–3646. doi: 10.1038/onc.2015.429. [DOI] [PMC free article] [PubMed] [Google Scholar]
- 30.Foster CS, Falconer A, Dodson AR, Norman AR, Dennis N, Fletcher A, Southgate C, Dowe A, Dearnaley D, Jhavar S, Eeles R, Feber A, Cooper CS. Transcription factor E2F3 overexpressed in prostate cancer independently predicts clinical outcome. Oncogene. 2004;23(35):5871–5879. doi: 10.1038/sj.onc.1207800. [DOI] [PubMed] [Google Scholar]
- 31.Reimer D, Hubalek M, Riedle S, Skvortsov S, Erdel M, Concin N, Fiegl H, Müller-Holzner E, Marth C, Illmensee K, Altevogt P, Zeimet AG. E2F3a is critically involved in epidermal growth factor receptor-directed proliferation in ovariancancer. Cancer Res. 2010;70(11):4613–4623. doi: 10.1158/0008-5472.CAN-09-3551. [DOI] [PubMed] [Google Scholar]
- 32.Feng B, Wang R, Song HZ, Chen LB. MicroRNA-200b reverses chemoresistance of docetaxel-resistant human lung adenocarcinoma cells by targeting E2F3. Cancer. 2012;118(13):3365–3376. doi: 10.1002/cncr.26560. [DOI] [PubMed] [Google Scholar]
- 33.Martinez LA, Goluszko E, Chen HZ, Leone G, Post S, Lozano G, Chen Z, Chauchereau A. E2F3 is a mediator of DNA damage-induced apoptosis. Mol Cell Biol. 2010;30(2):524–536. doi: 10.1128/MCB.00938-09. [DOI] [PMC free article] [PubMed] [Google Scholar]
- 34.Lee JT, Wang G, Tam YT, Tam C. Membrane-Active Epithelial Keratin 6A Fragments (KAMPs) Are Unique Human Antimicrobial Peptides with a Non-αβ Structure. Front Microbiol. 2016;7:1799. doi: 10.3389/fmicb.2016.01799. [DOI] [PMC free article] [PubMed] [Google Scholar]
- 35.Chan JKL, Yuen D, Too PH, Sun Y, Willard B, Man D, Tam C. Keratin 6a reorganization for ubiquitin-proteasomal processing is a direct antimicrobial response. J Cell Biol. 2018;217(2):731–744. doi: 10.1083/jcb.201704186. [DOI] [PMC free article] [PubMed] [Google Scholar]
- 36.Zaman TS, Arimochi H, Maruyama S, Ishifune C, Tsukumo SI, Kitamura A, Yasutomo K. Notch Balances Th17 and Induced Regulatory T Cell Functions in Dendritic Cells by Regulating Aldh1a2 Expression. J Immunol. 2017;199(6):1989–1997. doi: 10.4049/jimmunol.1700645. [DOI] [PubMed] [Google Scholar]
- 37.Kasimanickam VR. Expression of retinoic acid-metabolizing enzymes, ALDH1A1, ALDH1A2, ALDH1A3, CYP26A1, CYP26B1 and CYP26C1 in canine testis during post-natal development. Reprod Domest Anim. 2016;51(6):901–909. doi: 10.1111/rda.12756. [DOI] [PubMed] [Google Scholar]
- 38.Shou S, Carlson HL, Perez WD, Stadler HS. HOXA13 regulates Aldh1a2 expression in the autopod to facilitate interdigital programmed cell death. Dev Dyn. 2013;242(6):687–698. doi: 10.1002/dvdy.23966. [DOI] [PubMed] [Google Scholar]
- 39.Volpe C, Hamberger B, Zedenius J, Juhlin CC. Impact of immunohistochemistry on the diagnosis and management of primary aldosteronism: an important tool for improved patient follow-up. Scand J Surg. 2019;17:1457496918822622. doi: 10.1177/1457496918822622. [DOI] [PubMed] [Google Scholar]
- 40.Swierczynska MM, Betz MJ, Colombi M, Dazert E, Jenö P, Moes S, Pfaff C, Glatz K, Reincke M, Beuschlein F, Donath MY, Hall MN. Proteomic landscape of aldosterone-producing adenoma. Hypertension. 2019;73(2):469–480. doi: 10.1161/HYPERTENSIONAHA.118.11733. [DOI] [PubMed] [Google Scholar]
- 41.Lerario AM, Moraitis A, Hammer GD. Genetics and epigenetics of adrenocortical tumors. Mol Cell Endocrinol. 2014;386(1–2):67–84. doi: 10.1016/j.mce.2013.10.028. [DOI] [PMC free article] [PubMed] [Google Scholar]
- 42.Kirschner LS, Stratakis CA. 5th International ACC Symposium: The New Genetics of Benign Adrenocortical Neoplasia: Hyperplasias, Adenomas, and Their Implications for Progression into Cancer. Horm Cancer. 2016;7(1):9–16. doi: 10.1007/s12672-015-0246-x. [DOI] [PMC free article] [PubMed] [Google Scholar]
- 43.Kim HM, Lee YK, Koo JS. Proteome analysis of adrenal cortical tumors. Expert Rev Proteomics. 2016;13(8):747–755. doi: 10.1080/14789450.2016.1210008. [DOI] [PubMed] [Google Scholar]
- 44.Yang MS, Wang HS, Wang BS, Li WH, Pang ZF, Zou BK, Zhang X, Shi XT, Mu DB, Zhang DX, Gao YS, Sun XW, Xia SJ. A comparative proteomic study identified calreticulin and prohibitin up-regulated in adrenocorticalcarcinomas. Diagn Pathol. 2013;8:58. doi: 10.1186/1746-1596-8-58. [DOI] [PMC free article] [PubMed] [Google Scholar]
- 45.Stevers Loes M., de Vink Pim J., Ottmann Christian, Huskens Jurriaan, Brunsveld Luc. A Thermodynamic Model for Multivalency in 14-3-3 Protein–Protein Interactions. Journal of the American Chemical Society. 2018;140(43):14498–14510. doi: 10.1021/jacs.8b09618. [DOI] [PMC free article] [PubMed] [Google Scholar]
- 46.Taylor IR, Dunyak BM, Komiyama T, Shao H, Ran X, Assimon VA, Kalyanaraman C, Rauch JN, Jacobson MP, Zuiderweg ERP, Gestwicki JE. High-throughput screen for inhibitors of protein-protein interactions in a reconstituted heat shock protein 70 (Hsp70) complex. J Biol Chem. 2018;293(11):4014–4025. doi: 10.1074/jbc.RA117.001575. [DOI] [PMC free article] [PubMed] [Google Scholar]
- 47.Jelínek J, Škoda P, Hoksza D. Utilizing knowledge base of amino acids structural neighborhoods to predict protein-proteininteraction sites. BMC Bioinformatics. 2017;18(Suppl 15):492. doi: 10.1186/s12859-017-1921-4. [DOI] [PMC free article] [PubMed] [Google Scholar]
- 48.Wong JH, Alfatah M, Sin MF, Sim HM, Verma CS, Lane DP, Arumugam P. A yeast two-hybrid system for the screening and characterization of small-molecule inhibitors of protein-protein interactions identifies a novel putative Mdm2-binding site in p53. BMC Biol. 2017;15(1):108. doi: 10.1186/s12915-017-0446-7. [DOI] [PMC free article] [PubMed] [Google Scholar]
- 49.Chang Ji-Wei, Zhou Yan-Qing, Ul Qamar Muhammad, Chen Ling-Ling, Ding Yu-Duan. Prediction of Protein–Protein Interactions by Evidence Combining Methods. International Journal of Molecular Sciences. 2016;17(11):1946. doi: 10.3390/ijms17111946. [DOI] [PMC free article] [PubMed] [Google Scholar]
- 50.Keskin O, Tuncbag N, Gursoy A. Predicting Protein-Protein Interactions from the Molecular to the Proteome Level. Chem Rev. 2016;116(8):4884–4909. doi: 10.1021/acs.chemrev.5b00683. [DOI] [PubMed] [Google Scholar]
- 51.Murakami Y, Tripathi LP, Prathipati P, Mizuguchi K. Network analysis and in silico prediction of protein-protein interactions with applications in drug discovery. Curr Opin Struct Biol. 2017;44:134–142. doi: 10.1016/j.sbi.2017.02.005. [DOI] [PubMed] [Google Scholar]
- 52.Wang X, Li Y, Xu G, Liu M, Xue L, Liu L, Hu S, Zhang Y, Nie Y, Liang S, Wang B, Ding J. Mechanism study of peptide GMBP1 and its receptor GRP78 in modulating gastric cancer MDR by iTRAQ-based proteomic analysis. BMC Cancer. 2015;15:358. doi: 10.1186/s12885-015-1361-3. [DOI] [PMC free article] [PubMed] [Google Scholar]
- 53.Szklarczyk D, Franceschini A, Kuhn M, Simonovic M, Roth A, Minguez P, Doerks T, Stark M, Muller J, Bork P, et al. The STRING database in 2011: functional interaction networks of proteins, globally integrated and scored. Nucleic Acids Res. 2011;39(Database issue):D561–D568. doi: 10.1093/nar/gkq973. [DOI] [PMC free article] [PubMed] [Google Scholar]
Associated Data
This section collects any data citations, data availability statements, or supplementary materials included in this article.
Supplementary Materials
Figure S1. The representative image of medullar-free normal cortex. (DOC 7087 kb)
Data Availability Statement
All the supporting data are included as additional files.


