

ABSTRACT
Hepatic lipidosis (HL) is a well-known disease in fattening and in parent turkey flocks. Among others, dietary effects like (a lack of) essential amino acids (AA) as lipotrophic factors (e.g., methionine) have been considered as potentially predispositing for HL. Several studies have reported abnormal AA profiles in hepatic diseases of humans and other livestock. The ratio of branched-chain amino acids (BCAA) to aromatic amino acids (AAA) in plasma is used to predict hepatic cirrhosis. In this study, the state of supply of AA was investigated by comparing non-affected (NA) animals and those affected by HL. The AA pattern in the liver and blood can provide potential indications of pathogenesis of HL. In cooperation with German poultry veterinarians, 3 cases of HL on 3 different fattening turkey farms were visited (13/14 wk old, “B.U.T. Big 6” and “TP7”). Overall, 73 birds were examined, of which 42 birds suffered from HL and 31 were not affected. Feeding samples of the respective actual feed were taken and analyzed. The selection of animals was carried out (NA randomly) by clinical signs such as apathy and dyspnea and the diagnosis was made at necropsy, which could be confirmed by crude fat content in liver tissue (HL: 309, NA: 155). In liver tissue, the CP and AA contents were lower among animals with HL than among NA (P < 0.05). In blood samples, the sum of AA, ammonia, and urea was more than 3 times higher among animals with HL (431 mg/dL serum) than among NA (114 mg/dL serum; P < 0.01). The ratio of BCAA to AAA was also significantly different between the groups (HL: 0.85, NA: 1.42; P < 0.05). In the case of HL, entire herds were not affected and the “non-affected” ones were comparable with healthy slaughtered animals. There seems to be a clear change in protein and AA metabolism of HL animals, which could lead to an optimization in feeding practice in repeated cases of HL.
Keywords: turkey, hepatic lipidosis, amino acid
INTRODUCTION
Hepatic lipidosis (HL) is a well-known disease in fattening and in parent turkey flocks, and involves both farmers and poultry veterinarians (Popp et al., 2014). Usually in fattening turkey flocks, the disease occurs suddenly at an age of between 12 and 16 wk, lasting about 7 D with mortality rates of up to 15% (Gazdzinski et al., 1994). The affected animals show clinical characteristics of dyspnea, nonchalance, and prostration (Alloui et al., 2015). Increased beta-hydroxybutyrate levels were measured in the blood of animals with HL, which could suggest enhanced lipolysis due to a fasting period and a negative energy balance (Weier, 2016). Former histopathological investigations reported on vacuolization, hemorrhagic areas, and necrotic hepatocytes, while the reticular framework was maintained (Gallazzi et al., 2007; Manarolla et al., 2011). Popp et al. (2014) detected picornavirus and parvovirus RNA in liver tissue of animals with HL. In practice, a vaccination against avian encephalomyelitis could achieve a reduced mortality in affected flocks (Möhle and Windhaus, 2016). Also, the presence of Clostridia could be frequently proved in livers of affected animals without clarifying if this was a primary or secondary finding (Sieverding, 2015). Therefore, a lot of underlying reasons have been discussed, but the concrete aetiology and pathogenesis remain unclarified (Visscher et al., 2017).
Among other poultry species, fatty liver disease, such as fatty liver syndrome and fatty liver hemorrhagic syndrome in laying hens, is well researched and must be distinguished from HL in turkeys. In the case of fatty liver syndrome in hens, the birds often show no clinical signs and the first sign is a decrease in egg production (Harms et al., 1982). In many cases, these birds die suddenly from liver rupture (Butler, 1976). In contrast, turkeys suffering from HL first attract attention due to their clinical signs (Gazdzinski et al., 1994) and at necropsy the liver is intact. There are several sources and therefore pathways of fats leading to fatty liver including peripherally stored adipose tissue that flows into the liver during lipolysis, the uptake of dietary fats, and newly made fatty acids produced by de novo lipogenesis in liver tissue (Donnelly et al., 2005). Besides questions primarily concerning fat metabolism, dietary effects like low protein diets with low contents of some essential amino acids are considered to be potential predispositing factors (Gazdzinski et al., 1994; Popp et al., 2014). Especially methionine as an intermediate for carnitine (Zhang et al., 2017) and several lipoproteins, and its function as a lipotrophic factor are of particular interest (Garcia Neto et al., 2000). Consequently, an insufficient supply or an increased need for methionine could lead to a reduced removal of fat from the liver (Hazel, 2009). Several studies reported abnormal amino acid profiles in hepatic disease (Rosen et al., 1977). Elevated plasma branched-chain amino acids (BCAA) are associated with insulin resistance (Goffredo et al., 2017), a metabolic disorder predisposing fatty liver disease. Furthermore, the ratio of BCAA to aromatic amino acids (AAA) in plasma is used to predict hepatic necrosis and cirrhosis (Kawaguchi et al., 2011). To our knowledge, no flock affected by HL has yet been systematically examined to see whether the entire flock is affected. Besides, the amino acid pattern in the liver and blood has not yet been investigated. The aim of the present study was to show potential indications of the pathogenesis of HL due to the amino acid pattern in liver tissue and blood and clarify whether there are alterations in clinically unremarkable turkeys in an affected flock.
MATERIAL AND METHODS
Sample collection took place in April, May, and June 2017 in Central and North Germany in cooperation with several poultry veterinarians. Three cases of HL on three different fattening turkey farms were inspected. In agreement with the Animal Welfare Officer, this study was not an animal experiment requiring any notification or approval in accordance with the Animal Protection Act (Section 7, Paragraph 2, Sentence 3). Interventions before dissection were not carried out. The animals were killed in accordance with Section 4, Paragraph 3 of the Animal Protection Act, exclusively to use their organs or tissues for scientific purposes (Az 27.02.2017, Az 15.08.2018). Per case, up to 20 birds with clinical signs were taken for examination and up to 11 clinically non-affected birds were taken randomly during at least 2 consecutive days of illness. Overall, 73 birds from 3 cases of HL were examined. Due to missing reference values of the turkey species regarding amino acid contents in liver tissue and the blood, additional livers and blood samples from 15 healthy female turkeys, whose flocks were not affected by HL, were analyzed.
Animals and Feeding
The size of the affected flocks differed between 5,000 turkeys in case 1, 5,200 turkeys in case 2, and 4,120 turkeys in case 3, and the flocks consisted of entirely female birds. At the time of the outbreak of HL, the animals were either 13 or 14 wk old. Two flocks consisted of commercial turkeys of line “B.U.T. Big 6” and one flock of commercial turkeys of line “TP7.” Overall, 49 animals with clinical signs and 24 animals without clinical signs were examined. In case 1, 20 clinically apparent and 11 not clinically apparent birds; in case 2, 13 clinically apparent and 8 not clinically apparent birds; and in case 3, 16 clinically apparent and 5 not clinically apparent birds were investigated. The feed was commercial and supplied by 3 different feed mills. For the reference values, 15 birds from a flock of 2,000 female turkeys aged approximately 13 wk (“B.U.T. Big 6”) were investigated.
Sample Collection
On at least 2 consecutive days of disease, sample collection took place in every case. The selection of affected animals was based on clinical symptoms such as unsteady gait, dyspnea, and apathy (Gazdzinski et al., 1994), whereas the non-affected animals were selected randomly. The emergency killing of diseased birds took place after stunning and bleeding on the spot, whereas the birds showing no clinical signs were brought to a dissection room and slaughtered after stunning and bleeding. During bleeding, blood samples were taken from each animal and after bleeding the body weight was measured. At necropsy, the final diagnosis HL or “non-affected animal” (NA) was made macroscopically (Figure 1), and the livers were removed under sterile conditions and weighed. The blood samples were centrifuged for 15 min at 3,000 rpm (Megafuge 1.0, Heraeus, Hanau, Germany), and the serum was stored at –20°C. Whole liver samples were packaged in plastic bowls (500 mL, Hannoversche Gewürzmühle, Hannover, Germany) and stored at –20°C. Additionally, samples of the present diet were taken from each farm. The birds of the reference group (RG) were brought to a dissection room and slaughtered after stunning and bleeding. Both body and liver weight were measured as well. The blood samples were centrifuged, and livers and serum were stored at –20°C. A sample of the present diet was also taken.
Figure 1.
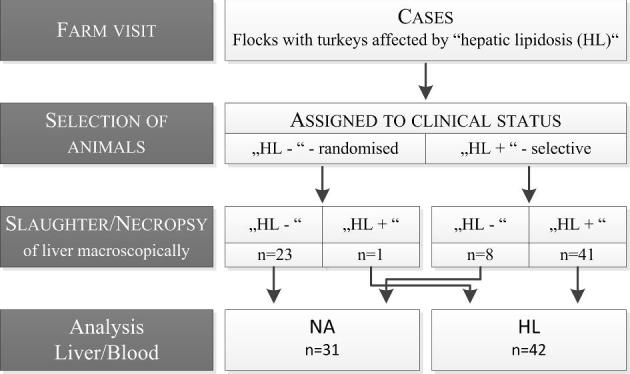
Workflow of sampling procedure.
Chemical Analysis
Some preparation was required before chemically analyzing the liver samples. The whole livers were shredded with a blender (Grindomix GM 200, Retsch, Haan, Germany) and freeze-dried (freeze dryer Gamma 1–20, Martin Christ, Osterode am Harz, Germany). The freeze-dried material was shredded in a grinder again (M20 universal grinder, Staufen, Germany). The dry matter content was determined by drying the sample constantly at 103°C. The total nitrogen content was determined by means of the Vario Max analyzer (Elementar, Hanau, Germany) using the DUMAS combustion method. The molecular nitrogen formed by reduction from nitric oxide was detected by a thermal conductivity detector and the nitrogen content was calculated by the device software. The crude protein (CP) content was calculated by multiplying by a constant factor of 6.25. The amino acid content of liver tissue was determined by an ion exchange chromatography in an amino acid analyzer (biochrom 30Plus Amino Acid Analyzer, Biochrom Ltd., Cambridge, UK) with hydrolyzed sample material. For analyzing methionine and cysteine, oxidation preceded the hydrolysis. To determine the crude fat (CF) content in liver tissue, the material was cooked for 30 min in 30% hydrochloric acid. The samples were filtered (folded filter, Macherey-Nagel, Düren, Germany) and dried overnight at 80°C in a drying cabinet. The following fat extraction was made with light petroleum in a Soxhlet extractor. Finally, the light petroleum was evaporated with a rotary evaporator. All feeding samples were analyzed in duplicate using standardized laboratory methods in accordance with the Association of German Agricultural Investigation and Research Institutions (Verband Deutscher Landwirtschaftlicher Untersuchungs- und Forschungsanstalten (VDLUFA)) (Naumann and Bassler, 2012).
Blood Samples
In order to determine the free amino acid content in blood samples, deproteinization was carried out. A volume of 1,000 μL serum was mixed with 250 μL sulfosalicylic acid and stored for 30 min at 4°C. After centrifuging (Megafuge 1.0, Heraeus, Hanau, Germany) for 10 min, the supernatant was pipetted and mixed with the same volume of sample diluent. The prepared sample was filtered and analyzed (Biochrom 30Plus Amino Acid Analyzer, Biochrom Ltd).
Statistical Analysis
For statistical analysis of the data, the Statistical Analysis System SAS Enterprise Guide, version 7.1 (SAS Institute Inc. Cary) for Windows was used. To determine the parameters, liver`s percentage of body weight, “share of amino acids on CP” in liver tissue, and “share of amino acids on the sum” in blood, the percentage and share were calculated for each particular bird and sample. Afterwards, the mean value was calculated. In the same manner, the sum of AAA, BCAA, and their ratio was calculated for every single sample. A test of normal distribution was performed by calculating the residuals for each value and verifying them for normal distribution. Overall, the data were not normally distributed and the non-parametric comparisons Wilcoxon test was carried out. For correlation analysis, the Spearman`s rank correlation coefficient was used. The P-value < 0.05 was considered significant. The results of the RG were not included in the statistical evaluation but served only as reference values or a comparison with healthy birds of a non-affected flock.
RESULTS
All 3 farms could report outbreaks of HL in several preceding fattening periods. Before and after the investigated cases, animal losses were at a common level (under 5% during rearing and fattening period) throughout the fattening period and no exceptionalities were reported. During the days HL occurred, individual animals in the affected flocks showed clinical symptoms like apathy, dyspnea, and lethargy. The affected animals were unable to walk and had a highly increased respiratory rate. The animal losses in the flocks due to HL confirmed by necropsy increased markedly within 5 to 7 D up to 4.6% in the first case, 1.8% in the second case, and 3.6% in the third case, respectively. The RG flock was unremarkable and animal losses during rearing and fattening amounted to about 2.63%. The nutrient composition of the feed samples, not only from the case diets in all 3 cases but also from the RG, yielded a usual composition (Table 1).
Table 1.
Nutrient composition of the 3 case diets (CD) at time of outbreak of hepatic lipidosis and the diet of the reference group (DRG).
| CD1 | CD2 | CD3 | DRG | CD1 | CD 2 | CD3 | DRG | ||
|---|---|---|---|---|---|---|---|---|---|
| Nutrient content (g/kg DM) | |||||||||
| ME (MJ/kg diet) | 12.8 | 13.1 | 13.2 | 12.7 | Methionine1 | 3.19 | 3.02 | 4.66 | 3.37 |
| Phenylalanine | 8.93 | 8.87 | 7.48 | 10.9 | |||||
| Crude ash | 43.6 | 44.5 | 37.6 | 56.3 | Threonine | 6.98 | 7.72 | 7.16 | 8.29 |
| Crude fat | 68.2 | 87.2 | 83.2 | 73.1 | Valine | 8.21 | 6.76 | 6.82 | 10.7 |
| Crude fiber | 31.8 | 37.0 | 25.1 | 29.7 | Alanine | 8.43 | 8.05 | 7.04 | 9.62 |
| Crude protein | 195 | 201 | 168 | 219 | Aspartic acid | 16.2 | 15.2 | 13.0 | 20.0 |
| Starch | 504 | 484 | 537 | 464 | Glutamic acid | 43.8 | 48.5 | 38.3 | 49.6 |
| Sugar | 40.0 | 41.3 | 39.5 | 38.6 | Glycine | 8.06 | 8.59 | 6.56 | 10.0 |
| Arginine | 11.5 | 11.4 | 9.24 | 14.5 | Histidine | 4.60 | 4.62 | 3.83 | 5.61 |
| Cysteine | 2.68 | 2.73 | 2.39 | 3.84 | Proline | 13.6 | 14.4 | 12.1 | 15.8 |
| Isoleucine | 6.83 | 6.76 | 5.62 | 32.5 | Serine | 9.55 | 9.75 | 8.16 | 10.6 |
| Leucine | 14.6 | 13.7 | 12.5 | 17.2 | Tyrosine | 6.57 | 6.29 | 5.62 | 7.26 |
| Lysine | 13.0 | 13.5 | 10.9 | 14.0 | Iron (mg/kg DM) | 244 | 202 | 203 | 302 |
1Only DL-methionine.
Contents of the hydroxylated analog of methionine: CD 1: 1.18 g/kg DM; CD 2: 1.19 g/kg DM; CD 3: <0.20 g/kg DM; DRG:1.79 g/kg DM.
Selection of Animals
The selection of the birds coincided regarding their clinical signs and the results of the necropsy (Figure 1). In total, 49 turkeys with clinical signs and 24 turkeys without clinical signs were investigated. Only 1 out of 24 turkeys without clinical signs showed a macroscopically fatty liver (Figure 2). Among some selected turkeys with clinical signs, no fatty liver could be observed (8 out of 49) and consequently there were 42 turkeys with HL and 31 turkeys without HL, respectively (Figure 3). The remaining pathological examination among the affected and non-affected birds was unremarkable. The body weight of NA with an average of 8.20 ± 1.13 kg was not different from the body weight of those animals with HL with an average of 8.31 ± 0.83 kg. In contrast, the liver weight was lower among NA (147 ± 32.8 g) than among those animals with HL (193 ± 38.9 g), and consequently the liver`s percentage of the total body weight was with an average of 2.33 ± 0.44% higher among animals with HL than among NA with an average of 1.82 ± 0.46%.
Figure 2.
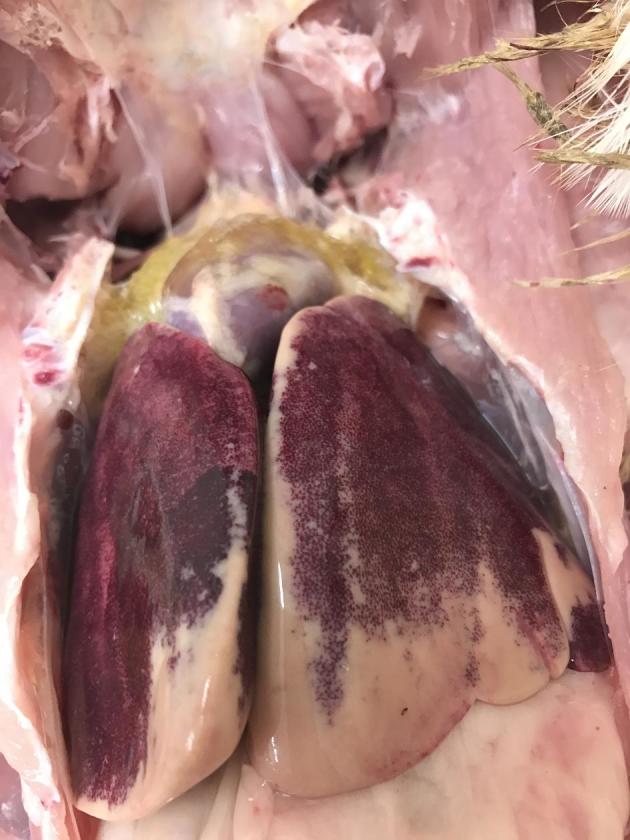
Liver with hepatic lipidosis (HL group).
Figure 3.
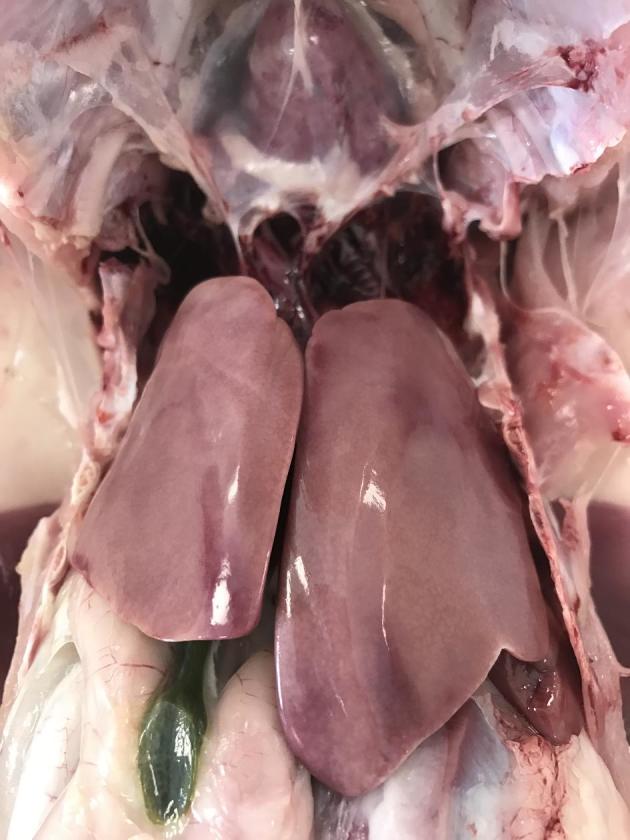
Unremarkable liver of a flock affected by hepatic lipidosis (NA group).
Comparison of the 3 Flocks Affected by HL
Of the 73 birds examined, 31 birds came from flock 1, 21 birds came from flock 2, and 21 birds came from flock 3. The birds from flock 1 were 14 wk old at the time HL occurred, animal losses before and after the outbreak amounted to about 3%, and animal losses due to HL were about 4.6%. The birds from flock 2 were 13 wk old at the time HL occurred. Animal losses due to HL were about 1.8% and before and after the outbreak animal losses were about 3.5%. The birds from flock 3 were 14 wk old at the time HL occurred and animal losses due to the disease were about 3.6%. Before and after the outbreak, animal losses amounted to 4.5% in this flock.
The average body weight at necropsy (8.50 ± 0.64 kg) and the average liver weight in flock 1 (189 ± 47.3 g) and in flock 3 (body weight: 8.80 ± 0.68 kg; liver weight: 165 ± 39.6 g) were higher than in flock 2 (body weight: 7.36 ± 1.00 kg; liver weight: 158 ± 30.9 g). The liver`s percentage of the total body weight was 2.23 ± 0.57% in flock 1 and therefore not different from flock 2 (2.17 ± 0.45%) but higher than in flock 3 (1.87 ± 0.41%). There was no difference in the liver`s percentage of body weight between flocks 2 and 3.
The CF content in liver tissue (Table 2) from flock 1 was higher (293 ± 96.9 g/kg DM) than that from flock 2 (169 ± 78.0 g/kg DM), but not different from the CF content in liver tissue from flock 3 (245 ± 107 g/kg DM). On the other hand, the CP content in liver tissue from flock 2 was higher (646 ± 76.3 g/kg DM) than from flock 3 (581 ± 95.5 g/kg DM) and in between from flock 1 (621 ± 88.8 g/kg DM). In general, more than half of the amino acid contents in liver tissue and their share on CP similar between the 3 flocks. Arginine, glutamic acid, glycine, isoleucine, methionine, and proline were highest in flock 2 as was the CP content and lowest in flock 3. Regarding the share of amino acids on CP, histidine, lysine, proline, threonine, and valine were lowest among flock 2. Overall, amino acid, ammonia, and urea contents in blood samples were similar between the 3 flock (Table 3). Only the ammonia content differed between the 3 flocks, being highest in flock 2 and lowest in flock 1. The urea content was higher among flock 1 than among flock 2 and similar to that among flock 3. The glutamic acid content did not differ in flocks 2 and 3 and was higher than in flock 1. Regarding the share of amino acids, ammonia, and urea on the sum, ammonia was also higher in flock 2 and not different between flocks 1 and 3. Glycine and threonine were similar for flocks 1 and 3, but higher than in flock 2. Methionine was highest in flock 3 and similar for flocks 1 and 2. Glutamic acid was higher in flock 2 than in flock 1 and not different from flock 3, whereas phenylalanine was higher in flock 1 than in flock 3 and similar to flock 2.
Table 2.
Crude fat, crude protein, ammonia and essential amino acid1 content in liver tissue from different flocks.
| Amount (g/kg DM), Mean ± SD | Share (% on CP), Mean ±SD | |||||
|---|---|---|---|---|---|---|
| Item | Flock 1 (N = 31) | Flock 2 (N = 21) | Flock 3 (N = 21) | Flock 1 (N = 31) | Flock 2 (N = 21) | Flock 3 (N = 21 |
| CF2 | 293a | 169b | 245a | |||
| ± 96.9 | ±78.0 | ±107 | ||||
| CP3 | 621a,b | 646a | 581b | |||
| ± 88.8 | ±76.3 | ±95.5 | ||||
| Ammonia | 11.5 | 12.0 | 11.0 | 1.86 | 1.87 | 1.92 |
| ±2.43 | ±2.23 | ±1.35 | ±0.37 | ±0.30 | ±0.31 | |
| Arginine | 39.3a,b | 40.8a | 36.1b | 6.31 | 6.31 | 6.23 |
| ±7.38 | ±5.52 | ±6.13 | ±0.60 | ±0.37 | ±0.38 | |
| Cysteine | 7.91 | 8.15 | 7.26 | 1.28 | 1.27 | 1.25 |
| ±1.45 | ±1.27 | ±1.34 | ±0.18 | ±0.18 | ±0.14 | |
| Glutamic acid | 83.3a | 87.2a | 74.1b | 13.5 | 13.5 | 12.8 |
| ±11.9 | ±10.8 | ±9.83 | ±1.07 | ±0.86 | ±0.91 | |
| Glycine | 30.6a,b | 31.5a | 28.9b | 4.93 | 4.88 | 5.00 |
| ±5.17 | ±4.09 | ±4.43 | ±0.43 | ±0.40 | ±0.33 | |
| Histidine | 22.1 | 20.9 | 20.5 | 3.56a,b | 3.23b | 3.53a |
| ±5.45 | ±5.06 | ±5.03 | ±0.67 | ±0.67 | ±0.65 | |
| Isoleucine | 27.3a,b | 28.5a | 26.0b | 4.38 | 4.41 | 4.48 |
| ±4.78 | ±3.17 | ±4.20 | ±0.32 | ±0.17 | ±0.24 | |
| Leucine | 58.3 | 58.0 | 53.6 | 9.38 | 8.99 | 9.23 |
| ±9.37 | ±6.86 | ±9.01 | ±0.59 | ±0.44 | ±0.63 | |
| Lysine | 49.0 | 49.8 | 45.2 | 7.88a | 7.70b | 7.78a |
| ±7.69 | ±6.12 | ±7.37 | ±0.39 | ±0.21 | ±0.44 | |
| Methionine | 12.3a,b | 12.9a | 11.0b | 1.97 | 2.00 | 1.90 |
| ±3.03 | ±2.40 | ±2.24 | ±0.34 | ±0.32 | ±0.25 | |
| Phenylalanine | 32.4 | 32.5 | 29.6 | 5.22 | 5.02 | 4.91 |
| ±5.33 | ±4.05 | ±5.12 | ±0.36 | ±0.28 | ±0.09 | |
| Proline | 27.1a,b | 26.7a | 24.5b | 4.35a | 4.13b | 4.43a,b |
| ±5.15 | ±3.72 | ±3.73 | ±0.45 | ±0.17 | ±0.13 | |
| Threonine | 26.2 | 27.1 | 24.8 | 4.21a,b | 4.19b | 4.21a |
| ±4.27 | ±3.26 | ±3.53 | ±0.24 | ±0.13 | ±0.08 | |
| Valine | 37.0 | 37.3 | 34.6 | 5.95a | 5.78b | 5.90a |
| ±6.24 | ±4.35 | ±5.78 | ±0.40 | ±0.17 | ±0.12 | |
1Tryptophan is missing; further cysteine and glutamic acid are listed.
2CF = crude fat.
3CP = crude protein.
a,b P < 0.05.
Table 3.
Essential amino acid1, ammonia, and urea content in blood samples from different flocks.
| Amount (mg/dL serum), Mean ± SD | Share (% of sum), Mean ± SD | |||||
|---|---|---|---|---|---|---|
| Item | Flock 1 (N2 = 29) | Flock 2 (N2 = 16) | Flock 3 (N2 = 21) | Flock 1 (N2 = 29) | Flock 2 (N2 = 16) | Flock 3 (N2 = 21) |
| Sum3 | 270 | 291 | 338 | |||
| ±159 | ±189 | ±195 | ||||
| Ammonia | 15.9c | 31.3a | 22.1b | 6.34b | 13.3a | 7.68b |
| ±8.23 | ±11.2 | ±11.6 | ±1.14 | ±4.67 | ±2.80 | |
| Urea | 2.58a | 1.81b | 3.22a,b | 0.88 | 0.46 | 1.10 |
| ±2.24 | ±1.99 | ±2.68 | ±0.78 | ±0.55 | ±1.73 | |
| Arginine | 11.2 | 13.3 | 13.6 | 4.83 | 5.25 | 4.52 |
| ±5.32 | ±6.50 | ±7.14 | ±1.52 | ±1.28 | ±1.48 | |
| Cysteine | 2.92 | 3.32 | 3.52 | 1.51 | 1.51 | 1.55 |
| ±0.66 | ±0.92 | ±0.90 | ±0.82 | ±0.68 | ±1.01 | |
| Glutamine | 63.0 | 62.3 | 78.8 | 21.5 | 18.1 | 21.1 |
| ±42.7 | ±52.8 | ±52.5 | 5.82 | 6.06 | ±6.04 | |
| Glutamic acid | 7.87b | 11.3a | 11.4a | 3.29b | 4.44a | 3.72a,b |
| ±5.50 | ±5.55 | ±7.55 | ±1.39 | ±1.08 | ±1.34 | |
| Glycine | 10.6 | 10.7 | 13.0 | 4.13a | 3.72b | 3.91a |
| ±5.62 | ±6.76 | ±7.37 | ±0.51 | ±0.37 | ±0.33 | |
| Histidine | 2.37 | 2.33 | 2.89 | 1.10 | 1.01 | 0.94 |
| ±1,01 | ±8.85 | ±1.71 | ±0.44 | ±0.40 | ±0.28 | |
| Isoleucine | 3.33 | 3.12 | 1.20 | 1.41 | 1.20 | 1.20 |
| ±1.68 | ±1.62 | ±0.49 | ±0.49 | ±0.30 | ±0.49 | |
| Leucine | 5.99 | 5.62 | 6.51 | 2.61 | 2.28 | 2.14 |
| ±2.85 | ±2.44 | ±3.80 | ±0.93 | ±0.64 | ±0.66 | |
| Lysine | 19.5 | 19.7 | 24.8 | 6.05 | 5.43 | 6.10 |
| ±16.9 | ±18.2 | ±19.9 | ±2.49 | ±2.41 | ±2.53 | |
| Methionine | 3.63 | 3.49 | 4.77 | 1.22b | 1.10b | 1.40a |
| ±2.72 | ±2.70 | ±3.04 | ±0.29 | ±0.21 | ±0.27 | |
| Phenylalanine | 5.88 | 5.20 | 6.69 | 2.16a | 1.83a,b | 1.97b |
| ±4,15 | ±3.35 | ±4.47 | ±0.45 | ±0.24 | ±0.37 | |
| Proline | 12.0 | 13.5 | 14.3 | 4.43 | 5.01 | 4.33 |
| ±7.56 | ±7.32 | ±8.81 | ±0.90 | ±1.19 | ±1.34 | |
| Threonine | 14.4 | 14.0 | 19.2 | 5.56a | 4.74b | 5.77a |
| ±7.75 | ±9.46 | ±10.9 | ±0.98 | ±0.76 | ±1.02 | |
| Tryptophan | 2.10 | 2.69 | 2.11 | 0.88 | 0.76 | 0.64 |
| ±1.58 | ±1.28 | ±1.64 | ±0.49 | ±0.51 | ±0.43 | |
| Tyrosine | 9.28 | 10.1 | 12.2 | 3.41 | 3.12 | 3.34 |
| ±5.67 | ±8.10 | ±7.76 | ±0.56 | ±0.69 | ±0.82 | |
| Valine | 7.04 | 6.60 | 7.91 | 3.06 | 2.60 | 2.59 |
| ±3.22 | ±3.18 | ±4.44 | ±1.07 | ±0.69 | ±0.87 | |
1Further cysteine, glutamine, glutamic acid, and tyrosine are listed.
2The number of blood samples is smaller than the number of liver samples due to a too small volume of serum.
3Sum of amino acids, ammonia, and urea.
Chemical Analysis of Liver Tissue
The CF content in liver tissue confirmed the selection of the animals by clinical signs and the necropsy findings. Among the animals with HL (CF: 309 ± 77.4 g/kg DM), the CF content was almost twice than the CF content in liver tissue of NA (CF: 155 ± 71.8 g/kg DM). Also, the CP content in liver tissue differed between the groups, being higher among NA (651 ± 96.1 g/kg DM) and lower among animals with HL (591 ± 76.5 g/kg DM). Both the total amount of the single amino acids and the share of amino acids on CP indicated a great shift of the amino acid composition in liver tissue among the animals with HL in comparison with NA (Table 4). Most amino acids resulted in a lower amount among animals with HL and a higher amount among NA. Leucine, lysine, phenylalanine, and valine were similar in their amount between NA and animals with HL as was ammonia. One exception was the amount of histidine, which was higher among animals with HL than the amount in liver tissue of NA. With regards to the share on CP of amino acids, a different picture occurred. Arginine, glutamic acid, glycine, isoleucine, methionine, and proline were lower among the HL group than among NA. Histidine, leucine, lysine, and phenylalanine were higher among animals with HL. The share of ammonia on CP as well as threonine and valine were the same for NA and those animals with HL.
Table 4.
Crude protein, ammonia, and essential amino acid1 content in liver tissue.
| Amount (g/kg DM), Mean ± SD | Share (% on CP), Mean ± SD | |||||
|---|---|---|---|---|---|---|
| Item | NA2 (N = 31) | HL3 (N = 42) | P-value | NA2 (N = 31) | HL3 (N = 42) | P-value |
| CF4 | 155 | 309 | <0.01 | |||
| ±71.8 | ±77.4 | |||||
| CP5 | 651 | 591 | 0.01 | |||
| ±96.1 | ±76.5 | |||||
| Ammonia | 11.6 | 11.4 | 0.41 | 1.80 | 1.93 | 0.14 |
| ±2.00 | ±2.22 | ±0.29 | ±0.35 | |||
| Arginine | 43.1 | 35.6 | <0.01 | 6.63 | 6.03 | <0.01 |
| ±7.06 | ±4.16 | ±0.46 | ±0.30 | |||
| Cysteine | 8.81 | 7.04 | <0.01 | 1.36 | 1.20 | <0.01 |
| ±1.29 | ±0.92 | ±0.17 | ±0.13 | |||
| Glutamic acid | 89.0 | 76.4 | <0.01 | 13.7 | 13.0 | <0.01 |
| ±13.0 | ±7.81 | ±0.89 | ±0.99 | |||
| Glycine | 33.7 | 27.9 | <0.01 | 5.19 | 4.75 | <0.01 |
| ±4.60 | ±3.03 | ±0.30 | ±0.35 | |||
| Histidine | 18.4 | 23.4 | <0.01 | 2.83 | 3.92 | <0.01 |
| ±3.13 | ±5.42 | ±0.18 | ±0.49 | |||
| Isoleucine | ±29.7 | ±25.4 | <0.01 | 4.57 | 4.30 | <0.01 |
| ±4.07 | ±3.43 | ±0.24 | ±0.21 | |||
| Leucine | 57.6 | 56.3 | 0.59 | 8.86 | 9.50 | <0.01 |
| ±8.47 | ±9.01 | ±0.45 | ±0.51 | |||
| Lysine | 49.9 | 46.8 | 0.08 | 7.66 | 7.90 | <0.01 |
| ±7.51 | ±7.00 | ±0.38 | ±0.33 | |||
| Methionine | 14.6 | 10.2 | <0.01 | 2.24 | 1.75b | <0.01 |
| ±2.27 | ±1.03 | ±0.19 | ±0.18 | |||
| Phenylalanine | 31.9 | 31.5 | 0.69 | 4.90 | 5.30 | <0.01 |
| ±4.82 | ±5.23 | ±0.25 | ±0.31 | |||
| Proline | 28.6 | 24.5 | <0.01 | 4.39 | 4.16 | 0.01 |
| ±5.00 | ±3.12 | ±0.41 | ±0.24 | |||
| Threonine | 27.7 | 24.8 | <0.01 | 4.27 | 4.20 | 0.18 |
| ±3.82 | ±3.39 | ±0.20 | ±0.20 | |||
| Valine | 37.9 | 35.3 | 0.06 | 5.83 | 5.96 | 0.06 |
| ±5.77 | ±5.41 | ±0.38 | ±0.29 | |||
1Tryptophan is missing; further cysteine and glutamic acid are listed.
2NA = non-affected animals.
3HL = animals with hepatic lipidosis.
4CP = crude protein.
5CF = crude fat.
Correlations Between Amino Acids and CF Content in Liver Tissue
Except for cysteine and methionine (“moderate” negative correlation, P < 0.001), there are only “strong” and “very strong” negative correlations (P < 0.001) between CF and the different amino acid contents in livers with HL (Table 5). In the group of NA, there were “weak” negative correlations between CP (r (r = correlation coefficient): –0.37, P = 0.04) and CF content and histidine (r: –0.37, P = 0.04) and CF content. Referring to the share of amino acids and ammonia on CP, ammonia correlated “strongly” (r: 0.65, P < 0.01) and glutamic acid, glycine, methionine, and proline correlated “moderately” (r: 0.40 to 0.59, P ≤ 0.03) with the CF content in liver tissue among NA (Table 6). In the group of animals with HL, there were correlations between the CF content and amino acid share on CP but to a lesser extent compared to correlations between CF and the amino acid content. There was a “strong” negative correlation between histidine and CF (r: –0.61, P < 0.001) and a “strong” positive correlation between glutamic acid (r: 0.65, P < 0.001) and methionine (r: 0.61, P < 0.001) and CF. Cysteine (r: 0.44, P < 0.01) and glycine (r: 0.50, P < 0.001) correlated “moderately” positive with CF.
Table 5.
Correlations between crude fat and amino acid content in liver tissue.
| NA1 (N = 31) | HL2 (N = 42) | |||
|---|---|---|---|---|
| Item | C | P | C | P |
| CP | –0.37 | 0.04 | –0.90 | <0.01 |
| Ammonia | 0.11 | 0.55 | –0.63 | <0.01 |
| Arginine | –0.27 | 0.14 | –0.87 | <0.01 |
| Cysteine | –0.10 | 0.59 | –0.52 | <0.01 |
| Glutamic acid | –0.09 | 0.64 | –0.68 | <0.01 |
| Glycine | –0.20 | 0.28 | –0.76 | <0.01 |
| Histidine | –0.37 | 0.04 | –0.83 | <0.01 |
| Isoleucine | –0.27 | 0.14 | –0.92 | <0.01 |
| Leucine | –0.33 | 0.07 | –0.85 | <0.01 |
| Lysine | –0.30 | 0.10 | –0.88 | <0.01 |
| Methionine | –0.09 | 0.65 | –0.54 | <0.01 |
| Phenylalanine | –0.36 | 0.05 | –0.85 | <0.01 |
| Proline | –0.10 | 0.61 | –0.82 | <0.01 |
| Threonine | –0.26 | 0.16 | –0.88 | <0.01 |
| Valine | –0.36 | 0.05 | –0.86 | <0.01 |
1NA = non-affected animals.
2HL = animals with hepatic lipidosis.
C: Spearman's rank correlation coefficient, P: P-value
correlations: 0.00–0.19 “very weak”; 0.20–0.39 “weak”; 0.40–0.59 “moderate”; 0.60–0.79 “strong”; 0.80–1.0 “very strong.”
Table 6.
Correlations between crude fat content and amino acid share on crude protein in liver tissue.
| NA1 (N = 31) | HL2 (N = 42) | |||
|---|---|---|---|---|
| Item | C | P | C | P |
| Ammonia | 0.65 | <0.01 | 0.01 | 0.97 |
| Arginine | 0.01 | 0.96 | 0.36 | 0.02 |
| Cysteine | 0.35 | 0.05 | 0.44 | <0.01 |
| Glutamic acid | 0.59 | <0.01 | 0.65 | <0.01 |
| Glycine | 0.41 | 0.02 | 0.50 | <0.01 |
| Histidine | –0.14 | 0.44 | –0.61 | <0.01 |
| Isoleucine | 0.36 | 0.04 | –0.06 | 0.70 |
| Leucine | 0.13 | 0.50 | –0.33 | 0.03 |
| Lysine | 0.00 | 0.99 | –0.32 | 0.04 |
| Methionine | 0.58 | <0.01 | 0.61 | <0.01 |
| Phenylalanine | 0.01 | 0.95 | –0.40 | <0.01 |
| Proline | 0.40 | 0.03 | 0.30 | 0.05 |
| Threonine | 0.33 | 0.07 | –0.02 | 0.90 |
| Valine | 0.21 | 0.26 | –0.27 | 0.09 |
1NA = non-affected animals.
2HL = animals with hepatic lipidosis.
C: Spearman's rank correlation, P: P-value
correlations: 0.00–0.19 “very weak”; 0.20–0.39 “weak”; 0.40–0.59 “moderate”; 0.60–0.79 “strong”; 0.80–1.0 “very strong.”
Ammonia, Urea and Amino Acids in Blood samples
In general, the total amount of the constituent amino acids, ammonia, and urea in blood samples was higher in the group of animals with HL in the same way like the sum (av. 431 ± 110 mg/dL serum) of these compounds, which was more than 3 times higher than the sum among NA (av. 114 ± 17.2 mg/dL serum) (Table 7). On the other hand, with regard to the share of the individual amino acids, ammonia, and urea on the sum, a shift in the composition was noticeable. Especially noteworthy was the share of glutamine in the group of animals with HL, which was with an average of 24.7 ± 4.30% by far the greatest one. Among NA also the share of glutamine on the sum was with an average of 14.9 ± 2.08% the greatest, but markedly smaller than among animals with HL. More than half of the amino acids were lower in their share among the animals with HL; only lysine, methionine, and tyrosine were higher in their share like urea. Phenylalanine and threonine did not differ in their share between NA and those animals with HL. The amount of the BCAA consisting of isoleucine, leucine, and valine was higher among animals with HL (av. 22.0 ± 7.29 mg/dL serum) than the amount among NA (av. 9.38 ± 2.06 mg/dL serum, P < 0.01). The amount of AAA consisting of tryptophan, tyrosine, and phenylalanine was also higher in the group of animals with HL (av. 27.0 ± 8.18 mg/dL serum) than in the group of NA (av. 6.79 ± 1.30 mg/dL serum, P < 0.01). The share of AAA on the sum behaved similarly. In contrast, the share of BCAA on the sum was lower among animals with HL (av. 5.18 ± 1.38%) than among NA (av. 8.23 ± 1.71%, P < 0.01). The ratio of BCCA to AAA was lower among animals with HL with an average of 0.85 ± 0.26 than among NA with an average of 1.42 ± 0.40 (P < 0.01). There were no significant relations between the CF content in liver tissue and amino acid amounts in serum (Table 8), except for moderately negative correlations of ammonia and arginine with CF in the NA group and a weak negative correlation of ammonia with CF in the group of animals with HL. Regarding the share of amino acids on the sum (Table 9), among NA ammonia correlated “moderately” negative with the CF content in liver tissue and tryptophan “moderately” positive. Additionally, there were “strong” positive correlations between glutamine and tyrosine and the CF content. Among animals with HL, cysteine and histidine correlated “weakly” and glutamine “moderately” positive with CF, whereas methionine and phenylalanine correlated “weakly” negative with CF.
Table 7.
Essential amino acid,1 ammonia, and urea content in blood samples.
| Amount (mg/dL serum), Mean ± SD | Share (% of sum), Mean ± SD | |||||
|---|---|---|---|---|---|---|
| Item | NA2 (N4 = 28) | HL3 (N4 = 38) | P-value | NA2 (N4 = 28) | HL3 (N4 = 38) | P-value |
| Sum5 | 114 | 431 | <0.01 | |||
| ±17.2 | ±110 | |||||
| Ammonia | 13.3 | 27.7 | <0.01 | 11.2 | 6.42 | <0.01 |
| ±6.83 | ±10.8 | ±4.65 | ±1.52 | |||
| Urea | 0.80 | 3.93 | <0.01 | 0.71 | 0.96 | <0.01 |
| ±1.93 | ±1.67 | ±0.17 | ±0.48 | |||
| Arginine | 7.04 | 16.5 | <0.01 | 6.18 | 3.85 | <0.01 |
| ±1.27 | ±5.32 | ±0.963 | ±0.814 | |||
| Cysteine | 2.71 | 3.57 | <0.01 | 2.38 | 0.89 | <0.01 |
| ±0.57 | ±0.83 | ±0.49 | ±0.33 | |||
| Glutamine | 16.9 | 105 | <0.01 | 14.9 | 24.7 | <0.01 |
| ±2.01 | ±26.1 | ±2.08 | ±4.30 | |||
| Glutamic acid | 5.50 | 13.0 | <0.01 | 4.78 | 2.93 | <0.01 |
| ±1.36 | ±6.75 | ±0.86 | ±1.12 | |||
| Glycine | 4.70 | 16.3 | <0.01 | 4.12 | 3.85 | 0.01 |
| ±0.78 | ±3.85 | ±0.53 | ±0.38 | |||
| Histidine | 1.52 | 3.27 | <0.01 | 1.34 | 0.79 | <0.01 |
| ±0.31 | ±1.17 | ±0.24 | ±0.30 | |||
| Isoleucine | 1.80 | 4.56 | <0.01 | 1.58 | 1.08 | <0.01 |
| ±0.54 | ±1.50 | ±0.47 | ±0.31 | |||
| Leucine | 3.53 | 7.94 | <0.01 | 3.10 | 1.86 | <0.01 |
| ±0.68 | ±2.79 | ±0.55 | ±0.49 | |||
| Lysine | 4.47 | 33.5 | <0.01 | 3.89 | 7.40 | <0.01 |
| ±1.32 | ±14.3 | ±0.99 | ±2.13 | |||
| Methionine | 1.27 | 5.94 | <0.01 | 1.11 | 1.35 | <0.01 |
| ±0.35 | ±2.12 | ±0.28 | ±0.25 | |||
| Phenylalanine | 2.33 | 8.66 | <0.01 | 2.05 | 1.99a | <0.01 |
| ±0.30 | ±3.38 | ±0.26 | ±0.48 | |||
| Proline | 5.77 | 18.5 | <0.01 | 4.96 | 4.23 | <0.01 |
| ±2.2 | ±5.93 | ±1.47 | ±0.71 | |||
| Threonine | 6.28 | 22.8 | <0.01 | 5.51 | 5.38 | 0.32 |
| ±1.63 | ±5.82 | ±1.35 | ±0.69 | |||
| Tryptophan | 1.14 | 2.69 | <0.01 | 0.99 | 0.62 | <0.01 |
| ±0.67 | ±1.62 | ±0.58 | ±0.31 | |||
| Tyrosine | 3.33 | 15.6 | <0.01 | 2.91 | 3.61 | <0.01 |
| ±0.70 | ±4.49 | ±0.59 | ±0.60 | |||
| Valine | 4.05 | 9.53 | <0.01 | 3.55 | 2.25 | <0.01 |
| ±0.97 | ±3.04 | ±0.82 | ±0.59 | |||
1Further cysteine, glutamine, glutamic acid, and tyrosine are listed.
2NA = non-affected animals.
3HL = animals with hepatic lipidosis.
4The number of blood samples is smaller than the number of liver samples due to a too small volume of serum: 3 samples of NA and 4 samples of animals with HL are missing.
5Sum of amino acids, ammonia, and urea.
Table 8.
Correlations between crude fat content in liver tissue and amino acids in blood samples.
| Item | NA1 (N = 28) | HL2 (N = 38) | ||
|---|---|---|---|---|
| (mg/dL serum) | C | P | C | P |
| Sum3 | –0.44 | 0.02 | –0.27 | 0.10 |
| Ammonia | –0.48 | <0.01 | –0.39 | 0.02 |
| Urea | –0.22 | 0.25 | –0.06 | 0.71 |
| Arginine | –0.53 | <0.01 | –0.29 | 0.08 |
| Cysteine | 0.01 | 0.94 | 0.37 | 0.21 |
| Glutamine | 0.27 | 0.16 | –0.04 | 0.80 |
| Glutamic acid | –0.29 | 0.13 | –0.10 | 0.57 |
| Glycine | –0.36 | 0.06 | –0.22 | 0.18 |
| Histidine | –0.16 | 0.41 | 0.17 | 0.30 |
| Isoleucine | –0.27 | 0.17 | –0.19 | 0.27 |
| Leucine | –0.02 | 0.92 | –0.18 | 0.29 |
| Lysine | –0.08 | 0.68 | –0.26 | 0.11 |
| Methionine | –0.23 | 0.23 | –0.32 | 0.05 |
| Phenylalanine | –0.16 | 0.42 | –0.30 | 0.07 |
| Proline | –0.07 | 0.72 | –0.26 | 0.12 |
| Threonine | –0.19 | 0.33 | –0.18 | 0.27 |
| Tryptophan | 0.21 | 0.29 | –0.22 | 0.18 |
| Tyrosine | 0.18 | 0.36 | –0.30 | 0.07 |
| Valine | –0.17 | 0.39 | –0.16 | 0.33 |
1NA = non-affected animals.
2HL = animals with hepatic lipidosis.
3Sum of amino acids, ammonia, and urea.
C: Spearman's rank correlation, P: P-value
correlations: 0.00–0.19 “very weak”; 0.20–0.39 “weak”; 0.40–0.59 “moderate”; 0.60–0.79 “strong”; 0.80–1.0 “very strong.”
Table 9.
Correlations between crude fat content in liver tissue and share of amino acids on the sum1 in blood.
| Item | NA2 (N = 28) | HL3 (N = 38) | ||
|---|---|---|---|---|
| (% on sum) | C | P | C | P |
| Ammonia | –0.45 | 0.02 | –0.30 | 0.06 |
| Urea | –0.21 | 0.28 | 0.07 | 0.70 |
| Arginine | 0.10 | 0.63 | –0.23 | 0.17 |
| Cysteine | 0.33 | 0.08 | 0.39 | 0.02 |
| Glutamine | 0.63 | <0.01 | 0.48 | <0.01 |
| Glutamic acid | 0.05 | 0.80 | –0.07 | 0.67 |
| Glycine | 0.30 | 0.12 | 0.13 | 0.44 |
| Histidine | 0.18 | 0.35 | 0.38 | 0.02 |
| Isoleucine | –0.06 | 0.75 | –0.17 | 0.32 |
| Leucine | 0.36 | 0.06 | –0.19 | 0.24 |
| Lysine | 0.13 | 0.52 | –0.28 | 0.09 |
| Methionine | –0.04 | 0.83 | –0.35 | 0.03 |
| Phenylalanine | 0.35 | 0.07 | –0.35 | 0.03 |
| Proline | 0.10 | 0.62 | –0.03 | 0.84 |
| Threonine | 0.11 | 0.59 | 0.08 | 0.62 |
| Tryptophan | 0.48 | 0.01 | –0.23 | 0.16 |
| Tyrosine | 0.64 | <0.01 | 0.02 | 0.92 |
| Valine | 0.11 | 0.60 | –0.17 | 0.31 |
1Sum of amino acids, ammonia, and urea,
2NA = non-affected animals.
3HL = animals with hepatic lipidosis.
K: Spearman's rank correlation, P: P-value.
correlations: 0.00–0.19 “very weak”; 0.20–0.39 “weak”; 0.40–0.59 “moderate”; 0.60–0.79 “strong”; 0.80–1.0 “very strong.”
Reference Group
The 15 birds from the RG were 13 wk old at the time they were slaughtered. The average body weight was 9.30 ± 0.37 kg and the average liver weight was 115 ± 9.67 g; consequently, the liver's percentage of the body weight was 1.23 ± 0.10%. The CF content in liver tissue was 139 ± 12.4 g/kg DM and the CP content was 712 ± 33.7 g/kg DM (Table 10). Glutamic acid had the highest percentage in the amino acid pattern in liver tissue with 13.4 ± 0.31% on CP followed by leucine (8.93 ± 0.29% on CP) and lysine (7.79 ± 0.24% on CP). The sum of amino acids, ammonia, and urea in blood samples of the RG was 89 ± 10.4 mg/dL serum (Table 11). Glutamine had with 14.3 ± 1.63% on the sum the greatest percentage followed by ammonia (6.75 ± 0.55% on the sum), arginine (6.65 ± 0.69% on the sum), and threonine (6.26 ± 0.59% on the sum).
Table 10.
Crude fat, crude protein, ammonia, and essential amino acid1 content in liver tissue of the reference group (RG).
| Item | Amount (g/kg DM), Mean ± SD | Share (% on CP), Mean ± SD |
|---|---|---|
| RG2(N = 15) | RG2(N = 15) | |
| CF3 | 139 | |
| ±12.4 | ||
| CP4 | 712 | |
| ±33.7 | ||
| Ammonia | 12.6 | 1.77 |
| ±0.90 | ±0.10 | |
| Arginine | 47.5 | 6.67 |
| ±2.33 | ±0.21 | |
| Cysteine | 13.1 | 1.84 |
| ±0.75 | ±0.09 | |
| Glutamic acid | 95.6 | 13.4 |
| ±4.48 | ±0.31 | |
| Glycine | 37.6 | 5.29 |
| ±1.72 | ±0.15 | |
| Histidine | 19.3 | 2.71 |
| ±1.09 | ±0.11 | |
| Isoleucine | 34.4 | 4.84 |
| ±1.55 | ±0.14 | |
| Leucine | 63.5 | 8.93 |
| ±3.22 | ±0.29 | |
| Lysine | 55.4 | 7.79 |
| ±2.70 | ±0.24 | |
| Methionine | 16.4 | 2.30 |
| ±1.16 | ±0.12 | |
| Phenylalanine | 35.2 | 4.95 |
| ±1.60 | ±0.12 | |
| Proline | 31.1 | 4.37 |
| ±2.37 | ±0.30 | |
| Threonine | 29.9 | 4.21 |
| ±1.35 | ±0.13 | |
| Valine | 41.5 | 5.83 |
| ±1.93 | ±0.12 |
1Tryptophan is missing; further cysteine and glutamic acid are listed.
2RG = Reference group.
3CF = crude fat.
4CP = crude protein.
Table 11.
Essential amino acid,1 ammonia, and urea content in blood samples of the reference group (RG).
| Item | Amount (mg/dL serum), Mean ± SD | Share (% of sum), Mean ± SD |
|---|---|---|
| RG2 (N = 15) | RG2 (N = 15) | |
| Sum3 | 89.0 | |
| ±10.4 | ||
| Ammonia | 5.98 | 6.75 |
| ±0.66 | ±0.55 | |
| Urea | 1.57 | 1.40 |
| 0.21 | ±0.76 | |
| Arginine | 5.93 | 6.65 |
| ±1.00 | ±0.69 | |
| Cysteine | 2.61 | 2.96 |
| ±0.17 | ±0.29 | |
| Glutamine | 12.7 | 14.3 |
| 1.80 | 1.63 | |
| Glutamic acid | 3.46 | 3.93 |
| ±0.31 | ±0.46 | |
| Glycine | 4.68 | 5.27 |
| ±0.57 | ±0.35 | |
| Histidine | 1.14 | 1.26 |
| ±0.28 | ±0.20 | |
| Isoleucine | 1.46 | 1.62 |
| ±0.38 | ±0.30 | |
| Leucine | 2.66 | 2.96 |
| ±0.62 | ±0.47 | |
| Lysine | 3.06 | 3.39 |
| ±0.93 | ±0.76 | |
| Methionine | 0.97 | 1.08 |
| ±0.16 | ±0.10 | |
| Phenylalanine | 1.91 | 2.15 |
| ±0.27 | ±0.18 | |
| Proline | 4.79 | 5.31 |
| ±1.23 | ±0.86 | |
| Threonine | 5.57 | 6.26 |
| ±0.87 | ±0.59 | |
| Tryptophan | 1.58 | 1.76 |
| ±0.31 | ±0.25 | |
| Tyrosine | 3.61 | 4.08 |
| ±0.41 | ±0.37 | |
| Valine | 3.78 | 4.23 |
| ±0.73 | ±0.47 |
1Further cysteine, glutamine, glutamic acid, and tyrosine are listed.
2RG = Reference group,
3Sum of amino acids, ammonia, and urea.
DISCUSSION
Hepatic lipidosis in fattening turkeys occurs suddenly in a flock, remaining up to 10 D, and is accompanied by high mortality (Gazdzinski et al., 1994; Popp et al., 2014). Many reasons such as viral involvement and nutritional predisposing factors, especially the combination of high energy consumption and low protein diets with low lipotrophic factors, are discussed (Gazdzinski et al., 1994; Hazel, 2009; Popp et al., 2014). In avian species, the liver is the main site of de novo lipogenesis (Wang et al., 2017), where first fatty acids are transported by carnitine into mitochondria for oxidation and then formed triacylglycerols (TAG) are incorporated into very low density lipoproteins (VLDLs) before being transported to other tissues (Zubair and Leeson, 1996; Hafez and Hauck, 2005). The fatty liver disease of poultry is characterized by massive accumulation of TAG (Aziz, 2008) and arises when hepatic TAG formation exceeds VLDL synthesis and/or secretion (Gruffat et al., 1996).
Clinical Appearance and Necropsy
Both in previous investigated cases and in cases in this study, similar clinical signs of affected birds were observed. At necropsy, a typical macroscopically view of the liver with pale areas and hemorrhages was discovered. The selection of birds by clinical signs and the final diagnosis “hepatic lipidosis” and “non-affected animal” coincided and could be confirmed by chemical analysis of liver tissue, especially the CF content. Only 1 out of 24 turkeys without clinical signs during the investigation of HL cases had macroscopically and chemically analyzed fatty liver and 8 out of 49 turkeys with clinical signs had no macroscopically and chemically analyzed fatty liver. The entire flock was not affected by HL, but, in fact, the NA group was rather comparable with the RG with regards to many results in this study concerning the CF content in liver tissue (RG: 139 ± 12.4, NA: 155 ± 71.8, and HL: 309 ± 77.4 g/kg DM) and amino acid metabolism. This suggests a fast development of the disease HL.
Body Condition and Different Cases
The average body weight did not differ between NA and animals with HL, but the liver weight as well as the liver`s percentage of body weight was higher in the group of animals with HL. Consequently, no relationship between body weight and the development of HL could be observed in this study neither were the heavy or light animals of a herd particularly affected. On the other hand, regarding the 3 different flocks, there were differences between the average body and liver weight. The birds in flock 2 had the lowest body and liver weight with the lowest animal losses due to HL. Additionally, the CF content in liver tissue was lowest in flock 2 and some amino acid contents were higher among flock 2 than among flock 3 but not different from flock 1. However, the birds from flock 2 were also the youngest animals and they were from a different genetic than the birds from flock 1 and 3. Moreover, there were very few differences in amino acid contents and their share on the sum of amino acids, ammonia, and urea in blood samples between the 3 flocks.
Sulphurous Amino Acids
In this study, methionine content in liver tissue was lower among animals with HL than among NA. In contrast, in blood samples, methionine was higher among animals with HL than among NA. Against this background the share of methionine on CP in liver tissue of animals with HL was “strongly” positive correlated with the CF content in liver tissue. Methionine is a precursor for carnitine (Alizadeh et al., 2011), plays an important role in VLDL secretion (Gruffat et al., 1996), and is therefore involved in the removal of fat from the liver (Peng et al., 2018). Several studies have reported significant increases in abdominal fat after feeding broilers a methionine-deficient diet (Corzo and Kidd, 2003; Yao et al., 2006; Zhan et al., 2006; Opoola et al., 2012) and a reduction in liver weight due to methionine supplementation (Jariyahatthakij et al., 2018). The low methionine content in liver tissue with concurrently high level of methionine in blood samples among the animals with HL could suggest an increased mobilization and usage (Ma et al., 2018). The results of cysteine were similar to those of methionine, being lowest in liver tissue among animals with HL and highest in blood samples. Besides the aspects mentioned above, the sulfurous amino acids are also interesting for other reasons concerning fatty liver disease. With regards to human medical research, fatty liver is associated with insulin resistance, oxidative stress, and in further disease progression, inflammation with the participation of several cytokines, and acute phase proteins (Allard et al., 2008; Lau et al., 2017). Hunter and Grimble (1994) mentioned that the demand for sulfur-containing amino acids may increase under the influence of cytokines. Moreover, cysteine is an element of glutathione, one of the most important antioxidants in the organism and is needed in case of oxidative stress. High levels of cysteine in plasma were also described among patients with liver disease and may be the consequence of a higher rate of turnover of glutathione (Kalhan et al., 2011)
Aromatic and Branched-chain Amino Acids
Animals with HL had a noticeably decreased BCAA to AAA ratio (0.85 ± 0.26) due to the markedly increased levels of AAA compared to NA (1.42 ± 0.40). The amount of BCAA was higher among animals with HL than among NA. A decreased serum ratio of BCAAs to AAAs is a hallmark of liver cirrhosis among human patients with liver disease and decreases with its progression (Kawaguchi et al., 2011). This lower ratio is also associated with hepatic encephalopathy and favors the entry of AAA into the brain (James et al., 1979). In this context, another study also demonstrates a decreased BCAA to AAA ratio during sepsis and stress (Vente et al., 1989). High levels of BCAA are also reported in human patients with non-alcoholic fatty liver disease (Goffredo et al., 2017) and are used as biomarkers to predict obesity, insulin resistance, and type 2 diabetes (Nie et al., 2018). A recent study showed decreased abdominal fat in broiler chickens with increasing levels of leucine and valine in low protein diets (Ospina-Rojas et al., 2017). The AAA in blood samples in the group of animals with HL were about 4 times higher than in the group of NA, whereby tyrosine constituted the major share together with phenylalanine. In their share of the sum in blood, only tyrosine was highest among animals with HL, phenylalanine did not differ between NA and those animals with HL, and tryptophan was highest among NA. Aromatic amino acids are precursors of neurotransmitters (Basler et al., 2002) and compete among each other and with, for example, BCAA for the active, concentration-dependent transport across the blood-brain barrier (Birkl et al., 2017). The degree of AAA elevation in blood, especially tyrosine, can be used to predict the extent of hepatic necrosis (Rosen et al., 1977) and can lead to an derangement of normal neurotransmission (Cascino et al., 1978). The clinical signs like coordination difficulties and apathy together with the high levels of AAA and the decreased ratio of BCAA to AAA in blood samples of animals suffering from HL could suggest an involvement of neurological disorders in HL.
Amino Acid patterns in Blood and Liver
Overall, the contents of essential amino acids in liver tissue were lower among animals with HL than among NA, except for histidine. In blood samples, the contents were higher among animals with HL than among NA. The high levels of free essential plasma amino acids among animals with HL suggest a higher rate of whole body protein turnover (Kalhan et al., 2011) and were observed during reduced feed intake (Noda, 1975; Chance et al., 1988; Walker, 2009) but also in birds fed low protein diets (Aftab et al., 2006). Remus and Firman (1991) reported an increase in liver glutamic acid simultaneously with an increase in muscle catabolism. This could not be found in the present study. In contrast, the content of glutamic acid in liver tissue of animals with HL was lower. Glutamine in blood samples was with an average of 105 mg/dL among animals with HL more than 6 times higher than among NA (av. 16.9 mg/dL) and had the highest share with 24.7% of the sum of amino acids, urea, and ammonia within the group of HL. On the one hand, glutamine is important for immune cell function and inflammation response (Newsholme, 2001; Wu et al., 2018) and can be elevated during catabolic stress (Wilmore and Shabert, 1998). On the other hand, several studies have reported increased levels of glutamine in plasma of ketoacidotic and hyperglycemic patients (Newsholme, 2001; Biolo et al., 2008). Histidine is the only amino acid, whose amount in liver tissue was higher among animals with HL than among NA. The share of histidine on CP in liver tissue was also higher among animals with HL than among NA. Lee et al. (2005) reported increased histidine concentrations in plasma and organs of diabetic mice and postulated an improvement in antioxidant activity and insulin restoration via histidine supplementation. Considering the elevated ammonia levels in blood of animals with HL and the high concentration of glutamine together with the function of histidine as a possible inhibitor of mitochondrial glutamine transporter (Rao et al., 2010), histidine may play an important mediatory role among animals with HL in reducing oxidative stress.
Overall, there were great differences between the groups in their amino acid pattern both in liver tissue and blood samples. With regards to the share of the amino acids on CP content in liver tissue, the “non-affected” animals were comparable with healthy slaughtered animals (see Tables 10 and 11). A large part of the other results like the amino acid amounts and their share on the sum in blood samples and also the ratio of BCAA to AAA among NA were similar to results of the RG or were in between the results of animals with HL and RG. This could suggest an early alteration in the metabolism of protein and amino acids among NA. In the group of animals suffering from HL, a high release of free amino acids or protein catabolism could be recognized. The possible involvement of an inflammatory process and oxidative stress needs to be investigated in greater detail as well as a possible effect of the early use of low protein diets during a fattening period with high energy content as a predisposing factor for HL. On the other hand, the analysis of the 3 case diets gave no indication of deficits or peculiarities of individual nutrients. There were also no major differences to the diet of the RG. It might be useful in future studies to investigate amino acid content in muscle of affected and non-affected animals to illuminate the protein deposition and turnover more closely. Further research is needed to clarify whether there is an increased requirement on individual amino acids or whether a specific function is/was impaired by HL.
ACKNOWLEDGMENTS
This study was supported by the QS Science Fund. We would like to thank the farmers for providing us with the animals, the veterinarians for their great cooperation and many colleagues for helping during sample collection. Furthermore, we would like to thank Ilona Schoan and Simone Möbus for their support in analyzing the samples and Frances Sherwood-Brock for proofreading the manuscript to ensure correct English.
REFERENCES
- Aftab U., Ashraf M., Jiang Z.. 2006. Low protein diets for broilers. Worlds Poult. Sci. J. 62:688–701. [Google Scholar]
- Alizadeh M., Farzanfar A., Nafisi-Bahabadi M.. 2011. The effect of probiotic Bioplus 2B on growth performance and carcass composition of rainbow trout, Oncorhynchus mykiss (Walbaum, 1792) larvae. Indian J. Fish. 58:55–59. [Google Scholar]
- Allard J. P., Aghdassi E., Mohammed S., Raman M., Avand G., Arendt B. M., Jalali P., Kandasamy T., Prayitno N., Sherman M., Guindi M., Ma D. W., Heathcote J. E.. 2008. Nutritional assessment and hepatic fatty acid composition in non-alcoholic fatty liver disease (NAFLD): a cross-sectional study. J. Hepatol. 48:300–307. [DOI] [PubMed] [Google Scholar]
- Alloui N., Bouhentala S., Lanani I., Omar B., Ammar A.. 2015. Clinical and histopathological observations of turkey hepatic lipidosis in the ain touta area (Algeria): a preliminary report. Asian J. Anim. Sci. 9:167–171. [Google Scholar]
- Aziz T. 2008. Hepatic lipidosis in turkeys. World Poult. 24:28–29 [Google Scholar]
- Basler T., Meier-Hellmann A., Bredle D., Reinhart K.. 2002. Amino acid imbalance early in septic encephalopathy. Intensive Care Med. 28:293–298. [DOI] [PubMed] [Google Scholar]
- Biolo G., De Cicco M., Lorenzon S., Dal Mas V., Fantin D., Paroni R., Barazzoni R., Zanetti M., Iapichino G., Guarnieri G.. 2008. Treating hyperglycemia improves skeletal muscle protein metabolism in cancer patients after major surgery. Crit. Care Med. 36:1768–1775. [DOI] [PubMed] [Google Scholar]
- Birkl P., Kjaer J. B., Szkotnicki W., Forsythe P., Harlander-Matauschek A.. 2017. Acute tryptophan depletion: the first method validation in an avian species (Gallus gallus domesticus). Poult. Sci. 96:3021–3025. [DOI] [PubMed] [Google Scholar]
- Butler E. J. 1976. Fatty liver diseases in the domestic fowl — A review. Avian Pathol. 5:1–14. [DOI] [PubMed] [Google Scholar]
- Cascino A., Cangiano C., Calcaterra V., Rossi-Fanelli F., Capocaccia L.. 1978. Plasma amino acids imbalance in patients with liver disease. Digest. Dis. Sci. 23:591–598. [DOI] [PubMed] [Google Scholar]
- Chance W. T., Cao L. Q., Nelson J. L., Foleynelson T., Fischer J. E.. 1988. Hyperammonemia in anorectic tumor-bearing rats. Life Sci. 43:67–74. [DOI] [PubMed] [Google Scholar]
- Corzo A., Kidd M.. 2003. Arginine needs of the chick and growing broiler. Int. J. Poult. Sci. 2:379–382. [Google Scholar]
- Donnelly K. L., Smith C. I., Schwarzenberg S. J., Jessurun J., Boldt M. D., Parks E. J.. 2005. Sources of fatty acids stored in liver and secreted via lipoproteins in patients with nonalcoholic fatty liver disease. J. Clin. Invest. 115:1343–1351. [DOI] [PMC free article] [PubMed] [Google Scholar]
- Gallazzi D., Manarolla G., Rampin T., Saita M., Sironi G.. 2007. Hepatic lipidosis in turkeys: beyond the current pathogenetic hypothesis. Proceedings of 56th WesternPoultry Disease Conference, Las Vegas, USA, 122–124. [Google Scholar]
- Garcia Neto M., Pesti G., Bakalli R.. 2000. Influence of dietary protein level on the broiler chicken's response to methionine and betaine supplements. Poult. Sci. 79:1478–1484. [DOI] [PubMed] [Google Scholar]
- Gazdzinski P., Squires E., Julian R.. 1994. Hepatic lipidosis in turkeys. Avian Dis. 38:379–384. [PubMed] [Google Scholar]
- Goffredo M., Santoro N., Trico D., Giannini C., D’Adamo E., Zhao H., Peng G., Yu X., Lam T. T., Pierpont B., Caprio S., Herzog R. I.. 2017. A branched-chain amino acid-related metabolic signature characterizes obese adolescents with non-alcoholic fatty liver disease. Nutrients 9:642. [DOI] [PMC free article] [PubMed] [Google Scholar]
- Gruffat D., Durand D., Graulet B., Bauchart D.. 1996. Regulation of VLDL synthesis and secretion in the liver. Reprod. Nutr. Dev. 36:375–389. [DOI] [PubMed] [Google Scholar]
- Hafez H., Hauck R.. 2005. Genetic selection in turkeys and broilers and their impact on health conditions. In World Poultry Science Association, 4th, European Poultry Genetics Symposium, Dubrownik, Croatia. [Google Scholar]
- Harms R. H., Arafa A. S., Simpson C. F., Miles R. D.. 1982. Influence of protamone(R) on fatty liver syndrome in commercial laying hens. Poult. Sci. 61:2370–2374. [DOI] [PubMed] [Google Scholar]
- Hazel K. 2009. Hepatic lipidosis: is carnitine deficiency the underlying cause. Pages 271–276. Proceedings of the 5th International Meeting of the Working Group 10 (Turkey) of WPSAHafez H. M. (Ed.), Turkey production: toward better welfare and health Berlin: Mensch & Buch Verlag; ISBN. 978-3-86664-701-5. [Google Scholar]
- Hunter E. A., Grimble R. F.. 1994. Cysteine and methionine supplementation modulate the effect of tumor necrosis factor alpha on protein synthesis, glutathione and zinc concentration of liver and lung in rats fed a low protein diet. J. Nutr. 124:2319–2328. [DOI] [PubMed] [Google Scholar]
- James J. H., Jeppsson B., Ziparo V., Fischer J.. 1979. Hyperammonaemia, plasma aminoacid imbalance, and blood-brain aminoacid transport: a unified theory of portal-systemic encephalopathy. Lancet North Am. Ed. 314:772–775. [DOI] [PubMed] [Google Scholar]
- Jariyahatthakij P., Chomtee B., Poeikhampha T., Loongyai W., Bunchasak C.. 2018. Effects of adding methionine in low-protein diet and subsequently fed low-energy diet on productive performance, blood chemical profile, and lipid metabolism-related gene expression of broiler chickens. Poult. Sci. 97:2021–2033. [DOI] [PubMed] [Google Scholar]
- Kalhan S. C., Guo L., Edmison J., Dasarathy S., McCullough A. J., Hanson R. W., Milburn M.. 2011. Plasma metabolomic profile in nonalcoholic fatty liver disease. Metabolism 60:404–413. [DOI] [PMC free article] [PubMed] [Google Scholar]
- Kawaguchi T., Izumi N., Charlton M. R., Sata M.. 2011. Branched-chain amino acids as pharmacological nutrients in chronic liver disease. Hepatology 54:1063–1070. [DOI] [PubMed] [Google Scholar]
- Lau J. K., Zhang X., Yu J.. 2017. Animal models of non-alcoholic fatty liver disease: current perspectives and recent advances. J. Pathol. 241:36–44. [DOI] [PMC free article] [PubMed] [Google Scholar]
- Lee Y. T., Hsu C. C., Lin M. H., Liu K. S., Yin M. C.. 2005. Histidine and carnosine delay diabetic deterioration in mice and protect human low density lipoprotein against oxidation and glycation. Eur. J. Pharmacol. 513:145–150. [DOI] [PubMed] [Google Scholar]
- Ma B., He X., Lu Z., Zhang L., Li J., Jiang Y., Zhou G., Gao F.. 2018. Chronic heat stress affects muscle hypertrophy, muscle protein synthesis and uptake of amino acid in broilers via insulin like growth factor-mammalian target of rapamycin signal pathway. Poult Sci. 97:4150–4158. [DOI] [PubMed] [Google Scholar]
- Manarolla G., Saita M., Gallazzi D., Sironi G., Rampin T.. 2011. Histological and histochemical investigations on hepatic lipidosis in turkeys. Arch. Geflügelkd 75:56–60. [Google Scholar]
- Möhle H., Windhaus H.. 2016. Ein neuer Impfansatz im Test. DGS Magazine 22/2016:33–36. [Google Scholar]
- Naumann C., Bassler R.. 2012. Methoden der landwirtschaftlichen Forschungs-und Untersuchungsanstalt, Biochemische Untersuchung von Futtermitteln. Methodenbuch III (einschließlich der achten Ergänzungen)VDLUFA, Darmstadt, Germany. [Google Scholar]
- Newsholme P. 2001. Why is L-glutamine metabolism important to cells of the immune system in health, postinjury, surgery or infection?. J. Nutr. 131:2515S–2522S. [DOI] [PubMed] [Google Scholar]
- Nie C., He T., Zhang W., Zhang G., Ma X.. 2018. Branched chain amino acids: beyond nutrition metabolism. Int. J. Mol. Sci. 19:954. [DOI] [PMC free article] [PubMed] [Google Scholar]
- Noda K. 1975. Possible effect of blood ammonia on food intake of rats fed amino acid imbalanced diets. J. Nutr. 105:508–516. [DOI] [PubMed] [Google Scholar]
- Opoola E., Bawa G., Ogundipe S., Ajide S., Abejide O.. 2012. Effect of varying levels of methionine on, growth response, tissue fat and protein of broiler chickens raised in the cool seaceson under tropical environment. Niger. J. Anim. Sci. 14:62–70. [Google Scholar]
- Ospina-Rojas I. C., Murakami A. E., Duarte C. R., Nascimento G. R., Garcia E. R., Sakamoto M. I., Nunes R. V.. 2017. Leucine and valine supplementation of low-protein diets for broiler chickens from 21 to 42 days of age. Poult. Sci. 96:914–922. [DOI] [PubMed] [Google Scholar]
- Peng J. L., Bai S. P., Wang J. P., Ding X. M., Zeng Q. F., Zhang K. Y.. 2018. Methionine deficiency decreases hepatic lipid exportation and induces liver lipid accumulation in broilers. Poult. Sci. 97:4315–4323. [DOI] [PubMed] [Google Scholar]
- Popp C., Hauck R., Vahlenkamp T. W., Luschow D., Kershaw B. O., Hoferer M., Hafez H. M.. 2014. Liver pathology associated with increased mortality in turkey breeder and meat turkey flocks. Avian Dis. 58:474–481. [DOI] [PubMed] [Google Scholar]
- Rao K. V. R., Reddy P. V., Tong X., Norenberg M. D.. 2010. Brain edema in acute liver failure. Am. J. Pathol. 176:1400–1408. [DOI] [PMC free article] [PubMed] [Google Scholar]
- Remus J. C., Firman J. D.. 1991. The effect of thiamin deficiency on amino acids in the brain, liver, and plasma of the turkey. Poult. Sci. 70:2345–2353. [DOI] [PubMed] [Google Scholar]
- Rosen H. M., Yoshimura N., Hodgman J. M., Fischer J. E.. 1977. Plasma amino acid patterns in hepatic encephalopathy of differing etiology. Gastroenterology 72:483–487. [PubMed] [Google Scholar]
- Sieverding E. 2015. Fettstoffwechsel im Lot halten. DGS Magazine 10/2015:18–21. [Google Scholar]
- Vente J. P., von Meyenfeldt M. F., van Eijk H. M., van Berlo C. L., Gouma D. J., van der Linden C. J., Soeters P. B.. 1989. Plasma-amino acid profiles in sepsis and stress. Ann. Surg. 209:57–62. [DOI] [PMC free article] [PubMed] [Google Scholar]
- Visscher C., Middendorf L., Günther R., Engels A., Leibfacher C., Möhle H., Düngelhoef K., Weier S., Haider W., Radko D.. 2017. Fat content, fatty acid pattern and iron content in livers of turkeys with hepatic lipidosis. Lipids Health Dis. 16:98. [DOI] [PMC free article] [PubMed] [Google Scholar]
- Walker V. 2009. Ammonia toxicity and its prevention in inherited defects of the urea cycle. Diabetes Obes. Metab. 11:823–835. [DOI] [PubMed] [Google Scholar]
- Wang G., Kim W. K., Cline M. A., Gilbert E. R.. 2017. Factors affecting adipose tissue development in chickens: a review. Poult. Sci. 96:3687–3699. [DOI] [PubMed] [Google Scholar]
- Weier S. 2016. Die hepatische lipidose der Pute-Übersicht über die erkrankung und hypothesen zur pathogenese. Praktische Tierarzt-Hannover 97:1021–1025. [Google Scholar]
- Wilmore D. W., Shabert J. K.. 1998. Role of glutamine in immunologic responses. Nutrition 14:618–626. [DOI] [PubMed] [Google Scholar]
- Wu Q. J., Liu N., Wu X. H., Wang G. Y., Lin L.. 2018. Glutamine alleviates heat stress-induced impairment of intestinal morphology, intestinal inflammatory response, and barrier integrity in broilers. Poult. Sci. 97:2675–2683. [DOI] [PubMed] [Google Scholar]
- Yao J., Li S., Zhong L., Huang S., Zhang W., Xi H.. 2006. The relative effectiveness of liquid methionine hydroxy analogue compared to DL-methionine in broilers. Asian Australas. J. Anim. Sci 19:1026–1032. [Google Scholar]
- Zhan X. A., Li J. X., Xu Z. R., Zhao R. Q.. 2006. Effects of methionine and betaine supplementation on growth performance, carcase composition and metabolism of lipids in male broilers. Br. Poult. Sci. 47:576–580. [DOI] [PubMed] [Google Scholar]
- Zhang S., Saremi B., Gilbert E. R., Wong E. A.. 2017. Physiological and biochemical aspects of methionine isomers and a methionine analogue in broilers. Poult. Sci. 96:425–439. [DOI] [PubMed] [Google Scholar]
- Zubair A., Leeson S.. 1996. Compensatory growth in the broiler chicken: a review. Worlds Poult. Sci. J. 52:189–201. [Google Scholar]