

Abstract
Background:
Palliative Care is an essential component of comprehensive care of patients with intracerebral hemorrhage (ICH). In the present study, we sought to characterize the variability of palliative care use after ICH among US hospitals.
Methods:
ICH admissions from hospitals with at least 12 annual ICH cases were identified in the Nationwide Inpatient Sample between 2008 and 2011. We used multilevel logistic regression modeling to estimate between-hospital variance in palliative care use. We calculated the intraclass correlation coefficient (ICC), proportional variance change, and median odds ratio after accounting for individual-level and hospital-level covariates.
Results:
Among 26,791 ICH admissions, 12.5% received palliative care (95% CI 11.5–13.5). Among the 629 included hospitals, the median rate of palliative care use was 9.1 (IQR 1.5–19.3) per 100 ICH admissions, and 150 (23.9%) hospitals had no recorded palliative care use. The ICC of the random intercept (null) model was 0.274, suggesting that 27.4% of the overall variability in palliative care use was due to between-hospital variability. Adding hospital-level covariates to the model accounted for 25.8% of the between-hospital variance observed in the null model, with 74.2% of between-hospital variance remaining unexplained. The median odds ratio of the fully adjusted model was 2.62 (95% CI 2.41–2.89), indicating that a patient moving from one hospital to another with a higher intrinsic propensity of palliative care use had a 2.63-fold median increase in the odds of receiving palliative care, independent of patient and hospital factors.
Conclusions:
Substantial variation in palliative care use after ICH exists among US hospitals. A substantial proportion of this between-hospital variability remains unexplained even after accounting for patient and hospital characteristics.
Keywords: palliative care, end-of-life care, terminal care, multilevel model, cerebral hemorrhage
Introduction
Intracerebral hemorrhage (ICH) is a leading cause of mortality, with case-fatality rates as high as 50%(1, 2). Palliative care is a multi-disciplinary approach to specialized medical and nursing care aimed at improving quality of life in the setting of life-threatening illness. Because of the high mortality rates after ICH, often within days or weeks after onset, early integration of palliative care into clinical care for ICH patients has been endorsed by major professional societies(3–5), and access to palliative and end-of-life care has been recognized as an important component of high-quality stroke care(4, 6).
Previous studies aiming to identify predictors of palliative care use after stroke and ICH have largely focused on differences between individuals by analysis of individual patient/discharge records alone(7–9); however, hospitals caring for ICH patients differ in numerous geographical, structural, administrative, and local care culture characteristics. Between-hospital variability in palliative care use after ICH has not previously been investigated, and, at present, the variability in palliative care use after ICH in the US is unknown. In addition, it not known to what degree, if any, hospital characteristics contribute to explain between-hospital differences in palliative care use.
In the present study, we sought to understand the between-hospital variation in palliative care use after ICH among US hospitals. We employed a multilevel modeling approach to quantify between-hospital differences in palliative care use. Thereby, we aimed to 1) quantify between-hospital variability after ICH; 2) identify patient-level and hospital-level characteristics associated with palliative care use; and 3) determine whether between-hospital variation in palliative care use after ICH is driven by individual or hospital characteristics. Identifying hospitals underutilizing palliative care resources and determining barriers to palliative care use at the hospital level may inform future strategies aimed at improving universal access to palliative care resources for stroke patients.
Methods
Data source
Data were obtained from the Nationwide Inpatient Sample (NIS)(10). The NIS is the largest all-payer inpatient database in the US, representing a 20% stratified sample of all admissions to non-federal US hospitals. All diagnoses and procedures are recorded using International Classification of Diseases version 9 Clinical Modification (ICD9-CM) codes. This study was exempt from institutional review board approval.
Case and hospital selection
We identified adult cases with a primary diagnosis of non-traumatic ICH by using ICD9-CM code 431 between 2008 and 2011. We excluded cases with a secondary ICD9-CM code for arteriovenous malformation, traumatic brain injury, malignant brain tumor, and those undergoing aneurysm clipping and coiling to restrict our population to those with primary ICH. Only admissions to hospitals with at least 12 annual ICH cases were included. For hospitals that were sampled in multiple years, only the most recent sampling instance was included. The unit of observation in NIS is discharge after hospitalization. In order to prevent double counting of transferred patients cases transferred to another hospital were excluded, while cases transferred in from another hospital were included. This algorithm identifies ICH with high sensitivity and specificity(11). Cases with missing information on age, sex, race/ethnicity, insurance status, and hospital characteristics were excluded (Supplemental Figure 1).
Outcome of interest
The outcome of interest was use of palliative care resources as identified by ICD9-CM code V66.7. This code identifies documented use of palliative care measures(12), irrespective of the delivery mode (i.e. via a palliative care consultation service or integrated into routine clinical practice by the care team). The Coding Clinic first addressed the code V66.7 in 1996, and in 1998, the Coding Clinic(12) provided additional clarification regarding the use of code V66.7 (Vol. 15, No. 1, p. 11): “Terms such as comfort care, end-of-life care, and hospice care are all synonymous with palliative care and these, or similar terms, need to be written in the record to support the use of code V66.7. The physician should be queried if the treatment record seems to indicate that palliative care is being given but the documentation is unclear. The care provided must be aimed only at relieving pain and discomfort for the palliative care code to be applicable”(12). ICD9-CM code V66.7 has previously been shown to accurately identify care withdrawal in stroke patients with 81% sensitivity and 97% specificity(13).
Comorbidity and severity adjustment
Comorbidities were measured using a modified Charlson comorbidity index(14, 15). Case severity was determined using the All Patient Refined-Diagnosis Related Groups (APR-DRGs), derived from age, primary and secondary diagnoses, and procedures. The APR-DRG algorithm is a validated and reliable indicator of mortality, and is commonly used as a severity indicator in studies relating to stroke(16).
Individual-level (level 1) and hospital-level (level 2) characteristics
The following level 1 patient characteristics were included: age, sex, race, modified Charlson Comorbidity Index, APR-DRG severity subclass, and insurance status. Hospital-level (level 2) covariates included hospital region (Northeast, Midwest, South, and West), hospital location (rural vs. urban), hospital teaching status, hospital bed size, hospital control (Government, not-for-profit private, and investor-owned private), hospital annual ICH case volume, hospital proportion of minority ICH patients, and hospital rates for prolonged intubation, gastrostomy, tracheostomy, and ventriculostomy per 100 ICH cases.
Multilevel modelling and statistical analysis
Baseline characteristics of individual (level 1) and hospital (level 2) variables were compared using Pearson chi-square test for categorical variables and Wilcoxon rank sum test for continuous variables, stratified by palliative care use in hospitals and individuals. To explore the between-hospital variability of palliative care use, we generated the frequency distribution of palliative care use among all included hospitals(17). Multilevel multivariable logistic regression modeling was employed to 1) account for non-random clustering of individuals within hospitals; 2) characterize the between-hospital variability of palliative care after ICH; and 3) estimate whether differences in palliative care use between hospitals are due to individual-level (level 1) or hospital-level (level 2) characteristics. First, an intercept-only (null) model was fitted with a random intercept for hospitals, but without any other covariates (Model 0). This model serves as baseline model to assess the variability of palliative care use due to between-hospital variability and allows comparison to subsequent models containing potential explanatory covariates. Model 1 includes individual-level (level 1), and Model 2 includes hospital-level (level 2) variables; covariates were added as fixed effects variables to assess the residual variation between hospitals. The fully adjusted model includes both level 1 and level 2 covariates (Model 3).
Measures of between-hospital variation in palliative care use include the intraclass correlation coefficient (ICC), the proportional change in variance, and median odds ratio (MOR). The ICC is the proportion of variance of the outcome attributable to between-hospital variability(18). The proportional variance change is the percent change of between-hospital variance compared to the null model (Model 0)(19). The MOR is defined as the median of a set of odds ratios that could be obtained by comparing two patients with identical patient-level characteristics from two randomly chosen hospitals(18–20). The MOR can be interpreted as the median increase in odds of palliative care use when moving from a hospital with lower to a hospital with higher propensity for palliative care, adjusting for other covariates in the model.
Statistical analysis was performed using Stata version 15 (Stata Statistical Software: Release 15. College Station, TX). A p-value of <0.05 was considered statistically significant, and 95% confidence intervals are reported.
Results
Hospital and patient characteristics
A total of 26,791 admissions in 629 hospitals with at least 12 annual ICH cases met inclusion criteria (Supplemental Figure 1). Among the 629 included hospitals, the median rate of palliative care use was 9.1 (IQR 1.5–19.3) per 100 ICH admissions. Figure 1 shows the rank order of palliative care use among all included hospitals with at least 12 annual ICH cases from lowest to highest. Of all hospitals, 150 (23.9%) hospitals had no recorded palliative care use, and an additional 199 (31.6%) hospitals had palliative care use rates below the study mean.
Figure 1.
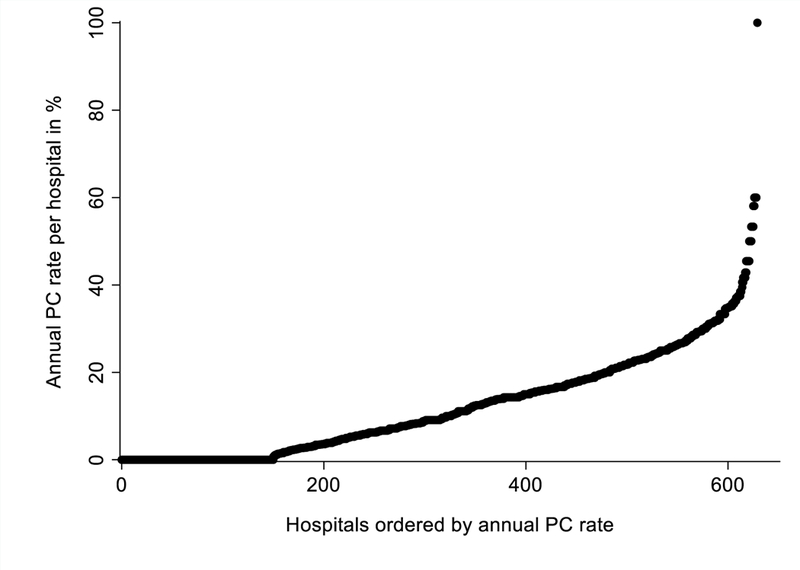
Hospital rank order of the annual frequency of palliative care use in patients with intracerebral hemorrhage (ICH) in hospitals with ≥12 ICH admissions per year. PC: Palliative care.
Compared to hospitals with palliative care use below the median, hospitals using palliative care at or above the median had a lower median percentage of ethnic minority patients (24.3% vs. 35.6, p<0.001; Table 1). Similarly, hospitals with higher use of palliative care had lower median rates of gastrostomy (7.1 vs. 9.1 per 100 cases, p<0.001), tracheostomy (2.4 vs. 3.5 per 100 cases, p=0.006), and prolonged intubation (7.4 vs. 8.3 per 100 cases, p=0.010) when compared to hospitals with lower palliative care use, while median mortality rates were higher (25.4 vs 24.0 per 100 cases, p=0.006). Other hospital characteristics and procedure rates, stratified by hospital palliative care use, are shown in Table 1. Supplemental Figure 2 shows a graphic representation of the association between hospital palliative care use and hospital-level utilization of common inpatient procedures and mortality after ICH (one hospital with 100% palliative care use was excluded for this analysis).
Table 1.
Characteristics of hospitals with at least 12 annual ICH cases, stratified by hospital use of palliative care (PC) above and below the median of 9.1 per 100 ICH admissions.
| Hospital characteristics | All Hospitals (n=629) |
Hospitals with PC use <median (n=301) |
Hospitals with PC use ≥median (n=328) |
P-value |
|---|---|---|---|---|
| Teaching Hospital – n (%) | 326 (51.8) | 159 (52.8) | 167 (50.9) | 0.63 |
| Hospital Region – n (%) | 0.023 | |||
| Northeast | 133 (21.1) | 76 (25.2) | 57 (17.4) | |
| Midwest | 101 (16.1) | 43 (14.3) | 58 (17.7) | |
| South | 237 (37.7) | 118 (39.2) | 119 (36.3) | |
| West | 158 (25.1) | 64 (21.3) | 94 (28.7) | |
| Hospital Location – n (%) | 0.088 | |||
| Rural | 23 (3.7) | 7 (2.3) | 16 (4.9) | |
| Urban | 606 (96.3) | 294 (97.7) | 312 (95.1) | |
| Hospital Bed Size – n (%) | 0.48 | |||
| Small | 46 (7.3) | 24 (8.0) | 22 (6.7) | |
| Medium | 173 (27.5) | 88 (29.2) | 85 (25.9) | |
| Large | 410 (65.2) | 189 (62.8) | 221 (67.4) | |
| Hospital Control – n (%) | <0.001 | |||
| Government, nonfederal | 76 (12.1) | 43 (14.3) | 33 (10.1) | |
| Private, not-for-profit | 469 (74.6) | 203 (67.4) | 266 (81.1) | |
| Private, investor-owned | 84 (13.4) | 55 (18.3) | 29 (8.8) | |
|
Hospital ICH cases per year
– median (IQR) |
35 (20–57) | 31(19–54) | 38 (21–63) | 0.009 |
|
Hospital ethnic minorities
per 100 cases – median (IQR) |
28.6 (13.3–50.0) | 35.6 (17.2–60.7) | 24.3 (10.5–42.6) | <0.001 |
|
Hospital gastrostomy rate
per 100 cases – median (IQR) |
8.1 (4.2–12.5) | 9.1 (5.0–13.5) | 7.1 (3.0–11.5) | <0.001 |
|
Hospital tracheostomy rate
per 100 cases – median (IQR) |
2.8 (0–6.3) | 3.5 (0–7.4) | 2.4 (0–5.6) | 0.006 |
|
Hospital ventriculostomy rate
per 100 cases – median (IQR) |
3.6 (0–8.1) | 3.1 (0–8.1) | 3.8 (0–8.1) | 0.65 |
|
Hospital intubation rate
per 100 cases – median (IQR) |
8.0 (3.1–14.0) | 8.3 (3.7–15.4) | 7.4 (3.0–12.5) | 0.010 |
|
Hospital discharge disposition
per 100 cases – median (IQR) |
||||
| Home/Self-care | 17.7 (12.1–23.8) | 18.2 (12.2–25.0) | 17.3 (12.1–22.6) | 0.072 |
| Short-term hospital/Rehab facility/SNF | 42.2 (33.3–50.0) | 42.6 (33.3–50.0) | 41.7 (33.3–48.7) | 0.21 |
| Home Health Care | 5.8 (2.1–10) | 5.3 (1.2–9.9) | 6.5 (2.5–10.5) | 0.070 |
| Inpatient/Home Hospice | 4.5 (0–9.7) | 4.2 (0–9.1) | 4.9 (0–10.5) | 0.34 |
| Inpatient Mortality | 25.0 (19.2–32.1) | 24.0 (18.2–31.0) | 25.4 (20.3–33.3) | 0.006 |
A total of 11,866 ICH cases received care at hospitals with palliative care use below the median, while 14,925 patients were treated in hospitals at or above the median hospital palliative care use. ICH cases receiving care in hospitals at or above the median rate of hospital palliative care use were more likely to be female (50.2% vs. 48.2%, p<0.001), white (67.4% vs. 59.0%, p<0.001), and had higher inpatient mortality (26.6% vs. 24.9%, p<0.001) compared to those who were treated at hospitals with palliative care use below the median (Table 2). Other characteristics of patients, stratified by hospital palliative care use are presented in Table 2.
Table 2.
Characteristics of patients, stratified by hospital use of palliative care (PC) above and below the median of 9.1 per 100 ICH admissions. APR-DRG: all patient refined diagnosis-related group; CCI: Charlson Comorbidity Index; LOS: length of stay; PI: Pacific Islander.
| Patient characteristics | All Patients in all hospitals (n=26,791) |
Patients in hospitals with PC use <median (n=11,866) |
Patients in hospitals with PC use ≥median (n=14,925) |
P-value |
|---|---|---|---|---|
| Age – years: median (IQR) | 71(57–81) | 71 (57–81) | 71 (58–81) | 0.14 |
| Female – n (%) | 13,209 (49.3) | 5,722 (48.2) | 7,487 (50.2) | 0.002 |
| Race/Ethnicity | <0.001 | |||
| White | 17,063 (63.7) | 7001 (59.0) | 10,062 (67.4) | |
| Black | 4,908 (18.3) | 2,226 (18.8) | 2,682 (18.0) | |
| Hispanic | 2,468 (9.2) | 1,462 (12.3) | 1,006 (6.7) | |
| Asian/PI | 1,299 (4.8) | 592 (5.0) | 707 (4.7) | |
| Other | 1,053 (3.9) | 585 (4.9) | 468 (3.1) | |
| All ethnic minorities | 9,728 (36.3) | 4,865 (41.0) | 4,863 (32.6) | |
| Health Insurance | <0.001 | |||
| Medicare | 15,861 (59.2) | 6,935 (58.4) | 8,926 (59.8) | |
| Medicaid | 2,650 (9.9) | 1,304 (11.0) | 1,346 (9.0) | |
| Private Insurance | 5,558 (20.7) | 2,400 (20.2) | 3,158 (21.2) | |
| Self-pay/other | 2,722 (10.2) | 1,227 (10.3) | 1,495 (10.0) | |
| Modified CCI | 0.018 | |||
| 0 | 12,397 (46.3) | 5,453 (46.0) | 6,944 (46.5) | |
| 1 | 8,476 (31.6) | 3,859 (32.5) | 4,617 (30.9) | |
| 2 | 3,629 (13.5) | 1,587 (13.4) | 2,042 (13.7) | |
| ≥3 | 2,289 (8.5) | 967 (8.1) | 1,322 (8.9) | |
| APR-DRG | <0.001 | |||
| Minor | 1,799 (6.7) | 881 (7.4) | 918 (6.2) | |
| Moderate | 7,654 (28.6) | 3,468 (29.2) | 4,186 (28.0) | |
| Major | 10,229 (38.2) | 4,393 (37.0) | 5,836 (39.1) | |
| Extreme | 7,109 (26.5) | 3,124 (26.3) | 3,985 (26.7) | |
| LOS – days: median (IQR) | 5 (3–10) | 5 (3–10) | 5 (2–9) | <0.001 |
| Discharge Disposition | <0.001 | |||
| Home/Self-care | 5,190 (19.4) | 2,317 (19.5) | 2,873 (19.3) | |
| Short-term hospital/Rehab facility/SNF | 11,153 (41.6) | 5,068 (42.7) | 6,085 (40.8) | |
| Home health care | 1,769 (6.6) | 748 (6.3) | 1,021 (6.8) | |
| Home hospice | 330 (1.2) | 133 (1.1) | 197 (1.3) | |
| Inpatient hospice | 1,247 (4.7) | 553 (4.7) | 694 (4.7) | |
| Left AMA | 99 (0.4) | 59 (0.5) | 40 (0.3) | |
| Discharged alive, destination unknown | 64 (0.2) | 28 (0.2) | 36 (0.2) | |
| In-hospital mortality | 6,927 (25.9) | 2,952 (24.9) | 3,975 (26.6) | |
Among all patients, 12.5% received palliative care (95% CI 11.5–13.5). Patient characteristics, stratified by individual-level palliative care use, are presented in Supplemental Table 1.
Between-hospital variability in palliative care after ICH
Table 3 shows the results of multilevel modeling of palliative care use, starting with an empty random intercept model (without covariates; Model 0) allowing for variability by hospital. The ICC of Model 0 without covariates was 0.274 (Table 3), suggesting that 27.4% of the overall variability in palliative care use was due to between-hospital variability. After adjusting for the sampling year and the addition of level 1 (patient-level) covariates age, sex, race, insurance status, modified Charlson Comorbidity Index, and APR-DRG Severity, there was only a mild decrease in the ICC (0.265; Model 1). After adding only level 2 (hospital-level) variables (Model 2), the ICC decreased to 0.219, suggesting that hospital-level rather than individual-level covariates explain between-hospital variability in palliative care use. This model accounted for 25.8% of the between-hospital variance observed in the null model (Model 0), with 74.2% of between-hospital variance remaining unexplained.
Table 3.
Multilevel multivariable logistic regression models for individual (level 1) and hospital (level 2) characteristics associated with palliative care use. Estimates for level 1 and level 2 variables are presented as odds ratios and 95% confidence intervals. APR-DRG: all patient refined diagnosis-related group; CCI: Charlson Comorbidity Index; ICC: Intraclass correlation coefficient.
| Characteristic | Model 0 | Model 1 | Model 2 | Model 3 |
|---|---|---|---|---|
| LEVEL 1 variables | ||||
| Age – per 10 years | 1.58 (1.52–1.65) | 1.60 (1.20–2.36) | ||
| Female sex | 1.12 (1.03–1.21) | 1.11 (1.03–1.20) | ||
| Ethnic minority race | 0.82 (0.74–0.90) | 0.86 (0.78–0.95) | ||
| Health Insurance | ||||
| Medicare | 1.00 (ref) | 1.00 (ref) | ||
| Medicaid | 1.11 (0.92–1.34) | 1.12 (0.92–1.35) | ||
| Private Insurance | 1.27 (1.12–1.43) | 1.27 (1.12–1.43) | ||
| Self-pay/other | 1.70 (1.44–2.01) | 1.72 (1.46–2.04) | ||
| Modified CCI | ||||
| 0 | 1.00 (ref) | 1.00 (ref) | ||
| 1 | 0.85 (0.78–0.93) | 0.85 (0.78–0.93) | ||
| 2 | 0.72 (0.63–0.82) | 0.72 (0.63–0.81) | ||
| ≥3 | 0.85 (0.73–0.98) | 0.84 (0.73–0.97) | ||
| APR-DRG Severity | ||||
| Minor | 1.00 (ref) | 1.00 (ref) | ||
| Moderate | 0.81 (0.66–0.99) | 0.81 (0.66–0.99) | ||
| Major | 1.61 (1.32–1.96) | 1.60 (1.32–1.96) | ||
| Extreme | 3.12 (2.55–3.81) | 3.15 (2.57–3.85) | ||
| LEVEL 2 variables | ||||
| Hospital percentage of minorities – per 10% increase |
0.88 (0.84–0.93) | 0.91 (0.87–0.95) | ||
| Hospital Region | ||||
| Northeast | 1.00 (ref) | 1.00 (ref) | ||
| Midwest | 1.41 (1.03–1.94) | 1.55 (1.11–2.17) | ||
| South | 1.31 (1.00–1.72) | 1.40 (1.05–1.87) | ||
| West | 1.80 (1.33–2.42) | 1.94 (1.41–2.65) | ||
| Hospital Location | ||||
| Rural | 1.00 (ref) | 1.00 (ref) | ||
| Urban | 0.76 (0.45–1.28) | 0.73 (0.42–1.25) | ||
| Teaching Hospital | 0.93 (0.72–1.19) | 0.94 (0.73–1.22) | ||
| Hospital Bed Size | ||||
| Small | 1.00 (ref) | 1.00 (ref) | ||
| Medium | 1.12 (0.73–1.72) | 1.18 (0.75–1.85) | ||
| Large | 1.25 (0.81–1.93) | 1.30 (0.83–2.06) | ||
| Hospital Control | ||||
| Government, nonfederal | 1.00 (ref) | 1.00 (ref) | ||
| Private, not-for-profit | 1.22 (0.89–1.65) | 1.15 (0.83–1.59) | ||
| Private, investor-owned | 0.78 (0.52–1.17) | 0.70 (0.46–1.07) | ||
| Hospital ICH case volume – per 50 annual case increase |
1.15 (1.01–1.31) | 1.17 (1.02–1.35) | ||
| Hospital intubation rate – per 10% increase |
0.85 (0.69–1.05) | 0.81 (0.65–1.02) | ||
| Hospital gastrostomy rate – per 10% increase |
0.93 (0.76–1.13) | 0.90 (0.72–1.11) | ||
| Hospital tracheostomy rate – per 10% increase |
0.83 (0.59–1.16) | 0.86 (0.61–1.23) | ||
| Hospital ventriculostomy rate – per 10% increase |
1.17 (0.97–1.41) | 1.18 (0.97–1.45) | ||
| Model Parameters | ||||
| ICC | 0.274 | 0.265 | 0.219 | 0.238 |
| Between hospital variance (95% CI) |
1.24 (1.03–1.49) | 1.19 (0.99–1.43) | 0.92 (0.76–1.11) | 1.03 (0.85–1.24) |
| Proportional variance change | - | 4.0% | 25.8% | 16.9% |
| Median odds ratio (95% CI) | 2.89 (2.63–3.20) | 2.83 (2.58–3.13) | 2.50 (2.30–2.74) | 2.63 (2.41–2.89) |
In the fully adjusted model (Model 4), level 2 covariates associated with palliative care were hospital geographic region (OR 1.55, 95% CI 1.11–2.17 in the Midwest; OR 1.40, 95% CI 1.05–1.87 in the South; and OR 1.94, 95% CI 1.41–2.65 in the West, compared to Northeast region), hospital ethnic minority composition (OR 0.91, 95% CI 0.87–0.95 per 10% increase in the percentage of ethnic minority patients at a given hospital), and annual hospital ICH case volume (OR 1.17, 95% CI 1.02–1.35 per increase in 50 annual ICH cases; Model 3; Table 3). The median odds ratio for the model including both individual-level and hospital-level variables was 2.63 (95% CI 2.41–2.89), indicating that if patients moved from any one hospital to another hospital with a higher propensity of palliative care use, there was a 2.63-fold increase in the odds of receiving palliative care.
Discussion
In the present study of US hospitals, we investigated between-hospital differences in palliative care use after ICH by using a multilevel modeling approach. We show that the percentage of ICH patients receiving palliative care varied substantially between hospitals, even after accounting for patient-level and hospital-level characteristics. This is consistent with previously reported wide variation in do-not-resuscitate (DNR) orders after ICH among hospitals in California(21, 22), and substantial variability in prognosis and treatment recommendations among providers caring for ICH patients(23).
Although hospital-level characteristics explained just over 25% of the between-hospital variability in our null model, most of the between-hospital variability remained unexplained suggesting that other unmeasured variables may account for the remaining hospital-to-hospital variability. Uncertainty regarding prognosis and life expectancy may influence differences in timing and threshold for triggering palliative care services(21, 22, 24). Similarly, knowledge, preferences, attitudes, and perceptions on quality of life as well as information on decision-making regarding life-sustaining therapies by providers and patients and their surrogates were not available(25–27). However, hospital-level use of prolonged intubation, gastrostomy, tracheostomy, and ventriculostomy were not significantly associated with palliative care use in our study and did not explain between-hospital variation. Hospital ownership was accounted for in our models; however, other structural differences not captured in our data, including specialists on staff and resource availabilities, may drive hospital-level differences by determining the local practice patterns. Although individual-level variables were associated with palliative care use, they did not explain between-hospital variability in palliative care use, and the ICC decreased only when adding hospital-level covariates intro the model.
Hospital minority racial composition of ICH patients was associated with decreased use of palliative care, even after accounting for individual-level patient race. Therefore, care location rather than individual patient race may be a particularly relevant barrier to racial equity in ICH-related care since ethnic minority ICH patients tend to cluster at relatively few hospitals(28). Future studies may determine whether differences in funding or staffing explain the observed lower use of palliative care at ethnic minority hospitals(29, 30). Minority patients have higher use of other life-sustaining procedures after ICH, including gastrostomy(31–33); however, hospital racial composition remained significantly associated with palliative care use after accounting for hospital-level life-sustaining procedures, suggesting that hospital racial composition determines use of palliative care resources beyond a general increase in use of life- sustaining procedures.
The relatively low rate of discharge to hospice in our data is consistent with the notion that the hospital is still the predominant location of death for ICH patients, regardless of whether palliative care was utilized or not. The reasons for this potential underutilization of hospice resources cannot be derived from this study, but may include patient/surrogate preferences, provider prognostic uncertainty, and logistical challenges to access such resources in a timely manner. For example, it is possible that the rapidity in which death ensues after withdrawal of care in some cases outpaces the ability to arrange for discharge to hospice.
In addition to previously mentioned limitations, our study has other potential limitations inherent to administrative datasets(34), including the potential for miscoding. ICD9-CM code V66.7 identifies palliative care services use with high specificity(13). However, there is a possibility of under-reporting or under-coding patients who actually received palliative care, especially among patients receiving palliative care for pain or symptom management in the absence of care withdrawal(35), or among patients who receive palliative care by the primary team as opposed to a specialty consultation team. Furthermore, NIS does not collect information on the trigger, timing, and mode of palliative care delivery. We acknowledge that data were collected from 2008 to 2011 when palliative care services and knowledge were nascent relative to now. In addition, code V66.7 does not capture the quality or the impact of the actual care delivered. We attempted to mitigate the absence of clinical and physiological stroke data in NIS by adjusting all models for the Charlson Comorbidity Index, a validated measure of patient comorbidities in ICH(14), as well as medical complications. Lastly, we were unable to investigate the contribution of implicit bias, provider attitudes, and individual patient preference to the observed differences in palliative care resource use.
Conclusion
Our data demonstrate a wide variability in palliative care use for ICH patients among US hospitals, and this variability is insufficiently explained by measured individual- or hospital-level characteristics. Further studies are needed to better understand the drivers of between-hospital variability in palliative care use, including the differences in attitudes and preferences by providers and patients alike as determinants of local practice patterns. Such efforts may include mandatory reporting of quality measures of palliative care as part of the stroke center certification and quality assurance process, similar to the reporting of other stroke-related measures that are captured in Get With The Guidelines (GWTG). Transparency in reporting on palliative care measures by hospitals may better characterize the drivers of differences in local palliative care practice, and may identify gaps in care delivery. A standardized approach to implement palliative care services in the care of ICH patients is needed to ensure equity in care and adherence to recommendations in guidelines set forth by professional associations.
Supplementary Material
Acknowledgments
Sources of Funding
Dr Faigle is supported by a Career Development Award from the National Institute of Neurological Disorders and Stroke (NINDS: K23NS101124). Dr Gottesman is supported by a grant from the National Institute on Aging (K24AG052573).
Footnotes
Statement of Ethics
This study was exempt from institutional review board approval.
Disclosures
Dr. Faigle reports no conflicts of interest. Dr. Gottesman is an Associate Editor for Neurology.
References
- 1.Koton S, Schneider AL, Rosamond WD, Shahar E, Sang Y, Gottesman RF, et al. Stroke incidence and mortality trends in US communities, 1987 to 2011. Jama. 2014;312(3):259–68. [DOI] [PubMed] [Google Scholar]
- 2.Feigin VL, Lawes CM, Bennett DA, Barker-Collo SL, Parag V. Worldwide stroke incidence and early case fatality reported in 56 population-based studies: a systematic review. The LancetNeurology. 2009;8(4):355–69. [DOI] [PubMed] [Google Scholar]
- 3.Braun LT, Grady KL, Kutner JS, Adler E, Berlinger N, Boss R, et al. Palliative Care and Cardiovascular Disease and Stroke: A Policy Statement From the American Heart Association/American Stroke Association. Circulation. 2016;134(11):e198–225. [DOI] [PubMed] [Google Scholar]
- 4.Holloway RG, Arnold RM, Creutzfeldt CJ, Lewis EF, Lutz BJ, McCann RM, et al. Palliative and end-of-life care in stroke: a statement for healthcare professionals from the American Heart Association/American Stroke Association. Stroke. 2014;45(6):1887–916. [DOI] [PubMed] [Google Scholar]
- 5.Souter MJ, Blissitt PA, Blosser S, Bonomo J, Greer D, Jichici D, et al. Recommendations for the Critical Care Management of Devastating Brain Injury: Prognostication, Psychosocial, and Ethical Management : A Position Statement for Healthcare Professionals from the Neurocritical Care Society. Neurocrit Care. 2015;23(1):4–13. [DOI] [PubMed] [Google Scholar]
- 6.Frontera JA, Curtis JR, Nelson JE, Campbell M, Gabriel M, Mosenthal AC, et al. Integrating Palliative Care Into the Care of Neurocritically Ill Patients: A Report From the Improving Palliative Care in the ICU Project Advisory Board and the Center to Advance Palliative Care. Crit Care Med. 2015;43(9):1964–77. [DOI] [PMC free article] [PubMed] [Google Scholar]
- 7.Guha R, Boehme A, Demel SL, Li JJ, Cai X, James ML, et al. Aggressiveness of care following intracerebral hemorrhage in women and men. Neurology. 2017;89(4):349–54. [DOI] [PMC free article] [PubMed] [Google Scholar]
- 8.Murthy SB, Moradiya Y, Hanley DF, Ziai WC. Palliative Care Utilization in Nontraumatic Intracerebral Hemorrhage in the United States. Critical Care Medicine. 2016;44(3):575–82. [DOI] [PubMed] [Google Scholar]
- 9.Singh T, Peters SR, Tirschwell DL, Creutzfeldt CJ. Palliative Care for Hospitalized Patients With Stroke: Results From the 2010 to 2012 National Inpatient Sample. Stroke. 2017;48(9):2534–40. [DOI] [PMC free article] [PubMed] [Google Scholar]
- 10.Steiner C, Elixhauser A, Schnaier J. The healthcare cost and utilization project: an overview. Effective clinical practice : ECP. 2002;5(3):143–51. [PubMed] [Google Scholar]
- 11.Jones SA, Gottesman RF, Shahar E, Wruck L, Rosamond WD . Validity of hospital discharge diagnosis codes for stroke: the Atherosclerosis Risk in Communities Study. Stroke; a journal of cerebral circulation. 2014;45(11):3219–25. [DOI] [PMC free article] [PubMed] [Google Scholar]
- 12.Brown F, Leon-Chisen N. ICD-9-CM Coding Handbook, With Answers, 2012. Revised Edition: AHA Press; 720 p. [Google Scholar]
- 13.Qureshi AI, Adil MM, Suri MF. Rate of utilization and determinants of withdrawal of care in acute ischemic stroke treated with thrombolytics in USA. Medical care. 2013;51(12):1094–100. [DOI] [PubMed] [Google Scholar]
- 14.Bar B, Hemphill JC 3rd. Charlson comorbidity index adjustment in intracerebral hemorrhage. Stroke; a journal of cerebral circulation. 2011;42(10):2944–6. [DOI] [PMC free article] [PubMed] [Google Scholar]
- 15.Goldstein LB, Samsa GP, Matchar DB, Horner RD. Charlson Index comorbidity adjustment for ischemic stroke outcome studies. Stroke. 2004;35(8):1941–5. [DOI] [PubMed] [Google Scholar]
- 16.Xian Y, Holloway RG, Pan W, Peterson ED. Challenges in assessing hospital-level stroke mortality as a quality measure: comparison of ischemic, intracerebral hemorrhage, and total stroke mortality rates. Stroke; a journal of cerebral circulation. 2012;43(6):1687–90. [DOI] [PubMed] [Google Scholar]
- 17.George BP, Kelly AG, Schneider EB, Holloway RG. Current practices in feeding tube placement for US acute ischemic stroke inpatients. Neurology. 2014;83(10):874–82. [DOI] [PMC free article] [PubMed] [Google Scholar]
- 18.Merlo J, Chaix B, Ohlsson H, Beckman A, Johnell K, Hjerpe P, et al. A brief conceptual tutorial of multilevel analysis in social epidemiology: using measures of clustering in multilevel logistic regression to investigate contextual phenomena. J Epidemiol Community Health. 2006;60(4):290–7. [DOI] [PMC free article] [PubMed] [Google Scholar]
- 19.Sanagou M, Wolfe R, Forbes A, Reid CM. Hospital-level associations with 30-day patient mortality after cardiac surgery: a tutorial on the application and interpretation of marginal and multilevel logistic regression. BMC Med Res Methodol. 2012;12:28. [DOI] [PMC free article] [PubMed] [Google Scholar]
- 20.Larsen K, Merlo J. Appropriate assessment of neighborhood effects on individual health: integrating random and fixed effects in multilevel logistic regression. Am J Epidemiol. 2005;161(1):81–8. [DOI] [PubMed] [Google Scholar]
- 21.Hemphill JC 3rd, Newman J, Zhao S, Johnston SC. Hospital usage of early do-not-resuscitate orders and outcome after intracerebral hemorrhage. Stroke; a journal of cerebral circulation. 2004;35(5):1130–4. [DOI] [PubMed] [Google Scholar]
- 22.Kelly AG, Zahuranec DB, Holloway RG, Morgenstern LB, Burke JF. Variation in do-not-resuscitate orders for patients with ischemic stroke: implications for national hospital comparisons. Stroke; a journal of cerebral circulation. 2014;45(3):822–7. [DOI] [PMC free article] [PubMed] [Google Scholar]
- 23.Zahuranec DB, Fagerlin A, Sanchez BN, Roney ME, Thompson BB, Fuhrel-Forbis A, et al. Variability in physician prognosis and recommendations after intracerebral hemorrhage. Neurology. 2016;86(20):1864–71. [DOI] [PMC free article] [PubMed] [Google Scholar]
- 24.Zahuranec DB, Anspach RR, Roney ME, Fuhrel-Forbis A, Connochie DM, Chen EP, et al. Surrogate Decision Makers’ Perspectives on Family Members’ Prognosis after Intracerebral Hemorrhage. J Palliat Med. 2018. [DOI] [PMC free article] [PubMed] [Google Scholar]
- 25.Born W, Greiner KA, Sylvia E, Butler J, Ahluwalia JS. Knowledge, attitudes, and beliefs about end- of-life care among inner-city African Americans and Latinos. Journal of palliative medicine. 2004;7(2):247–56. [DOI] [PubMed] [Google Scholar]
- 26.Cagle JG, Van Dussen DJ, Culler KL, Carrion I, Hong S, Guralnik J, et al. Knowledge About Hospice: Exploring Misconceptions, Attitudes, and Preferences for Care. Am J Hosp Palliat Care. 2016;33(1):27–33. [DOI] [PubMed] [Google Scholar]
- 27.Kavalieratos D, Mitchell EM, Carey TS, Dev S, Biddle AK, Reeve BB, et al. “Not the ‘grim reaper service’“: an assessment of provider knowledge, attitudes, and perceptions regarding palliative care referral barriers in heart failure. J Am Heart Assoc. 2014;3(1):e000544. [DOI] [PMC free article] [PubMed] [Google Scholar]
- 28.Faigle R, Ziai WC, Urrutia VC, Cooper LA, Gottesman RF. Racial Differences in Palliative Care Use After Stroke in Majority-White, Minority-Serving, and Racially Integrated U.S. Hospitals. Crit Care Med. 2017;45(12):2046–54. [DOI] [PMC free article] [PubMed] [Google Scholar]
- 29.Gaskin DJ, Hadley J. Population characteristics of markets of safety-net and non-safety-net hospitals. Journal of urban health : bulletin of the New York Academy of Medicine. 1999;76(3):351–70. [DOI] [PMC free article] [PubMed] [Google Scholar]
- 30.Shen YC, Hsia RY, Kuzma K. Understanding the risk factors of trauma center closures: do financial pressure and community characteristics matter? Medical care. 2009;47(9):968–78. [DOI] [PMC free article] [PubMed] [Google Scholar]
- 31.Faigle R, Bahouth MN, Urrutia VC, Gottesman RF. Racial and Socioeconomic Disparities in Gastrostomy Tube Placement After Intracerebral Hemorrhage in the United States. Stroke. 2016;47(4):964–70. [DOI] [PMC free article] [PubMed] [Google Scholar]
- 32.Faigle R, Marsh EB, Llinas RH, Urrutia VC, Gottesman RF. Novel score predicting gastrostomy tube placement in intracerebral hemorrhage. Stroke. 2015;46(1):31–6. [DOI] [PMC free article] [PubMed] [Google Scholar]
- 33.Hwang DY, George BP, Kelly AG, Schneider EB, Sheth KN, Holloway RG. Variability in Gastrostomy Tube Placement for Intracerebral Hemorrhage Patients at US Hospitals. J Stroke Cerebrovasc Dis. 2018;27(4):978–87. [DOI] [PubMed] [Google Scholar]
- 34.Rabinstein AA. Administrative Medical Databases for Clinical Research: The Good, The Bad, and The Ugly. Neurocrit Care. 2018;29(3):323–5. [DOI] [PubMed] [Google Scholar]
- 35.Cassel JB, Jones AB, Meier DE, Smith TJ, Spragens LH, Weissman D. Hospital mortality rates: how is palliative care taken into account? Journal of pain and symptom management. 2010;40(6):914–25. [DOI] [PubMed] [Google Scholar]
Associated Data
This section collects any data citations, data availability statements, or supplementary materials included in this article.