

Abstract
Impaired metabolism may play an important role in the pathogenesis of lethal prostate cancer, yet there is a paucity of evidence regarding the association. We conducted a large prospective serum metabolomic analysis of lethal prostate cancer in 523 cases and 523 matched controls nested within the Alpha-Tocopherol, Beta-Carotene Cancer Prevention (ATBC) Study. Median time from baseline fasting serum collection to prostate cancer death was 18 years (maximum 30 years). We identified 860 known biochemicals through an ultrahigh-performance LC-MS/MS platform. Conditional logistic regression models estimated odds ratios (OR) and 95% confidence intervals of risk associated with 1-standard deviation (s.d.) increases in log-metabolite signals. We identified 34 metabolites associated with lethal prostate cancer with a false discovery rate (FDR)<0.15. Notably, higher serum thioproline, and thioproline combined with two other cysteine-related amino acids and redox metabolites, cystine and cysteine, were associated with reduced risk (1-s.d. OR=0.75 and 0.71, respectively; P≤8.2×10⁻⁵). By contrast, the dipeptide leucylglycine (OR=1.36, P=8.2×10⁻⁵), and three gamma-glutamyl amino acids (OR=1.28–1.30, P≤4.6×10⁻⁴) were associated with increased risk of lethal prostate cancer. Cases with metastatic disease at diagnosis (N=179) showed elevated risk for several lipids, including especially the ketone body 3-hydroxybutyrate (BHBA), acyl carnitines, and dicarboxylic fatty acids (1.37≤OR≤1.49, FDR<0.15). These findings provide a prospective metabolomic profile of lethal prostate cancer characterized by altered biochemicals in the redox, dipeptide, pyrimidine, and gamma-glutamyl amino acid pathways, whereas ketone bodies and fatty acids were associated specifically with metastatic disease.
Keywords: metabolomics, lethal prostate cancer, nested case-control, antioxidants
Introduction
Prostate cancer accounts for a large worldwide health burden among men for both incidence and mortality, yet there are no established etiologic factors beyond older age, family history, low penetrance genetic variants, and African ancestry race. The widespread use of prostate-specific antigen (PSA) testing during the past 25 years has led to over-diagnosis and overtreatment of indolent, microscopic adenocarcinomas with resulting clinical consequences.1 Therefore, among the challenges in studying prostate cancer etiology is identification of men at higher risk of developing clinically aggressive disease that is fatal. Recent improvements in metabolomic technologies have enabled comprehensive assessment of hundreds and thousands of circulating metabolites that reflect biochemical activity, regulation and dysregulation.2 Systematic prospective examination of altered metabolites of lethal prostate cancer cases prior to clinical onset may help identify unique metabolic traits that are potential early markers of dysregulated biochemical pathways associated with disease risk or progression.3
Few prospective studies have examined pre-diagnostic metabolites in relation to prostate cancer risk.4–8 In our previous prospective metabolomic study of 625 metabolites measured in 200 cases and 200 controls nested within the Alpha-Tocopherol, Beta-Carotene Cancer Prevention (ATBC) Study, nominal inverse associations between serum energy and lipid metabolites and aggressive prostate cancer risk were observed.5 A similar metabolomics analysis of 1,077 cases and 1,077 controls in the European Prospective Investigation into Cancer and Nutrition (EPIC) study that identified 122 metabolites also showed 12 glycerophopholipids inversely associated with advanced prostate cancer risk (208 cases), with some nominal associations for lethal disease based on 127 cases.8 Our aim here was to identify pre-diagnostic serum metabolites associated with lethal prostate cancer risk in an unscreened population.
Methods
Study population
The ATBC Study was a randomized, 2×2 factorial, double-blinded, placebo-controlled primary prevention trial to examine whether supplementation of alpha-tocopherol (50 mg/day), beta-carotene (20 mg/day), or both could reduce cancer incidence. From 1985 to 1988, the ATBC Study enrolled 29,133 male Caucasian smokers, aged 50–69 years, from southwestern Finland. Details of the trial have been previously described.9 The trial ended on April 30, 1993, and since that time, all participants have been followed through linkage with the Finnish Cancer Registry and Register of Causes of Death. Pre-supplementation overnight fasting blood samples from all participants were collected following a standard operating procedure at their enrollment. Demographic characteristics, medical history, and behavioral and lifestyle factors were collected via self-reported questionnaires at enrollment. Height and weight were measured by professional study personnel.9 Baseline serum concentrations of retinol and alpha-tocopherol were measured using an isocratic high-performance liquid chromatography (HPLC) platform.10
Case ascertainment and control selection
Prostate adenocarcinoma cases (N=523) diagnosed through December 31, 2014, were identified based on the International Classification of Diseases (ICD) 9th revision, code 185. Selection was limited to cases who died of prostate cancer (ICD-9=185 or ICD-10=C61; subsequently referred to as “lethal prostate cancer”). Lethal cases with metastatic disease were defined as those with distant metastasis (M1) at clinical diagnosis. Using incidence-density sampling without replacement, 523 controls were selected from the cohort who were alive and cancer-free at the time of prostate cancer case death and individually matched to cases by age (± 1 year) and date of baseline blood collection (± 30 days).
Metabolite profiling
We used a high-resolution accurate mass (HRAM) platform, namely ultrahigh-performance liquid chromatography/tandem mass spectrometry (LC-MS/MS) at Metabolon Inc., to conduct serum metabolite profiling. All metabolite identifications were based on multiple orthogonal criteria to a mass spectral library built from authentic standards, namely tier 1 identification.11, 12 We measured 1,170 metabolites; we included 860 identified metabolites in further analysis, after excluding unknown metabolites or metabolites for which fewer than 10% of participants had detectable values (Supplementary Table S1). Missing values were imputed to one-half the minimum detectable metabolite value. The identified metabolites were categorized into eight chemical classes: amino acids and amino acid derivatives (subsequently refer to as “amino acids”), carbohydrates, cofactors and vitamins, energy metabolites, lipids, nucleotides, peptides or xenobiotics, that are adapted according to the Kyoto Encyclopedia of Genes and Genomics (KEGG) database, as well as Human Metabolome Database (HMDB) (Supplementary Table S1). We calculated the Coefficients of Variations (CVs) and Intraclass Correlation Coefficients (ICCs) for each metabolite prior to log-transformation using 16 or 18 replicate samples from 4 unique ATBC individuals (66 total QC samples), to examine reliability and reproducibility of the metabolite data.
Serum retinol and alpha-tocopherol concentrations identified by metabolomics were highly correlated with concentrations quantified for the cohort earlier using an isocratic HPLC method, supporting good laboratory validity and reproducibility for the present metabolomics platform (retinol: r=0.90, P=10−214; alpha-tocopherol: r=0.79, P<10−214; Supplementary Figures S1 and S2).
Statistical analysis
Baseline characteristics of lethal prostate cancer cases and controls were compared by either the Wilcoxon rank sum or χ2 test. All the metabolites were log-transformed and standardized (mean=0 and variance=1). Conditional logistic regression was used to estimate odds ratios (OR) and 95% confidence intervals (CIs) for a 1-standard deviation (s.d.) increase in log-metabolite level on the risk of lethal prostate cancer. The unadjusted model inherently conditions on the matching factors. Sensitivity analyses also adjusted for body mass index (BMI), number of cigarettes smoked per day, baseline serum concentrations of total cholesterol, high-density lipoprotein (HDL) cholesterol, alpha-tocopherol, and retinol, and fasting hours (as continuous variables), and ATBC intervention group (as a categorical variable). Adding any of these covariates in the model did not change the risk estimate of metabolite by 10% or more; therefore, we present results from the unadjusted conditional models. We assessed if the metabolite-prostate cancer relationships differed based on lower/higher BMI (<26 or ≥26 kg/m2), and time between blood collection and prostate cancer death (≤18 or >18 years) by including the cross-product term between the dichotomous variable (BMI or time) and the log-metabolite level in the regression. We also examined the metabolite-lethal prostate cancer associations within the first 10 years from serum collection to prostate cancer death. Based on the Benjamini-Hochberg method, we used a false discovery rate (FDR, q-value) <0.15 to present the metabolite-risk associations.
We used Gene-Set Analysis (GSA) to estimate whether the pre-defined metabolic chemical classes and sub-classes (subsequently referred to as super- or sub-pathways) were related to lethal prostate cancer risk.13 Briefly, allowing {Z1,…, Zs} of the Z values from testing the S metabolites in a pre-defined pathway, GSA calculates the “maxmean” statistics max (+Z+, -Z-), that +Z+(-Z-) is the mean of all positive (negative) values.13 We calculated the P-values for each pathway by 105 permutations. For each pathway that was associated with lethal prostate cancer, we performed principal component analysis (PCA, using the varimax rotation method) and defined a “pathway score” as the first principal component. We further assessed whether the pathway score was associated with lethal prostate cancer using conditional logistic regression.
Thioproline and cystine have been reported as direct metabolites of cysteine in in vivo experiments,14 and cysteine-related metabolites play an important role in modulating redox status that may be related to risk of lethal prostate cancer. We therefore examined whether combinations of these cysteine-related metabolites (thioproline, cysteine, and cystine) were associated with risk of lethal prostate cancer by calculating the sum of the standardized metabolite values weighted by their corresponding beta coefficients from the conditional logistic regression analyses. We then entered the weighted sum value into a separate conditional logistic regression model.
We also examined metabolite-lethal prostate cancer associations comparing all controls with subgroups of men defined by having been diagnosed with or without metastases, using unconditional logistic regression models adjusted for age at blood collection, date of baseline blood collection, and time interval from blood collection to cancer diagnosis (or, for controls, to cancer diagnosis date of the matched case).
We created Gaussian graphical models to summarize relationships among metabolites in the pathways associated with lethal prostate cancer risk. Gaussian graphical models include edges between pairs of metabolites with a partial correlation coefficient, conditioned on other metabolites, less than −0.2 or greater than 0.2 from the analysis.15, 16
All analyses were performed using SAS version 9.4 (SAS Institute, Cary, NC), and R version 3.4.0 (R Development Core Team, Vienna, Austria). All the reported statistical tests were two-sided.
Results
Table 1 presents baseline characteristics of the study population. Cases were similar to controls with the exception of having a higher prevalence of prostate cancer family history. Median time from serum collection to prostate cancer death was 18 years (inter-decile range= 9.6 to 26 years). The median metabolite ICC and CV were 0.88 (interquartile range=0.68 to 0.95) and 0.20 (interquartile range=0.12 to 0.37), respectively.
Table 1.
Baseline characteristics of the cases and controls in the ATBC Study a
| Cases | Controls | P-value | |
|---|---|---|---|
| N | 523 | 523 | Matched |
| Age at blood collection, years | 57.9 (5.0) | 57.4 (4.8) | Matched |
| Height (cm) | 173.9 (6.2) | 173.7 (6.2) | 0.59 |
| Weight (kg) | 79.4 (12.6) | 79.6 (12.9) | 0.90 |
| BMI (kg/m2) | 26.2 (3.6) | 26.3 (3.8) | 0.59 |
| History of diabetes (%) | 2.1 | 2.1 | 1.00 |
| Physically active (%) | 20.5 | 20.2 | 0.94 |
| Cigarettes per day | 19.3(8.7) | 19.1(8.0) | 0.87 |
| Years of cigarette smoking | 35.6 (8.8) | 35.9 (8.6) | 0.58 |
| Family history of prostate cancer (%) | 6.6 | 2.3 | 0.005 |
| Serum total cholesterol (mmol/L) | 6.3 (1.2) | 6.3 (1.1) | 0.77 |
| Serum HDL cholesterol (mmol/L) | 1.2 (0.3) | 1.2 (0.3) | 0.59 |
| Serum alpha-tocopherol (mg/L) | 11.9 (3.0) | 12.1 (2.9) | 0.16 |
| Serum beta-carotene (μg/L) | 231 (189) | 234 (195) | 0.94 |
| Serum retinol (μg/L) | 602 (131) | 590 (117) | 0.19 |
| Dietary intake per day | |||
| Total energy (kcal) | 2745 (783) | 2713 (729) | 0.72 |
| Fruit (g) | 136 (105) | 129 (103) | 0.27 |
| Vegetables (g) | 116 (74) | 112 (63) | 0.94 |
| Red meat (g) | 69.8 (33.8) | 69.0 (31.6) | 0.84 |
| Coffee (g) | 626 (349) | 620 (377) | 0.59 |
| Alcohol (ethanol, g) | 16.7 (21.8) | 15.9 (19.3) | 0.74 |
| Supplement use | |||
| Vitamin A (%) | 12.1 | 9.9 | 0.27 |
| Vitamin D (%) | 6.9 | 7.4 | 0.81 |
| Calcium (%) | 10.0 | 11.8 | 0.37 |
| Clinical characteristics of cases | |||
| Calendar year of diagnosis, No. (%) | |||
| 1988–1992 | 47 (9.1) | -- | |
| 1993–1997 | 155 (30.0) | -- | |
| 1998–2002 | 149 (28.8) | -- | |
| 2003–2007 | 96 (18.6) | -- | |
| 2008–2014 | 70 (13.5) | -- | |
| Unknown | 6 | ||
| Cancer stage at prostate cancer diagnosis, No. (%) | |||
| I | 76 (17.4) | -- | |
| II | 109 (24.9) | -- | |
| III | 55 (12.6) | -- | |
| IV | 198 (45.2) | -- | |
| Unknown | 85 | ||
| Mean survival time since diagnosis, years | 4.6 | -- | |
| Mean follow-up time since blood collection to prostate cancer death, years | 18 | -- | |
| Number of cases with metastatic disease at diagnosis | 179 | -- |
Abbreviations: ATBC = Alpha-Tocopherol, Beta-Carotene Cancer Prevention, HDL = high-density lipoprotein
Values are means and standard deviations unless otherwise indicated.
Using conditional logistic regression models, we found thirty-four out of 860 identified serum metabolites associated with lethal prostate cancer risk at an FDR<0.15 (Table 2), including 9 amino acids, 1 cofactor/vitamin, 7 lipids, 5 nucleotides, and 12 peptides (Table 2). The two strongest associations were the dipeptide leucylglycine (per 1-s.d., OR=1.36, P=8.19×10⁻⁵, FDR=0.029) and amino acid derivative thioproline (OR=0.75, P=8.23×10⁻⁵, FDR=0.029) (Table 2). We also found three gamma-glutamyl amino acids yielded strong positive association signals for lethal prostate cancer: gamma-glutamylvaline, gamma-glutamylglycine and gamma-glutamylleucine (per 1-s.d., ORs=1.28–1.30, 2.60×10⁻⁴≤P≤4.58×10⁻⁴, FDR=0.061–0.064). Several other dipeptides such as histidylalanine, valylglycine and leucylglutamine, as well as the uracil pyrimidines pseudouridine, 2’-O-methyluridine, 5,6-dihydrouridine and 5-methyluridine, had positive associations with lethal disease (Table 2). We observed inverse associations for three fibrinogen cleavage peptides, and the top lipid signals were eicosanoid 5-HEPE, androgenic steroid androstenediol (3beta,17beta) disulfate, and glycerol (OR=1.21–1.25, 0.0014≤P≤0.0043) (Table 2). These results remained unchanged after additional adjustment for potential confounding factors (Supplementary Table S2).
Table 2.
ORs and 95% CIs (per 1-s.d.) from conditional logistic regression for the association between lethal prostate cancer risk and serum metabolites achieving the FDR<0.15 threshold based on 523 case-control pairs in the ATBC Study a
| Metabolite b | Sub-class pathway | Detectable values in % of the study population |
OR c | 95% CI | P-value | Q-value | P for Chemical Class d |
|---|---|---|---|---|---|---|---|
| Amino acids and amino acid derivatives | 0.063 | ||||||
| Glutamine | Glutamate metabolism | 100 | 0.80 | 0.69, 0.93 | 0.0033 | 0.12 | |
| Cysteinylglycine disulfide | Glutathione metabolism | 100 | 0.81 | 0.70, 0.93 | 0.0032 | 0.12 | |
| N-Acetylserine | Glycine, serine and threonine metabolism | 100 | 1.24 | 1.07, 1.44 | 0.0043 | 0.12 | |
| N-Acetylhistidine | Histidine metabolism | 100 | 1.22 | 1.06, 1.40 | 0.0048 | 0.12 | |
| Thioproline | Methionine, cysteine, SAM and taurine metabolism | 100 | 0.75 | 0.65, 0.86 | 8.2×10⁻⁵ | 0.029 | |
| Cystine | Methionine, cysteine, SAM and taurine metabolism | 100 | 0.80 | 0.70, 0.91 | 0.00086 | 0.088 | |
| Cysteine | Methionine, cysteine, SAM and taurine metabolism | 100 | 0.80 | 0.68, 0.93 | 0.0044 | 0.12 | |
| C-Glycosyltryptophan | Tryptophan metabolism | 100 | 1.21 | 1.06, 1.38 | 0.0038 | 0.12 | |
| 4-Hydroxyphenylpyruvate | Tyrosine metabolism | 98 | 0.81 | 0.71, 0.92 | 0.0013 | 0.093 | |
| Cofactors and vitamins | 0.76 | ||||||
| Oxalate (ethanedioate) | Ascorbate and aldarate metabolism | 100 | 0.83 | 0.73, 0.95 | 0.0047 | 0.12 | |
| Lipids | 0.12 | ||||||
| Androstenediol (3beta,17beta) disulfate (2) | Androgenic steroids | 100 | 1.22 | 1.08, 1.39 | 0.0021 | 0.093 | |
| 5-HEPE | Eicosanoid | 57 | 1.25 | 1.09, 1.43 | 0.0014 | 0.093 | |
| Oleoyl ethanolamide | Endocannabinoid | 100 | 1.21 | 1.05, 1.38 | 0.0067 | 0.14 | |
| 3-Methyl adipate | Fatty acid, dicarboxylate | 99 | 1.20 | 1.06, 1.36 | 0.0047 | 0.12 | |
| Glycerol | Glycerolipid metabolism | 100 | 1.21 | 1.06, 1.38 | 0.0043 | 0.12 | |
| 3-Hydroxybutyrate (BHBA) | Ketone bodies | 100 | 1.19 | 1.05, 1.34 | 0.0062 | 0.14 | |
| 1-Linoleoyl-GPC (18:2) | Lysophospholipid | 100 | 0.83 | 0.72, 0.95 | 0.0066 | 0.14 | |
| Nucleotides | 0.028 | ||||||
| Dihydroorotate | Pyrimidine metabolism, orotate containing | 98 | 0.83 | 0.72, 0.94 | 0.0053 | 0.12 | |
| Pseudouridine | Pyrimidine metabolism, uracil containing | 100 | 1.24 | 1.08, 1.42 | 0.0017 | 0.093 | |
| 2’-O-Methyluridine | Pyrimidine metabolism, uracil containing | 100 | 1.21 | 1.07, 1.37 | 0.0023 | 0.093 | |
| 5,6-Dihydrouridine | Pyrimidine metabolism, uracil containing | 100 | 1.21 | 1.06, 1.37 | 0.0038 | 0.12 | |
| 5-Methyluridine (ribothymidine) | Pyrimidine metabolism, uracil containing | 100 | 1.21 | 1.06, 1.38 | 0.0038 | 0.12 | |
| Peptides | <0.0001 | ||||||
| Leucylglycine | Dipeptide | 38 | 1.36 | 1.17, 1.58 | 8.2×10⁻⁵ | 0.029 | |
| Histidylalanine | Dipeptide | 25 | 1.29 | 1.11, 1.49 | 0.0010 | 0.090 | |
| Valylglycine | Dipeptide | 51 | 1.23 | 1.08, 1.41 | 0.0022 | 0.093 | |
| Leucylglutamine | Dipeptide | 39 | 1.21 | 1.06, 1.37 | 0.0043 | 0.12 | |
| Fibrinopeptide A, phosphono-ser (ADPSGEGDFXAEGGGVR) |
Fibrinogen cleavage peptide | 98 | 0.79 | 0.69, 0.91 | 0.00088 | 0.088 | |
| Fibrinopeptide A (5–16) | Fibrinogen cleavage peptide | 99 | 0.81 | 0.71, 0.92 | 0.0017 | 0.093 | |
| Fibrinopeptide A, des-ala (DSGEGDFXAEGGGVR) |
Fibrinogen cleavage peptide | 100 | 0.81 | 0.71, 0.93 | 0.0022 | 0.093 | |
| Gamma-glutamylvaline | Gamma-glutamyl amino acid | 100 | 1.30 | 1.13, 1.50 | 0.00026 | 0.061 | |
| Gamma-glutamylglycine | Gamma-glutamyl amino acid | 100 | 1.28 | 1.11, 1.47 | 0.00044 | 0.064 | |
| Gamma-glutamylleucine | Gamma-glutamyl amino acid | 100 | 1.29 | 1.12, 1.48 | 0.00046 | 0.064 | |
| Gamma-glutamylisoleucine | Gamma-glutamyl amino acid | 100 | 1.23 | 1.08, 1.41 | 0.0022 | 0.093 | |
| Gamma-glutamylphenylalanine | Gamma-glutamyl amino acid | 100 | 1.20 | 1.05, 1.36 | 0.0070 | 0.14 |
Abbreviations: OR = odds ratio, CI = confidence interval, s.d. = standard deviation, ATBC = Alpha-Tocopherol, Beta-Carotene Cancer Prevention, FDR = false discovery rate, ICD = International Classification of Diseases.
Metabolites with FDR (q-value) < 0.15 were included in the table.
Metabolites were log-transformed and standardized (mean = 0, s.d. = 1). All metabolites had detectable values in > 90% of the study population with the exception of dipeptides leucylglycine, histidylalanine, valylglycine, leucylglutamine, and eicosanoid 5-HEPE (38%, 25%, 51%, 39% and 57%, respectively).
Odds ratio per 1 s.d. increase in metabolite level based on 523 case-control pairs. Lethal prostate cancer was defined as cases who died of prostate cancer (ICD-9=185 or ICD-10=C61). Matching variables included age at blood collection (± 1 year), and date of baseline blood collection (± 30 days).
P-value for Chemical Class was derived from the Gene-Set Analysis using all metabolites in the specific super-class pathway.
Only thioproline showed effect modification by latent time (P=0.002 and FDR q-value =0.055 for interaction), with a stronger lethal prostate cancer association observed within 18 years of serum collection (Supplementary Figure S3). No metabolite was significantly associated with lethal prostate cancer risk at an FDR of <0.15 when we restricted follow-up time to less than 10 years from serum collection to prostate cancer death; however, there were only 59 case-control sets in that early period (all FDR q-value>0.6, Supplementary Table S3). Stratification based on baseline BMI below and above the median of 26 kg/m2 revealed that associations with N-acetylserine, 1-linoleoyl-GPC (18:2) and pseudouridine were stronger among individuals with lower BMI, whereas dihydroorotate and 2’-O-methyluridine were more prominently associated in overweight and obese men (interaction P-values=0.04–0.09; all FDR q-values≥0.60 and lack of statistical significance).
Based on Pearson correlation coefficients, a correlation heat-map of the metabolites associated with lethal prostate cancer is shown in Figure 1. Higher positive correlations were seen within the fibrinogen cleavage peptide and gamma-glutamyl amino acid chemical sub-classes.
Figure 1.
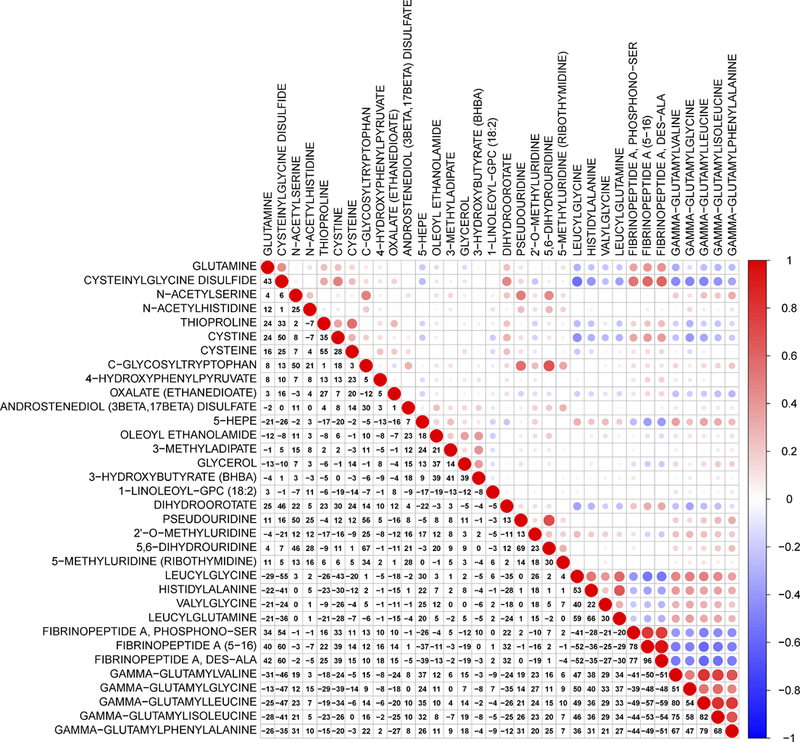
A heat map of correlation coefficients among metabolites associated with lethal prostate cancer. The colors represent the association directions of Pearson correlation coefficients, with red indicating positive correlations, and blue indicating negative correlations. Magnitudes of the correlation coefficients are represented by both numerical percents and circle sizes (i.e., larger circles for stronger correlations).
GSA identified an association between lethal prostate cancer and the peptide class pathway (P<0.0001). The analysis also identified associations with chemical sub-classes for dipeptides, uracil-containing pyrimidines, gamma-glutamyl amino acids, glycine/serine/threonine, polyunsaturated fatty acids (n3 and n6), aminosugars, androgenic steroids, dicarboxylate fatty acids, and endocannabinoids (FDR≤0.1, Table 3). In the PCA analysis, the first principal components of metabolites in pathways of dipeptide, uracil-containing pyrimidine, gamma-glutamyl amino acid, glycine/serine/threonine, polyunsaturated fatty acid (n3 and n6), aminosugar, and endocannabinoid metabolism, were positively associated with overall lethal prostate cancer risk, representing 10% to 36% risk in increment per 1-s.d. pathway-score increase in the log-scale (FDR<0.15, Table 3). In the selected chemical sub-classes, the interconnected networks built with Gaussian graphical models for metabolites with conditional correlations (r ≤−0.2 or ≥0.2) are represented in Figure 2. We then repeated the GSA in subsets stratified by time between baseline and prostate cancer death. Similar results were obtained in the analysis focused on cases diagnosed within 18 years of blood collection (FDR<0.15, Table 3), but associations were weaker among cases diagnosed more than 18 years after baseline blood collection (FDR≥0.32, Table 3).
Table 3.
Gene-set analysis (GSA) and principal components analysis (PCA) for the association between chemical sub-classes of serum metabolites and lethal prostate cancer risk in the ATBC Study a
| Sub-class pathway | No. of contributing metabolites |
GSA analysis | PCA analysis | |||
|---|---|---|---|---|---|---|
| P-value | GSA q-value | OR (95% CI) for pattern score b |
P-value | q-value | ||
| Overall lethal prostate cancer | ||||||
| Dipeptide | 9 | <0.0001 | <0.001 | 1.36 (1.17, 1.58) | 5.8×10⁻⁵ | 0.0012 |
| Pyrimidine metabolism, uracil containing | 10 | <0.0001 | <0.001 | 1.32 (1.16, 1.50) | 3.7×10⁻⁵ | 0.0012 |
| Gamma-glutamyl amino acid | 16 | 0.002 | 0.013 | 1.20 (1.05, 1.37) | 0.0093 | 0.074 |
| Glycine, serine and threonine metabolism | 9 | 0.006 | 0.029 | 1.10 (0.97, 1.25) | 0.12 | 0.40 |
| Polyunsaturated fatty acid (n3 and n6) | 14 | 0.008 | 0.031 | 1.17 (1.02, 1.33) | 0.022 | 0.12 |
| Aminosugar metabolism | 5 | 0.027 | 0.087 | 1.18 (1.03, 1.35) | 0.017 | 0.12 |
| Androgenic steroids | 21 | 0.033 | 0.092 | 1.08 (0.96, 1.21) | 0.23 | 0.46 |
| Fatty acid, dicarboxylate | 23 | 0.038 | 0.092 | 1.14 (1.004, 1.29) | 0.044 | 0.17 |
| Endocannabinoid | 11 | 0.049 | 0.10 | 1.16 (1.02, 1.33) | 0.025 | 0.12 |
| Time to prostate cancer death c: 0–18 y | ||||||
| Pyrimidine metabolism, uracil containing | 10 | 0.001 | 0.031 | 1.35 (1.12, 1.64) | 0.002 | 0.044 |
| Dipeptide | 9 | 0.002 | 0.031 | 1.36 (1.13, 1.64) | 0.001 | 0.044 |
| Fibrinogen cleavage peptide | 5 | 0.006 | 0.055 | 0.78 (0.66, 0.93) | 0.0060 | 0.052 |
| Glutathione metabolism | 7 | 0.007 | 0.055 | 0.78 (0.65, 0.93) | 0.0054 | 0.052 |
| Pyrimidine metabolism, cytidine containing | 5 | 0.015 | 0.094 | 0.77 (0.65, 0.93) | 0.0049 | 0.052 |
| Gamma-glutamyl amino acid | 16 | 0.022 | 0.10 | 1.20 (1.02, 1.41) | 0.027 | 0.17 |
| Polyunsaturated fatty acid (n3 and n6) | 14 | 0.023 | 0.10 | 1.23 (1.02, 1.49) | 0.029 | 0.17 |
| Fatty acid, dicarboxylate | 23 | 0.033 | 0.13 | 1.19 (0.997, 1.43) | 0.054 | 0.26 |
| Time to prostate cancer death c: >18 y | ||||||
| Pyrimidine metabolism, uracil containing | 10 | 0.008 | 0.32 | 1.29 (1.08, 1.54) | 0.006 | 0.21 |
| Dipeptide | 9 | 0.011 | 0.32 | 1.36 (1.06, 1.76) | 0.017 | 0.30 |
| Aminosugar metabolism | 5 | 0.077 | 0.94 | 1.20 (0.98, 1.47) | 0.075 | 0.54 |
| Fibrinogen cleavage peptide | 5 | 0.082 | 0.94 | 0.84 (0.68, 1.03) | 0.099 | 0.54 |
| Histidine metabolism | 14 | 0.14 | 0.94 | 1.12 (0.94, 1.33) | 0.21 | 0.54 |
| Endocannabinoid | 11 | 0.15 | 0.94 | 1.17 (0.96, 1.41) | 0.12 | 0.54 |
Abbreviations: OR = odds ratio, CI = confidence interval, s.d. = standard deviation, ATBC = Alpha-Tocopherol, Beta-Carotene Cancer Prevention, ICD = International Classification of Diseases.
Statistical significance of pathway analysis is defined as false discovery rate < 0.15 and P-value <0.05. The GSA Sub-class pathway analysis for overall lethal prostate cancer is based on 523 cases and 523 controls, for time to prostate cancer death (0–18 years) analysis is based on 263 cases and 263 controls. GSA and PCA q-value calculations are based on 59 tests.
Odds ratio per 1 s.d. increase in pattern score derived from PCA analysis (mean = 0, s.d. = 1). Lethal prostate cancer was defined as cases who died of prostate cancer (ICD-9=185 or ICD-10=C61).
Time to prostate cancer death: time (median split) from blood collection to prostate cancer death for cases, and their matched controls.
Figure 2.
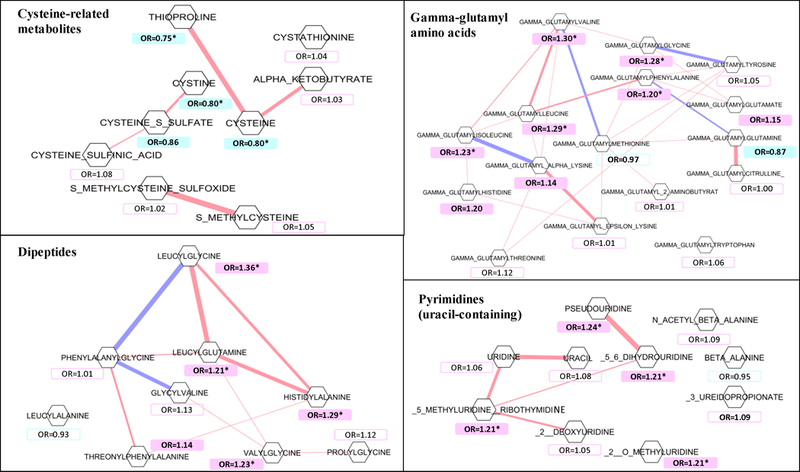
Gaussian graphical model of metabolites in the chemical sub-class pathways most related to lethal prostate cancer risk in the study. Metabolites are drawn as hexagons, and the pairs with an absolute value of conditional correlation ≥0.2 are connected by a line. The colors represent the association directions of conditional correlations, with pink indicating positive conditional correlations, and blue indicating negative conditional correlations. Magnitude of the conditional correlations are represented by line width (i.e., wider lines for stronger correlations). Hexagons are color-labelled by their associations with lethal prostate cancer (p-value <0.05), with pink indicating a positive association with lethal disease, with blue indicating an inverse association. Metabolites with an asterisk indicates that the association with an FDR<0.15. ATBC, Alpha-Tocopherol, Beta-Carotene Cancer Prevention.
Conditional logistic regression models of serum cysteine-related metabolites on a continuous scale showed ORs of 0.71–0.80 for lethal prostate cancer risk per 1-s.d. increment on the log-scale (P=1.10×10⁻⁵-0.0040; Table 4). Men in the top quartile of these amino acids were at 27%−47% reduced risk, compared to those in the lowest quartile (Table 4). Results were similar after adjustment for potential confounding factors (Table 4). The combined cysteine related-metabolites stratified by time from serum collection to prostate cancer death revealed stronger associations within 18 years (Supplementary Table S4).
Table 4.
ORs and 95% CIs from conditional logistic regression for the association between cysteine related-metabolites (thioproline, cysteine, and cystine) and lethal prostate cancer risk in the ATBC Study
| Model | Thioproline | Cysteine | Cystine | Thioproline, cysteine, and cystine a |
|---|---|---|---|---|
| Crude model adjusting for matching factors | ||||
| Continuous | ||||
| Per s.d. | 0.75 (0.65, 0.86) | 0.80 (0.68, 0.93) | 0.80 (0.70, 0.91) | 0.71 (0.61, 0.83) |
| P | 8.2×10⁻⁵ | 0.004 | 0.0008 | 1.1×10⁻⁵ |
| Quartile categories | ||||
| First | 1.0 (referent) | 1.0 (referent) | 1.0 (referent) | 1.0 (referent) |
| Second | 0.93 (0.65, 1.34) | 0.81 (0.56, 1.18) | 0.78 (0.55, 1.11) | 0.77 (0.54, 1.10) |
| Third | 0.68 (0.47, 0.99) | 0.63 (0.42, 0.93) | 0.65 (0.45, 0.93) | 0.67 (0.47, 0.96) |
| Fourth | 0.54 (0.37, 0.79) | 0.57 (0.37, 0.87) | 0.73 (0.51, 1.05) | 0.53 (0.36, 0.78) |
| P for trend b | 0.0005 | 0.006 | 0.048 | 0.0011 |
| Multivariable-adjusted model c | ||||
| Continuous | ||||
| Per s.d. | 0.73 (0.63, 0.85) | 0.79 (0.67, 0.93) | 0.78 (0.68, 0.90) | 0.70 (0.59, 0.82) |
| P | 6.3×10⁻⁵ | 0.0038 | 0.0005 | 6.6×10⁻⁶ |
| Quartile categories | ||||
| First | 1.0 (referent) | 1.0 (referent) | 1.0 (referent) | 1.0 (referent) |
| Second | 0.89 (0.61, 1.29) | 0.83 (0.57, 1.21) | 0.80 (0.56, 1.14) | 0.76 (0.53, 1.09) |
| Third | 0.66 (0.45, 0.96) | 0.64 (0.43, 0.96) | 0.63 (0.43, 0.91) | 0.63 (0.44, 0.92) |
| Fourth | 0.51 (0.34, 0.76) | 0.56 (0.36, 0.87) | 0.73 (0.50, 1.06) | 0.50 (0.33, 0.75) |
| P for trend b | 0.0003 | 0.0055 | 0.039 | 0.0006 |
Abbreviations: OR = odds ratio, CI = confidence interval, s.d. = standard deviation, ATBC = Alpha-Tocopherol, Beta-Carotene Cancer Prevention, ICD = International Classification of Diseases.
The cysteine-related metabolite combination (thioproline, cysteine, and cystine) is modeled based on the formula: β1X1 + β2X2 + β3X3, Xj denoting the standardized value from the jth metabolite, and βj denoting the coefficient of the metabolite from regression model. Lethal prostate cancer was defined as cases who died of prostate cancer (ICD-9=185 or ICD-10=C61).
P for trend: the statistical significance of the coefficient of the quartile variable (median value within each quartile).
Model adjusting for matching factors, BMI, smoking, ATBC intervention group, and baseline serum total cholesterol, HDL cholesterol, alpha-tocopherol and retinol. Matching variables included age at blood collection (± 1 year), and date of baseline blood collection (± 30 days).
Unconditional logistic regression models of metastatic disease (179 cases diagnosed with metastatic prostate cancer and who subsequently died from their disease) showed that 17 out of 860 identified serum metabolites were associated with risk of fatal prostate cancer in men with metastatic disease at diagnosis at an FDR<0.15 (Table 5), including two amino acids, 13 lipids, a nucleotide and a peptide. We observed higher risk for several elevated lipids, including the ketone body 3-hydroxybutyrate (BHBA), acyl carnitines hexanoylglycine and 3-hydroxybutyroylglycine and acetoacetate, dicarboxylate fatty acid 3-methyladipate, N-acetylglycine, and pimeloylcarnitine/3-methyladipoylcarnitine (per 1-s.d., 1.37≤OR≤1.49, FDR<0.15) (Table 5). The lysophospholipid 1-linoleoyl-GPC (18:2) was inversely associated (OR≤0.76, FDR<0.15; Table 5). Other acyl carnitines and dicarboxylic and monohydroxy fatty acids were similarly associated with metastatic disease (FDR<0.15; Table 5), and of 88 metabolites associated at P<0.05, 56 were lipids. By contrast, the risk associations among the 213 cases without metastases at diagnosis were inverse with fibrinogen cleavage peptides, two amino acids, and 2’-O-methylcytidine (per 1-s.d., 0.68≤OR≤0.73, FDR<0.15; Supplementary Table S5). At the nominal P<0.05 threshold, only 6 serum lipids out of 69 metabolites were associated with non-metastatic disease.
Table 5.
ORs and 95% CIs from unconditional logistic regression (per 1-s.d.) for the association between serum metabolites and lethal prostate cancer with distant metastasis at diagnosis in the ATBC Study (FDR<0.15) a
| Metabolite b | Sub-class pathway | OR c | 95% CI | P-value | Q-value |
|---|---|---|---|---|---|
| Amino acids and amino acid derivatives |
|||||
| N-Acetylglycine | Glycine, serine and threonine metabolism | 1.37 | 1.14, 1.65 | 0.00065 | 0.083 |
| Pro-hydroxy-pro | Urea cycle; arginine and proline metabolism | 1.32 | 1.10, 1.59 | 0.0025 | 0.13 |
| Lipids | |||||
| Pimeloylcarnitine/3-methyladipoylcarnitine (C7-DC) | Fatty acid metabolism (acyl carnitine) | 1.40 | 1.15, 1.69 | 0.00066 | 0.083 |
| Suberoylcarnitine (C8-DC) | Fatty acid metabolism (acyl carnitine) | 1.37 | 1.13, 1.66 | 0.0013 | 0.11 |
| Adipoylcarnitine (C6-DC) | Fatty acid metabolism (acyl carnitine) | 1.32 | 1.11, 1.58 | 0.0020 | 0.13 |
| Hexanoylglycine | Fatty acid metabolism (acyl glycine) | 1.49 | 1.22, 1.83 | 0.000088 | 0.033 |
| 3-Hydroxybutyroylglycine | Fatty acid metabolism (acyl glycine) | 1.40 | 1.16, 1.69 | 0.00037 | 0.083 |
| 3-Methyladipate | Fatty acid, dicarboxylate | 1.40 | 1.16, 1.70 | 0.00048 | 0.083 |
| Hexadecenedioate (C16:1-DC) | Fatty acid, dicarboxylate | 1.34 | 1.12, 1.60 | 0.0013 | 0.11 |
| Suberate (C8-DC) | Fatty acid, dicarboxylate | 1.32 | 1.10, 1.59 | 0.0032 | 0.14 |
| 3-Hydroxysebacate | Fatty acid, monohydroxy | 1.35 | 1.12, 1.64 | 0.0020 | 0.13 |
| 3-Hydroxyoctanoate | Fatty acid, monohydroxy | 1.32 | 1.10, 1.59 | 0.0030 | 0.14 |
| 3-Hydroxybutyrate (BHBA) | Ketone bodies | 1.46 | 1.22, 1.75 | 3.8×10⁻⁵ | 0.029 |
| Acetoacetate | Ketone bodies | 1.36 | 1.13, 1.64 | 0.0014 | 0.11 |
| 1-Linoleoyl-GPC (18:2) | Lysophospholipid | 0.76 | 0.64, 0.91 | 0.0024 | 0.13 |
| Nucleotide | |||||
| 2’-O-Methyluridine | Pyrimidine metabolism, uracil containing | 1.33 | 1.11, 1.58 | 0.0014 | 0.11 |
| Peptide | |||||
| Gamma-Glutamylglycine | Gamma-glutamyl amino acid | 1.36 | 1.11, 1.67 | 0.0028 | 0.14 |
Abbreviations: OR = odds ratio, CI = confidence interval, s.d. = standard deviation, ATBC = Alpha-Tocopherol, Beta-Carotene Cancer Prevention, FDR = false discovery rate.
Metabolites with FDR (q-value) < 0.15 were included in the table.
Metabolites were log transformed and standardized (mean = 0, s.d. = 1).
We used unconditional logistic regression models adjusted for age at blood collection, date of baseline blood collection, and time interval from blood collection to cancer diagnosis (or index date of their originally matched cases, for controls) to estimate odds ratio per 1-s.d. increase in metabolite level, on the basis of 179 M1 cases and 523 controls. Lethal cases with metastatic disease were defined as those with distant metastasis (M1) at clinical diagnosis.
Discussion
To the best of our knowledge, this is the largest prospective metabolomic analysis of lethal prostate cancer to date. With an average time from blood collection to prostate cancer death of 18 years, 34 serum metabolites in multiple biochemical pathways were associated with lethal disease. We found oxidative stress-related thioproline, and its combination with two other cysteine-related metabolites, as top molecular species inversely associated with risk. By contrast, serum dipeptides including leucylglycine, as well as several gamma-glutamyl amino acids, were associated with higher risk of lethal prostate cancer. Cases with metastatic disease at diagnosis showed strong associations with elevated fatty acid metabolites and ketone bodies.
The inverse associations we observed between lethal prostate cancer and serum thioproline, cysteine, and cystine, which appeared stronger in the first 18 years of follow-up, are consistent with experimental evidence.17–20 Given the fact that metabolomic data are scant for fatal prostate cancer, we examined the cysteine-related metabolic score in 298 aggressive prostate cancers (cancer stage III/IV at diagnosis based on the tumour-node-metastasis staging system, or a tumor Gleason score ≥8) and their matched controls from a previously published analysis in the Prostate, Lung, Colorectal, and Ovarian Cancer Screening Trial (PLCO)7 and found a 1-SD increment ORaggressive prostate cancer of 0.91 (95% CI: 0.75, 1.11, P=0.35). Further, examining only aggressive cases diagnosed within 8 years of blood collection (N=64) showed a stronger association for the cysteine-related metabolic score (1-SD, ORaggressive prostate cancer= 0.74, 95% CI: 0.50–1.12, P=0.16), a finding essentially consistent with the present analysis, and supportive of a role for alterations in redox metabolism in prostate cancer etiology or early detection. Thioproline, or thiazolidine-4-carboxylic acid, is a cyclic sulfur amino acid and condensation product of cysteine and formaldehyde,21 that, along with cysteine, functions as an intracellular sulfhydryl antioxidant and free radical scavenger to reduce cellular membrane and organelle oxygen-radical damage of relevance to carcinogenesis.22 Genetic alterations and rapid cell proliferation resulting in greater oxidative stress from reactive oxygen species (ROS) have been reported in various cancers, including prostate cancer.18 As the biosynthetic precursor of intracellular glutathione (GSH), the extracellular cysteine pool including its disulfide form, cystine, can act as a redox buffer that tumor cells require to maintain an adequate antioxidant-redox balance.19, 23 For example, experimental data show that cyst(e)inase treatment results in sustained depletion of extracellular cysteine and prostate carcinoma allograft growth suppression.20
We identified several gamma-glutamyl peptides and dipeptides directly related to increased lethal prostate cancer risk. Gamma-glutamylpeptidase (GGT) liberates free gamma-glutamyl peptides through the breakdown of glutathione and is a clinical indicator of chronic liver disease.24 Circulating gamma-glutamyl peptides have been associated with risk of hepatocellular carcinoma,24 and studies showed that elevated serum GGT is related to higher risk of overall and site-specific cancers, including prostate cancer.25, 26 Collectively, data from prior studies provide evidence that redox imbalance and peptide metabolism impact prostate tumorigenesis, and data from the present study support such a role in lethal disease specifically.
The serum pyrimidines pseudouridine, 5,6-dihydrouridine, 2’-O-methyluridine and 5-methyluridine were elevated in cases compared to their matched control subjects, and the overall pathway showed a strong association. Pseudouridine is a modified nucleoside generated from the degradation of transfer RNA (tRNA), and previous studies have demonstrated elevated levels of modified nucleosides, particularly pseudouridine, in the biological fluids of cancer patients when compared with cancer-free controls.27, 28 Dihydrouridine is one of the most common modifications of tRNA and has been related to cancer,29, 30 cancer cell growth and survival.30 Our data also showed that serum dihydroorotate was inversely associated with lethal prostate cancer risk. Dihydroorotate dehydrogenase (DHODH), localized to the mitochondrial membranes, catalyzes the conversion of dihydroorotate to orotate, leading to de novo pyrimidine biosynthesis which may facilitate tumor growth. A recent tissue-based RNA expression analysis provided evidence supporting a role for pyrimidine metabolism in prostate cancers.31
Dysregulation of lipid metabolism and particularly alterations in fatty acids have been increasingly recognized to influence carcinogenesis. Only a few serum lipids were positively associated with lethal prostate cancer in our study, including polyunsaturated fatty acids, androgens, and the eicosanoid 5-HETE. Notwithstanding laboratory-based data that eicosapentaenoic acid may suppress prostate carcinogenesis, we found that the polyunsaturated fatty acid (n3 and n6) pathway was associated with increased risk (as were androgenic steroids), consistent with previous population-based studies.7, 32 The inflammatory biomarker 5-HETE, a metabolic product of arachidonic acid concentrated in prostate adenocarcinoma tissue,33 was also related to higher risk of lethal prostate cancer, consistent with previously observed increased prostate cancer cell proliferation34 and reduced apoptosis.35
Importantly, we observed a strong lipid-dominant metabolomic profile of lethal metastatic disease, including elevated ketone bodies (BHBA), and acyl glycine/acyl carnitine, dicarboxylic and monohydroxy fatty acids, and lower serum lysophospholipid 1-linoleoyl-GPC (18:2). Alterations of BHBA potentially drive tumor progression and metastasis,36 and higher circulating BHBA has been associated with other cancers including liver, esophagus, ovary and endometrium.37–40 The higher circulating fatty acids we identified in cases with metastatic disease could indicate de novo biosynthesis or lipolytic triglyceride mobilization of fatty acids in response to the increased membrane lipid bilayer and cell proliferation requirements of these aggressive cancers.41–43 Upregulated fatty acid biosynthesis is also critical for increased acylcarnitine beta-oxidation for mitochondrial ATP production.41, 44
In addition to the present study nested within the ATBC cohort, five prospective studies of metabolites and prostate cancer risk have been published, including two others nested within the ATBC study,4, 5 and one each in the EPIC study,8 EPIC-Heidelberg,6 and PLCO.45 The reported metabolomic profiles of risk differ considerably among these studies, probably as a result of differences in parent study designs (including cancer screening and fasting status), sample sizes, source populations, assay platforms, and time from blood collection to cancer diagnosis (or death). For example, in the five prior studies, the control participants were selected from among those who were alive and free of cancer at the time of diagnosis of the case, whereas controls in the present study were selected based on vital status and being free of cancer at the time of prostate cancer death. In addition, the EPIC study was the only other one to report on fatal prostate cancer risk. This study included only 127 fatal cases and 122 measured metabolites (of which >60% were glycerophospholipids), however, as compared with the present analysis of 523 fatal prostate cancers and 860 metabolites representing eight chemical class pathways. The metabolomic profile of primarily non-lethal disease in previous studies showed nominal associations for lipids, and TCA cycle and amino acid metabolites, including especially glycerophospholipids, inositols and sphingomyelins.4–8 For example, of the several glycerophopholipids we originally found associated with aggressive prostate cancer in this same cohort,5 only 1-linoleoyl-GPC (18:2) was related to lethal disease in the present analysis (and in the same association direction). The nested case-control subset analysis of 127 fatal prostate cancers in EPIC study found seven metabolites nominally associated with lethal disease.8 Only two of these (methionine and trans-4-hydroxyproline) were identified in the present study, however, and no significant associations were found. On the other hand, there was one metabolite identified in our study [acetylcarnitine (C2)] that is closely related to the acetylcarnitine (C3) identified in the EPIC study that showed a similar increased risk of fatal prostate cancer (OR=1.68, 95% CI: 1.14, 2.49, P=0.009). This compares with the present findings for acetylcarnitine (C2): OR=1.17, 95% CI: 1.03, 1.33, P=0.014 (overall analysis, data not shown); for follow-up time ≤10 years from serum collection to prostate cancer death, OR=1.54, 95% CI: 1.05, 2.25, P=0.028 (Supplementary Table S3).
Strengths of our investigation include its relatively large sample size and that metabolites were measured in serum collected up to three decades prior to prostate cancer death. Ascertainment of lethal cases was from census-based Finnish population cancer and mortality registries with complete follow-up and high accuracy. Using an untargeted approach with good laboratory validity and reproducibility, we were able to identify nearly 900 metabolites representing a large number of biochemical pathways. Limitations of this study deserve consideration, including that the homogenous nature of the male smoker population of European ancestry may limit generalizability of our findings to other populations, and the lack of validation from an external study. Our metabolomic profile was of single serum samples collected at baseline, and assays of two or more samples from the same individual at different time points may have provided more accurate metabolite estimates. Measurement error may exist for the metabolomic profile measurement. It is important to point out, however, that any such misclassification should be nondifferential between metabolite measurement groups and would theoretically only influence our findings toward the null. The extensive panel of metabolites identified by the HRAM platform is advantageous for discovery, but at the same time precluded our ability to validate the findings because of the large number of metabolites not measured in other studies. Finally, although we adjusted for potential confounding factors in the sensitivity analyses, unmeasured or residual confounding remains possible.
In conclusion, this study identified a novel serum metabolite profile up to three decades prior to prostate cancer death that is characterized by multiple altered biochemicals in redox, dipeptide, pyrimidine and gamma-glutamyl amino acid pathways. Of note, as the stronger inverse association of the redox metabolites within the first 18 years suggested reverse causality, it may be supportive of a role for alterations in redox metabolism in prostate cancer early detection. The observed profile differs from prior smaller studies that included cases of non-aggressive and aggressive disease that were predominantly not fatal. Men diagnosed with metastatic disease prospectively showed a prominent lipid profile comprised of ketone bodies and fatty acids. Our findings warrant both re-examination in other prospective studies and investigation of the underlying pathogenic molecular mechanisms.
Supplementary Material
What’s New?
The associations between serum metabolites and risk of lethal prostate cancer (LPC) years in advance of diagnosis were examined using untargeted mass-spectrometry-based metabolomics. Increased oxidative stress-related thioproline and two other cysteine-related metabolites were prominently associated with lower LPC risk. By contrast, dipeptides including leucylglycine, and several gamma-glutamyl amino acids, were related to elevated risk. This prospective molecular pattern points to a role for redox and peptide metabolism in LPC, and provides potential leads regarding the molecular basis of its pathogenesis.
Acknowledgements
We appreciate all participants in the ATBC cohort for their contributions to this study.
Funding: The ATBC Study is supported by the Intramural Research Program of the U.S. National Cancer Institute, National Institutes of Health, and by U.S. Public Health Service contract HHSN261201500005C from the National Cancer Institute, Department of Health and Human Services.
Abbreviations
- ATBC
Alpha-Tocopherol, Beta-Carotene Cancer Prevention
- BMI
body mass index
- CIs
confidence intervals
- CV
coefficients of variation
- DHODH
dihydroorotate dehydrogenase
- EPIC
European Prospective Investigation into Cancer and Nutrition
- FDR
false discovery rate
- GGT
gamma-glutamylpeptidase
- GSA
Gene-Set Analysis
- HDL
high-density lipoprotein
- HPLC
high-performance liquid chromatography
- HRAM
high-resolution accurate mass
- ICC
intraclass correlation coefficients
- ICD
International Classification of Diseases
- LC-MS/MS
liquid chromatography/tandem mass spectrometry
- OR
odds ratios
- PCA
principal component analysis
- PLCO
Prostate, Lung, Colorectal, and Ovarian Cancer Screening Trial
- ROS
reactive oxygen species
- SD
standard deviation
- tRNA
transfer RNA
Footnotes
Competing interests
The authors declare that they have no competing interests.
Ethics approval and consent to participate
This study complies with the Declaration of Helsinki. The ATBC Study was approved by institutional review boards at the U.S. National Cancer Institute and the Finnish National Public Health Institute. All participants provided written informed consent.
References
- 1.Prensner JR, Rubin MA, Wei JT, Chinnaiyan AM. Beyond PSA: the next generation of prostate cancer biomarkers. Sci Transl Med 2012;4: 127rv3. [DOI] [PMC free article] [PubMed] [Google Scholar]
- 2.Dunn WB, Broadhurst DI, Atherton HJ, Goodacre R, Griffin JL. Systems level studies of mammalian metabolomes: the roles of mass spectrometry and nuclear magnetic resonance spectroscopy. Chem Soc Rev 2011;40: 387–426. [DOI] [PubMed] [Google Scholar]
- 3.Kelly RS, Vander Heiden MG, Giovannucci E, Mucci LA. Metabolomic Biomarkers of Prostate Cancer: Prediction, Diagnosis, Progression, Prognosis, and Recurrence. Cancer Epidemiol Biomarkers Prev 2016;25: 887–906. [DOI] [PMC free article] [PubMed] [Google Scholar]
- 4.Mondul AM, Moore SC, Weinstein SJ, Mannisto S, Sampson JN, Albanes D. 1-stearoylglycerol is associated with risk of prostate cancer: results from serum metabolomic profiling. Metabolomics 2014;10: 1036–41. [DOI] [PMC free article] [PubMed] [Google Scholar]
- 5.Mondul AM, Moore SC, Weinstein SJ, Karoly ED, Sampson JN, Albanes D. Metabolomic analysis of prostate cancer risk in a prospective cohort: The alpha-tocolpherol, beta-carotene cancer prevention (ATBC) study. Int J Cancer 2015;137: 2124–32. [DOI] [PMC free article] [PubMed] [Google Scholar]
- 6.Kuhn T, Floegel A, Sookthai D, Johnson T, Rolle-Kampczyk U, Otto W, von Bergen M, Boeing H, Kaaks R. Higher plasma levels of lysophosphatidylcholine 18:0 are related to a lower risk of common cancers in a prospective metabolomics study. BMC Med 2016;14: 13. [DOI] [PMC free article] [PubMed] [Google Scholar]
- 7.Huang J, Mondul AM, Weinstein SJ, Koutros S, Derkach A, Karoly E, Sampson JN, Moore SC, Berndt SI, Albanes D. Serum metabolomic profiling of prostate cancer risk in the prostate, lung, colorectal, and ovarian cancer screening trial. Br J Cancer 2016;115: 1087–95. [DOI] [PMC free article] [PubMed] [Google Scholar]
- 8.Schmidt JA, Fensom GK, Rinaldi S, Scalbert A, Appleby PN, Achaintre D, Gicquiau A, Gunter MJ, Ferrari P, Kaaks R, Kuhn T, Floegel A, et al. Pre-diagnostic metabolite concentrations and prostate cancer risk in 1077 cases and 1077 matched controls in the European Prospective Investigation into Cancer and Nutrition. BMC Med 2017;15: 122. [DOI] [PMC free article] [PubMed] [Google Scholar]
- 9.The alpha-tocopherol, beta-carotene lung cancer prevention study: design, methods, participant characteristics, and compliance. The ATBC Cancer Prevention Study Group. Ann Epidemiol 1994;4: 1–10. [DOI] [PubMed] [Google Scholar]
- 10.Milne DB, Botnen J. Retinol, alpha-tocopherol, lycopene, and alpha- and beta-carotene simultaneously determined in plasma by isocratic liquid chromatography. Clin Chem 1986;32: 874–6. [PubMed] [Google Scholar]
- 11.Evans AM BB, Liu Q, Mitchell MW, Robinson RJ, et al. High Resolution Mass Spectrometry Improves Data Quantity and Quality as Compared to Unit Mass Resolution Mass Spectrometry in High-Throughput Profiling Metabolomics. Metabolomics 2014;4:132. doi: 10.4172/2153-0769.1000132. [DOI] [Google Scholar]
- 12.Sumner LW, Amberg A, Barrett D, Beale MH, Beger R, Daykin CA, Fan TW, Fiehn O, Goodacre R, Griffin JL, Hankemeier T, Hardy N, et al. Proposed minimum reporting standards for chemical analysis Chemical Analysis Working Group (CAWG) Metabolomics Standards Initiative (MSI). Metabolomics 2007;3: 211–21. [DOI] [PMC free article] [PubMed] [Google Scholar]
- 13.Subramanian A, Tamayo P, Mootha VK, Mukherjee S, Ebert BL, Gillette MA, Paulovich A, Pomeroy SL, Golub TR, Lander ES, Mesirov JP. Gene set enrichment analysis: a knowledge-based approach for interpreting genome-wide expression profiles. Proc Natl Acad Sci U S A 2005;102: 15545–50. [DOI] [PMC free article] [PubMed] [Google Scholar]
- 14.Jeelani G, Sato D, Soga T, Watanabe H, Nozaki T. Mass spectrometric analysis of L-cysteine metabolism: physiological role and fate of L-cysteine in the enteric protozoan parasite Entamoeba histolytica. MBio 2014;5: e01995. [DOI] [PMC free article] [PubMed] [Google Scholar]
- 15.Bartel J, Krumsiek J, Theis FJ. Statistical methods for the analysis of high-throughput metabolomics data. Comput Struct Biotechnol J 2013;4: e201301009. [DOI] [PMC free article] [PubMed] [Google Scholar]
- 16.Krumsiek J, Suhre K, Illig T, Adamski J, Theis FJ. Gaussian graphical modeling reconstructs pathway reactions from high-throughput metabolomics data. BMC Syst Biol 2011;5: 21. [DOI] [PMC free article] [PubMed] [Google Scholar]
- 17.Bounous G, Beer D. Molecular pathogenesis and prevention of prostate cancer. Anticancer Res 2004;24: 553–4. [PubMed] [Google Scholar]
- 18.Chaiswing L, Zhong W, Oberley TD. Increasing discordant antioxidant protein levels and enzymatic activities contribute to increasing redox imbalance observed during human prostate cancer progression. Free Radic Biol Med 2014;67: 342–52. [DOI] [PMC free article] [PubMed] [Google Scholar]
- 19.Chaiswing L, Zhong W, Liang Y, Jones DP, Oberley TD. Regulation of prostate cancer cell invasion by modulation of extra- and intracellular redox balance. Free Radic Biol Med 2012;52: 452–61. [DOI] [PMC free article] [PubMed] [Google Scholar]
- 20.Cramer SL, Saha A, Liu J, Tadi S, Tiziani S, Yan W, Triplett K, Lamb C, Alters SE, Rowlinson S, Zhang YJ, Keating MJ, et al. Systemic depletion of L-cyst(e)ine with cyst(e)inase increases reactive oxygen species and suppresses tumor growth. Nat Med 2017;23: 120–7. [DOI] [PMC free article] [PubMed] [Google Scholar]
- 21.Cavallini D, De Marco C, Mondovi B, Trasarti F. Studies of the metabolism of thiazolidine carboxylic acid by rat liver homogenate. Biochim Biophys Acta 1956;22: 558–64. [DOI] [PubMed] [Google Scholar]
- 22.Tsuda M, Kurashima Y. Nitrite-trapping capacity of thioproline in the human body. IARC Sci Publ 1991: 123–8. [PubMed] [Google Scholar]
- 23.Moriarty-Craige SE, Jones DP. Extracellular thiols and thiol/disulfide redox in metabolism. Annu Rev Nutr 2004;24: 481–509. [DOI] [PubMed] [Google Scholar]
- 24.Fitian AI, Nelson DR, Liu C, Xu Y, Ararat M, Cabrera R. Integrated metabolomic profiling of hepatocellular carcinoma in hepatitis C cirrhosis through GC/MS and UPLC/MS-MS. Liver Int 2014;34: 1428–44. [DOI] [PMC free article] [PubMed] [Google Scholar]
- 25.Van Hemelrijck M, Jassem W, Walldius G, Fentiman IS, Hammar N, Lambe M, Garmo H, Jungner I, Holmberg L. Gamma-glutamyltransferase and risk of cancer in a cohort of 545,460 persons - the Swedish AMORIS study. Eur J Cancer 2011;47: 2033–41. [DOI] [PubMed] [Google Scholar]
- 26.Kunutsor SK, Laukkanen JA. Gamma-glutamyltransferase and risk of prostate cancer: Findings from the KIHD prospective cohort study. Int J Cancer 2017;140: 818–24. [DOI] [PubMed] [Google Scholar]
- 27.Zhang T, Wu X, Ke C, Yin M, Li Z, Fan L, Zhang W, Zhang H, Zhao F, Zhou X, Lou G, Li K. Identification of potential biomarkers for ovarian cancer by urinary metabolomic profiling. J Proteome Res 2013;12: 505–12. [DOI] [PubMed] [Google Scholar]
- 28.Perez-Rambla C, Puchades-Carrasco L, Garcia-Flores M, Rubio-Briones J, Lopez-Guerrero JA, Pineda-Lucena A. Non-invasive urinary metabolomic profiling discriminates prostate cancer from benign prostatic hyperplasia. Metabolomics 2017;13: 52. [DOI] [PMC free article] [PubMed] [Google Scholar]
- 29.Byrne RT, Jenkins HT, Peters DT, Whelan F, Stowell J, Aziz N, Kasatsky P, Rodnina MV, Koonin EV, Konevega AL, Antson AA. Major reorientation of tRNA substrates defines specificity of dihydrouridine synthases. Proc Natl Acad Sci U S A 2015;112: 6033–7. [DOI] [PMC free article] [PubMed] [Google Scholar]
- 30.Kato T, Daigo Y, Hayama S, Ishikawa N, Yamabuki T, Ito T, Miyamoto M, Kondo S, Nakamura Y. A novel human tRNA-dihydrouridine synthase involved in pulmonary carcinogenesis. Cancer Res 2005;65: 5638–46. [DOI] [PubMed] [Google Scholar]
- 31.Kelly RS, Sinnott JA, Rider JR, Ebot EM, Gerke T, Bowden M, Pettersson A, Loda M, Sesso HD, Kantoff PW, Martin NE, Giovannucci EL, et al. The role of tumor metabolism as a driver of prostate cancer progression and lethal disease: results from a nested case-control study. Cancer Metab 2016;4: 22. [DOI] [PMC free article] [PubMed] [Google Scholar]
- 32.Crowe FL, Appleby PN, Travis RC, Barnett M, Brasky TM, Bueno-de-Mesquita HB, Chajes V, Chavarro JE, Chirlaque MD, English DR, Gibson RA, Giles GG, et al. Circulating fatty acids and prostate cancer risk: individual participant meta-analysis of prospective studies. J Natl Cancer Inst 2014;106. [DOI] [PMC free article] [PubMed] [Google Scholar]
- 33.Gupta S, Srivastava M, Ahmad N, Sakamoto K, Bostwick DG, Mukhtar H. Lipoxygenase-5 is overexpressed in prostate adenocarcinoma. Cancer 2001;91: 737–43. [DOI] [PubMed] [Google Scholar]
- 34.Steele VE, Holmes CA, Hawk ET, Kopelovich L, Lubet RA, Crowell JA, Sigman CC, Kelloff GJ. Lipoxygenase inhibitors as potential cancer chemopreventives. Cancer Epidemiol Biomarkers Prev 1999;8: 467–83. [PubMed] [Google Scholar]
- 35.Ghosh J, Myers CE. Inhibition of arachidonate 5-lipoxygenase triggers massive apoptosis in human prostate cancer cells. Proc Natl Acad Sci U S A 1998;95: 13182–7. [DOI] [PMC free article] [PubMed] [Google Scholar]
- 36.Martinez-Outschoorn UE, Lin Z, Whitaker-Menezes D, Howell A, Sotgia F, Lisanti MP. Ketone body utilization drives tumor growth and metastasis. Cell Cycle 2012;11: 3964–71. [DOI] [PMC free article] [PubMed] [Google Scholar]
- 37.Liu Y, Hong Z, Tan G, Dong X, Yang G, Zhao L, Chen X, Zhu Z, Lou Z, Qian B, Zhang G, Chai Y. NMR and LC/MS-based global metabolomics to identify serum biomarkers differentiating hepatocellular carcinoma from liver cirrhosis. Int J Cancer 2014;135: 658–68. [DOI] [PubMed] [Google Scholar]
- 38.Sanchez-Espiridion B, Liang D, Ajani JA, Liang S, Ye Y, Hildebrandt MA, Gu J, Wu X. Identification of Serum Markers of Esophageal Adenocarcinoma by Global and Targeted Metabolic Profiling. Clin Gastroenterol Hepatol 2015;13: 1730–7 e9. [DOI] [PMC free article] [PubMed] [Google Scholar]
- 39.Turkoglu O, Zeb A, Graham S, Szyperski T, Szender JB, Odunsi K, Bahado-Singh R. Metabolomics of biomarker discovery in ovarian cancer: a systematic review of the current literature. Metabolomics 2016;12. [DOI] [PMC free article] [PubMed] [Google Scholar]
- 40.Troisi J, Sarno L, Landolfi A, Scala G, Martinelli P, Venturella R, Di Cello A, Zullo F, Guida M. Metabolomic Signature of Endometrial Cancer. J Proteome Res 2018;17: 804–12. [DOI] [PubMed] [Google Scholar]
- 41.Carracedo A, Cantley LC, Pandolfi PP. Cancer metabolism: fatty acid oxidation in the limelight. Nat Rev Cancer 2013;13: 227–32. [DOI] [PMC free article] [PubMed] [Google Scholar]
- 42.Nomura DK, Long JZ, Niessen S, Hoover HS, Ng SW, Cravatt BF. Monoacylglycerol lipase regulates a fatty acid network that promotes cancer pathogenesis. Cell 2010;140: 49–61. [DOI] [PMC free article] [PubMed] [Google Scholar]
- 43.Nomura DK, Lombardi DP, Chang JW, Niessen S, Ward AM, Long JZ, Hoover HH, Cravatt BF. Monoacylglycerol lipase exerts dual control over endocannabinoid and fatty acid pathways to support prostate cancer. Chem Biol 2011;18: 846–56. [DOI] [PMC free article] [PubMed] [Google Scholar]
- 44.Prentki M, Madiraju SR. Glycerolipid metabolism and signaling in health and disease. Endocr Rev 2008;29: 647–76. [DOI] [PubMed] [Google Scholar]
- 45.Huang J, Weinstein SJ, Kitahara CM, Karoly ED, Sampson JN, Albanes D. A prospective study of serum metabolites and glioma risk. Oncotarget 2017;8: 70366–77. [DOI] [PMC free article] [PubMed] [Google Scholar]
Associated Data
This section collects any data citations, data availability statements, or supplementary materials included in this article.