Abstract
Cellular senescence, an integral component of aging and cancer, arises in response to diverse triggers, including telomere attrition, macromolecular damage and signaling from activated oncogenes. At present, senescent cells are identified by the combined presence of multiple traits, such as senescence-associated protein expression and secretion, DNA damage and β-galactosidase activity; unfortunately, these traits are neither exclusively nor universally present in senescent cells. To identify robust shared markers of senescence, we have performed RNA-sequencing analysis across eight diverse models of senescence triggered in human diploid fibroblasts (WI-38, IMR-90) and endothelial cells (HUVEC, HAEC) by replicative exhaustion, exposure to ionizing radiation or doxorubicin, and expression of the oncogene HRASG12V. The intersection of the altered transcriptomes revealed 50 RNAs consistently elevated and 18 RNAs consistently reduced across all senescence models, including many protein-coding mRNAs and some non-coding RNAs. We propose that these shared transcriptome profiles will enable the identification of senescent cells in vivo, the investigation of their roles in aging and malignancy and the development of strategies to target senescent cells therapeutically.
INTRODUCTION
Senescence is a state of indefinite growth arrest that was first described by Hayflick (1). It can be induced by various sublethal stresses, including telomere shortening, genomic injury, epigenomic damage and signaling from oncoproteins. Common features of cellular senescence include DNA damage, induction of the p53/CDKN1A (p21) and CDKN2A(p16)/pRB pathways, and high activity of senescence-associated β-galactosidase (SA-βGal) at pH 6 (2,3). Other features include cytoskeletal alterations and other changes such as cell flattening and the appearance of vacuoles and senescence-associated heterochromatin foci (SAHF) (4). Senescence is also characterized by a senescence-associated secretory phenotype (SASP) whereby cells produce and secrete pro-inflammatory cytokines like interleukin (IL)6 and IL8, chemokines, matrix metalloproteinases, growth factors and angiogenic factors (5). Senescence is beneficial for tissue remodeling, embryonic development, wound healing and tumor suppression in young individuals (3,6–8). However, in old individuals it promotes aging-associated declines and diseases such as atherosclerosis, liver fibrosis, insulin resistance, Alzheimer’s and Parkinson’s diseases, chronic obstructive pulmonary disease (COPD), age-related chronic inflammation and cancer (2,9–15).
Progress to identify senescent cells in order to exploit them therapeutically has been hampered by a lack of robust and universal measurable traits. Thus far, senescence has been studied in a range of cell types induced by diverse triggers such as replicative exhaustion, DNA damage, oxidation and other stress conditions like signaling through oncoproteins. Due to this heterogeneity, finding broad biomarkers of senescence has been challenging (16) and senescent cells are currently found through the combined detection of multiple biochemical markers such as p16, p53, p21 and SA-βGal, despite the fact that they are not exclusively nor consistently induced in senescence (17–20).
In this study, we sought to identify universally expressed transcripts across various senescent cell models. We performed RNA sequencing (RNA-seq) analysis after triggering senescence in human WI-38 and IMR-90 fibroblasts, human umbilical vein endothelial cells (HUVECs) and human alveolar endothelial cells (HAECs) through replicative exhaustion (WI-38, IMR-90), exposure to IR (WI-38, IMR-90, HUVEC, HAEC) or doxorubicin (Dox) (WI-38) or expression of an oncogene (oncogene-induced senescence, OIS) (WI-38). Comparisons of all the patterns of expressed transcripts revealed 68 RNAs that were increased (50 RNAs) or decreased (18 RNAs) across all senescence models, although a mimimum of 5 RNAs were sufficient to identify senescent cells bioinformatically. Most RNAs altered during senescence were protein-coding transcripts, but the long non-coding (lnc)RNA PURPL (p53-upregulated regulator of p53 levels) was one of the most strikingly elevated transcripts. RT-qPCR and pathway analyses verified these changes and pointed to specific senescence-related signaling pathways.
MATERIALS AND METHODS
Cell culture, senescence induction and SA-β-galactosidase (SA-βGal) activity
Human diploid fibroblasts (HDFs) from fetal lung WI-38 and IMR-90 (Coriell Cell Repositories) were cultured in Dulbecco's modified Eagle’s medium (DMEM) supplemented with 10% fetal bovine serum (FBS, Gibco), 1% antibiotics, 1% antimycotics and 1% non-essential amino acids (Invitrogen). Human aortic endothelial cells (HAECs) were cultured in EBM-2 Basal Medium supplemented with EGM-2 SingleQuots™ Kit supplements and growth factors (Lonza), and human umbilical vein endothelial cells (HUVECs) in EBM with EGM SingleQuots™ Kit supplements and growth factors (Lonza).
Proliferating (P) WI-38 and IMR-90 fibroblasts were used at population doubling level (PDL)15-PDL25, and for replicative senescence (S), cells were cultured until replicative exhaustion (PDL50-PDL59). For ionizing radiation (IR)-induced senescence, proliferating (PDL25) WI-38 and IMR-90 cells were exposed to 10 Gy, and HAECs and HUVECs to 4 Gy; cells were harvested 10 days after IR. For Doxorubicin (Dox)-induced senescence, WI-38 cells (PDL25) were treated with 2 μg/ml Dox (Sigma) for 24 h and harvested 7 days later. For oncogene-induced senescence (OIS), WI-38 cells (PDL25) were transduced at 10 MOI (multiplicity of infection) using lentivirus expressing HRASG12V or an empty vector (EV) and treated with puromycin (1 μg/ml) for 5 days. Three additional senescence comparison groups (WI-38 fibroblasts that were either proliferating or rendered senescent by replicative exhaustion, Dox treatment or exposure to IR) were generated in-house using the same workflow, library preparation, genome alignment and normalization methods, P-value adjustment and threshold cutoff as the above comparison groups. Senescence-associated β-galactosidase (SA-βGal) activity was assessed using a Senescence β-galactosidase staining kit (Cell Signaling).
Western blot analysis
Whole-cell lysates were prepared using Mammalian Protein Extraction Reagent (M-PER™ Thermo Scientific) supplemented with Halt™ Protease and Phosphatase Inhibitor Cocktail (Thermo Scientific). Lysates were separated by SDS-polyacrylamide gel electrophoresis (SDS-PAGE) and transferred onto nitrocellulose membranes (iBlot Stack, Thermo Scientific). Membranes were probed with primary antibodies recognizing SIRT1 (Abcam), GAPDH (Santa Cruz), p16 (BD Biosciences), p21 (Millipore), β-Actin (Santa Cruz), HRAS (Calbiochem) or p53 (Santa Cruz). After incubation with secondary antibodies conjugated with horseradish peroxidase (HRP; GE Healthcare), signals were detected using enhanced Chemiluminescence (Millipore) using KwikQuant Imager (Kindle Biosciences, LLC).
RNA isolation and sequencing
Total RNA was extracted using TriPure (Roche), and the original six senescence models (HUVEC IR+/IR-, HAEC IR+/IR-, IMR-90 IR+/IR-, IMR-90 S/P, WI-38 Dox+/Dox- and WI-38 HRASG12V/EV) were sequenced by Genewiz. Paired-end cDNA libraries were created after rRNA depletion using Illumina Ribo-Zero and sequenced using an Illumina Hiseq 4000 with a 2× 150-bp configuration single index per lane. Library quality was guaranteed with 80% of bases having a Q-score >30. The remaining three models of senescence, WI-38 S/P, WI-38 IR+/IR- and WI-38 Dox+/Dox-, were prepared by RNA extraction and a paired-end cDNA library created after rRNA depletion using Illumina Ribo-Zero; they were sequenced in-house using the Illumina Hiseq 2500 with a 2 × 150-bp configuration, single index per lane. The original six groups were sequenced at a depth of 150 million paired-end reads, and the latter three groups were sequenced at a depth of 220 million paired-end reads, with minimum of 75 million unidirectional reads for the former and 110 million unidirectional reads for the latter, respectively. RNA-seq analyses of all senescence models are in Supplementary Tables S1–S9 (GSE130727).
Bioinformatic Analysis
Aligned gene counts were analyzed using the edgeR package (Bioconductor release version 3.8) in R (version 3.5.1). Trimmed Mean of M values (TMM) was used as a scaling normalization method for the differential expression analysis of the RNA-seq data. Common dispersion and tagwise dispersion were estimated using the quantile-adjusted conditional maximum likelihood (qCML) method. A pairwise in-group plot of the counts per million (CPM) using mapped transcripts after normalization served as quality control for sample bias and abundance bias (Sup 2A-2K). Benjamini–Hochberg adjusted P-value (false discovery rate or FDR) < 0.15 was used as the significance threshold for a given individual group comparison after considering lower thresholds that were too permissive and higher thresholds that yielded too few shared transcripts. The Venn diagram of the multiple comparison overlaps and subsets was generated using the Vennerable package in R. Ingenuity Pathway Analysis (winter 2018 version) was conducted using the maximum fold change for those genes found to be consistently elevated or reduced across all senescence models.
RT-qPCR analysis
Total RNA was used for reverse transcription (RT) using random hexamers and reverse transcriptase (Invitrogen); real-time quantitative (q)PCR analysis was then performed with SYBR Green master mix (Kapa Biosystems) and gene-specific primers using Applied Biosystems 7300 instrument. Forward and reverse primers used to validate the RNA-seq results are listed in Supplementary Table S10.
RESULTS
Characterization of senescence models
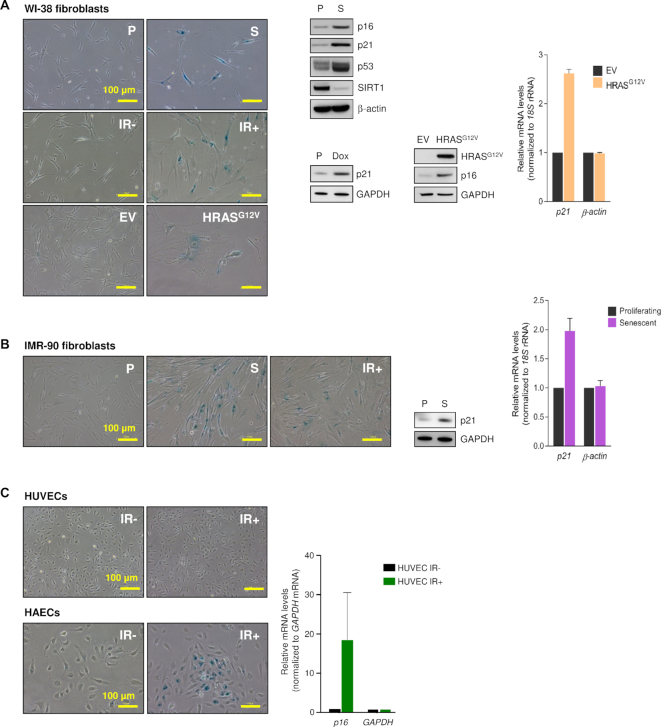
We began by establishing the senescence phenotype of the experimental proliferating versus senescent cell populations. Proliferating (P) human diploid WI-38 fibroblasts at population doubling level (PDL) 25 were rendered senescent (S) by replicative exhaustion (PDL50-59), exposure to ionizing radiation (IR+, 10 Gy, assessed 10 days later), infection with a lentivirus that triggered oncogene-induced senescence (OIS) by expression of HRASG12V and selection of infected cells using puromycin (senescence was assessed 5 days later) or treatment with Doxorubicin (2 μg/ml) for 24 h and assessment 7 days later (Figure 1A). Proliferating (P, PDL25) human diploid IMR-90 fibroblasts were rendered senescent by replicative exhaustion (S, at PDL55) or exposure to ionizing radiation (IR+, 10 Gy, 10 days later) (Figure 1B). Human umbilical vein endothelial cells (HUVECs) and human aortic endothelial cells (HAECs) were either proliferating (IR-) or rendered senescent by exposure to IR (4 Gy, assayed 10 days later) (Figure 1C).
Figure 1.
Senescence models. (A) The phenotype of proliferating WI-38 fibroblasts rendered senescent by extended culture [P (proliferating) cells at PDL25; S (senescent) cells at PDL50-59], exposure to ionizing radiation [IR-, proliferating; IR+, senescent by 10 days after exposure to 10 Gy] or expression of HRASG12V to trigger oncogene-induced senescence (OIS) [EV, proliferating cells expressing empty vector; HRASG12V cells expressing oncogenic RAS, 5 days after infection and selection with puromycin] was studied by assessing senescence-associated (SA)βGal activity (micrographs), by western blot analysis of senescence marker proteins showing higher (p16, p21, p53) or lower (SIRT1) levels with senescence (middle) or by RT-qPCR analysis of p21 mRNA levels (graph). WI-38 fibroblasts at PDL25 were treated with Doxorubicin (2 μg/ml for 24 h and harvested 5 days later; senescence was assessed by western blot analysis of p21 expression levels. (B) The phenotype of IMR-90 cells that were either proliferating (P) or were rendered senescent by replicative exhaustion (S) or exposure to IR (IR+) was assessed as explained in panel (A). (C) The senescent phenotype of proliferating (IR-) and senescent (IR+) HUVECs and HAECs (4 Gy, 10 days after exposure) was assessed by monitoring SA-βGal activity (micrographs) and p16 mRNA levels (graph). Data in graphs (A–C) represent the means ± S.E.M. from three independent experiments.
Senescence was monitored by assessing senescence-associated β-galactosidase (SA-βGal) activity; senescent cells displayed the characteristic flattened morphology and enhanced SA-βGal activity in all models, except for HUVECs, where the staining was negative after IR under the conditions tested (Figure 1C). Senescence was also characterized by western blot analysis of one or several protein markers [p21 (CDKN1A), p16 (CDKN2A), p53 (TP53)] in both WI-38 and IMR-90 cells following replicative exhaustion, and in OIS- and Dox-induced senescence in WI-38 cells (Figure 1A and B). RNA reverse transcription (RT) followed by real-time quantitative (q)PCR analysis revealed increased p21 mRNA levels in IMR-90 (S) and in WI-38 OIS relative to the respective controls (Figure 1A and B). Additional markers in these paradigms of cell senescence have been shown elsewhere (21), including higher p21 mRNA levels in IR- and Dox-induced senescence in WI-38 fibroblasts, and IR-induced senescence of IMR-90 fibroblasts, HAECs and HUVECs. These well-established models of cellular senescence were used for further analysis.
RNA expression is most strongly influenced by the cell origin
In order to identify shared features of the transcriptomes of senescent cells, we designed six comparison groups using four cell lines for RNA sequencing, as shown in the workflow (Figure 2A). In this analysis, we compared replicative (WI-38, IMR-90), IR-induced (WI-38, IMR-90, HAEC, HUVEC), Dox-induced (WI-38) and oncogene-induced (WI-38) senescence. After whole-cell RNA extraction from proliferating and senescent cells, libraries were prepared. RNA-seq performed using an Illumina should be HiSeq 4000 instrument at a depth of 75 million unidirectional reads for a total of 150 million paired-end reads per sample; after completion, bioinformatic analyses were performed (Supplementary Tables S1–S9 and Figures S1 and S2).
Figure 2.
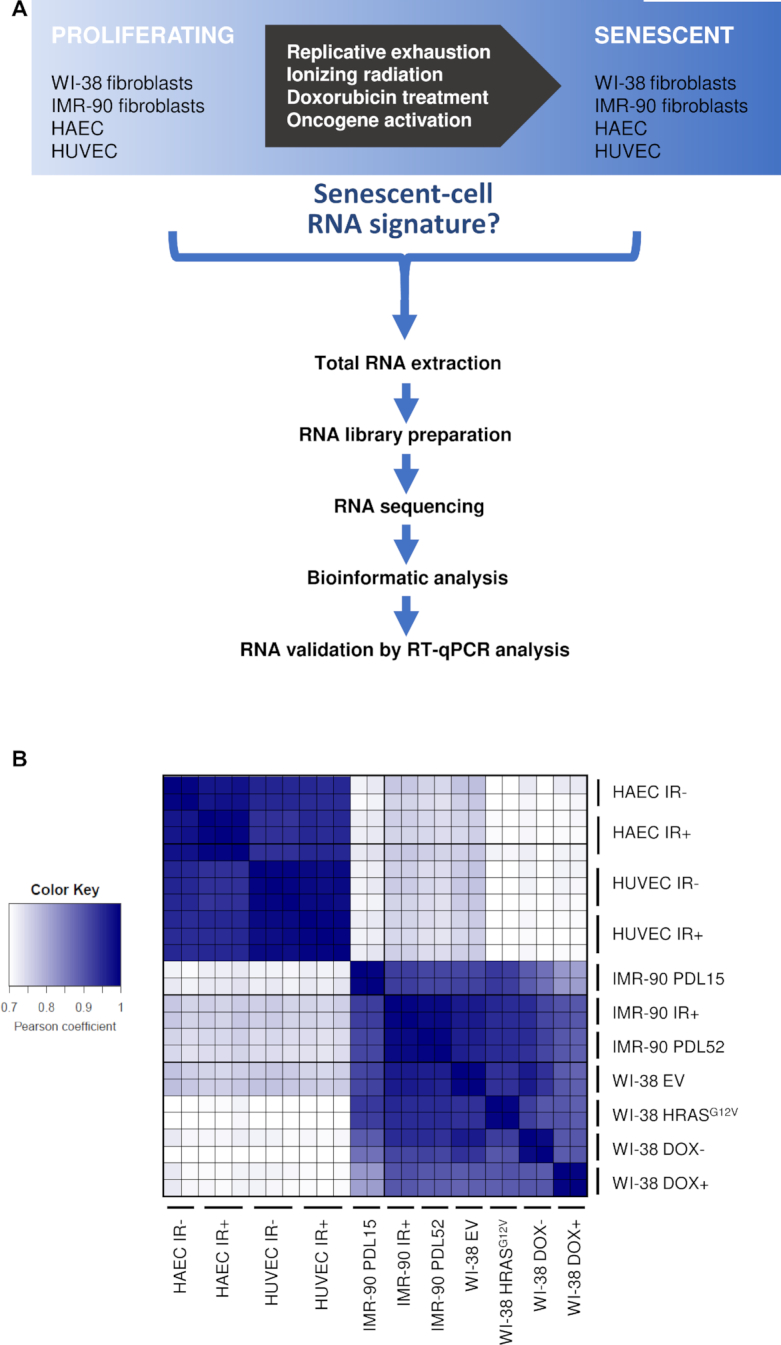
Study workflow. (A) Schematic representation of the workflow to trigger senescence. (B) Heat map of Pearson correlation coefficients to compare correlations between the samples, calculated using the log counts per million (CPM) of all the mapped transcripts from RNA-seq, where 1 is total positive linear correlation between two samples and 0 is no linear correlation.
Pearson correlation coefficient analyses to compare the individual sequenced samples against one another showed that the bulk differences in RNA expression were dependent on the cell type of origin, in this case endothelial cells (HUVECs, HAECs) or fibroblasts (WI-38, IMR-90), rather than on the method used to induce senescence (Figure 2B). This finding is consistent with the diversity of senescent programs depending on the tissue of origin and supports the view that cellular senescence is not a single phenotypic state (16).
Shared differentially expressed RNAs
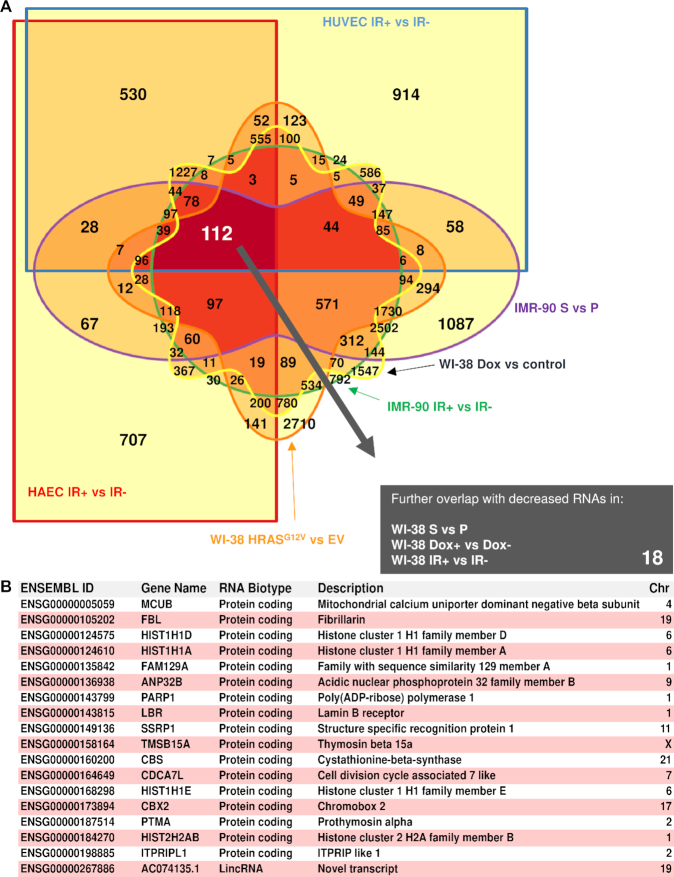
RNA-seq analysis was followed by identification of differentially expressed transcripts meeting the threshold of FDR P < 0.15 in each comparison and further comparing all six groups to assess commonly downregulated RNAs. This FDR threshold was chosen after first considering more stringent thresholds that rendered either no transcripts or too few transcripts for subsequent analysis, as well as less stringent thresholds that yielded longer lists of transcripts that failed subsequent validation. A Venn diagram represents the 112 RNA transcripts significantly downregulated that overlap among the comparisons (Figure 3A). We sought to reduce possible technical bias and increase the number of cell models tested in order to have the most stringent possible list of RNAs. To this end, we included three additional senescence comparison groups generated using WI-38 cells that were either proliferating or rendered senescent by replicative exhaustion, Dox treatment or exposure to IR (‘Materials and Methods’ section). After merging all the datasets, the list of shared downregulated RNAs was reduced to 18 transcripts (Figure 3B); most of them were protein-coding transcripts, including MCUB, PTMA, HIST1H1D and HIST1H1A mRNAs. Only one non-coding RNA was downregulated in all comparisons, lincRNA AC074135.1.
Figure 3.
Shared reduced RNAs in senescence. (A) Venn diagram of all the possible overlapping and non-overlapping transcripts in six comparison groups sequenced together, showing reduced abundance with senescence, filtering for a significance FDR < 0.15 (Benjamini–Hochberg P-value correction). Increasing color saturation indicates overlapping comparisons with largest number of RNAs; 112 RNAs were found to be downregulated in all six comparisons. (B) Table lists a final set of 18 reduced transcripts, after overlapping those 112 RNAs with three additional comparison groups of reduced RNAs using the same significance adjustments in WI-38 S versus P, WI-38 Dox+ versus Dox- and WI-38 IR+ versus IR-.
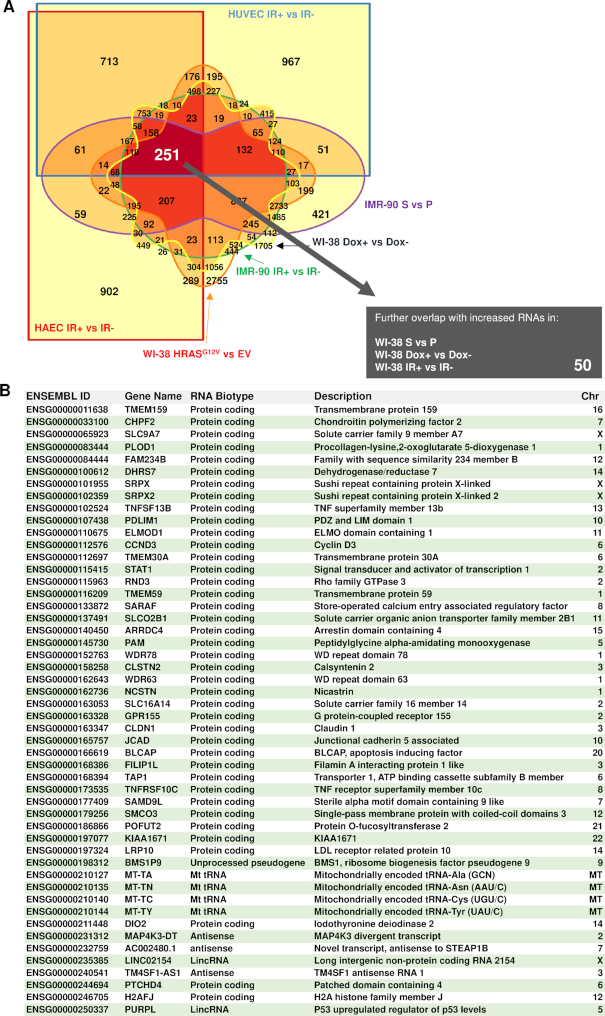
Using the same strategy, we uncovered 251 transcripts that increased during senescence (Figure 4A), and further analysis with the external three datasets (as above) revealed 50 additional transcripts common across all senescence models (Figure 4B). Among these, mitochondrial DNA-encoded tRNAs (tRNA-TA, -TN, -TC, -TY) (22), two were lncRNAs and three were antisense transcripts (Figure 4B). However, the majority were protein-coding transcripts, including SRPX, SRPX 2 and STAT1 mRNAs. Together, the data in Figures 3 and 4 identified shared upregulated (50) or downregulated (18) RNAs in the indicated senescence models (16). A heat map representation of these 68 RNAs (50+18) is shown in Supplementary Figure S3. Ingenuity pathway analysis (IPA) revealed several metabolic and inflammatory pathways such as granzyme A signaling, cysteine biosynthesis and interferon signaling (Supplementary Figure S4A). Network analysis found that several of the encoded proteins were part of shared regulatory networks in the nucleus and cytoplasm (Supplementary Figure S4B).
Figure 4.
Shared increased RNAs in senescence. (A) Venn diagram of all the possible overlapping and non-overlapping transcripts in six comparison groups sequenced together, showing increased abundance with senescence, filtering for a significance FDR < 0.15 (Benjamini–Hochberg P-value correction). Increasing color saturation indicates overlapping comparisons with largest number of RNAs; 251 RNAs were found to be upregulated in all six comparisons. (B) Table lists a final set of 50 increased transcripts, after overlapping those 251 RNAs with three additional comparison groups of elevated RNAs using the same significance adjustments in WI-38 S versus P, WI-38 Dox+ versus Dox- and WI-38 IR+ versus IR-.
Validation of shared transcripts
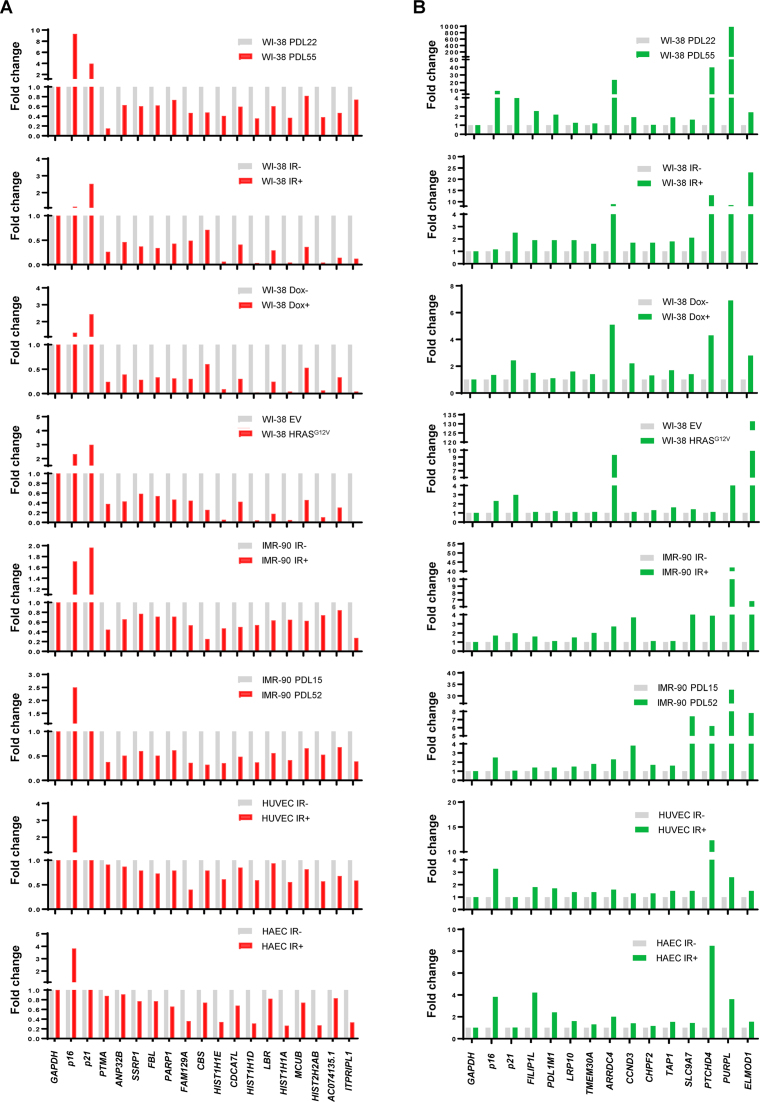
The changes in shared downregulated and upregulated transcripts (Figures 3 and 4) were validated by using RT-qPCR analysis employing gene-specific primer pairs (Supplementary Table S10). Among the many RNAs shared across all senescence models, we validated 16 reduced and 12 increased transcripts (Figure 5A and B) in replicative, IR-induced, Dox-induced and oncogene-induced senescence in WI-38 cells, as well as in replicative and IR-induced senescence in IMR-90 cells and IR-induced senescence in HUVEC and HAEC; additional validation in biological replicates is shown in Supplementary Figure S5. We included p16 and p21 mRNAs as canonical controls during the validation of individual transcripts. Interestingly, however, while p16 mRNA was consistently elevated in most senescent populations, this increase was marginal in Dox-induced and IR-induced WI-38 cell senescence. On the other hand, p21 mRNA was elevated in WI-38 senescence, but was minimally or not at all changed in senescent IMR-90 fibroblasts or in HUVECs or HAECs. By contrast, the individually tested RNAs showing differential expression across all senescence models were successfully confirmed. For instance, FAM129A, HIST1H1E, HIST1H1D, HIST1H1A and ITPRIPL1 mRNAs all showed reduced abundance (Figure 5A); interestingly, the lncRNA PURPL was not only consistently upregulated in every senescence model, but also vastly surpassed the increases seen for positive controls p16 and p21 mRNA (Figure 5B). Together, these findings suggest that these 68 transcripts may serve as superior RNA biomarkers of senescence rather than the classical p16 and p21 mRNAs.
Figure 5.
Validation of shared RNAs. RT-qPCR analysis showing the fold change of the relative abundance of RNA levels in a subset of shared decreased (A) and increased (B) transcripts normalized to GAPDH mRNA. p16 and p21 mRNAs were included as senescence positive controls. Data represent two biological replicates.
Shared transcripts contribute to defining a senescence signature
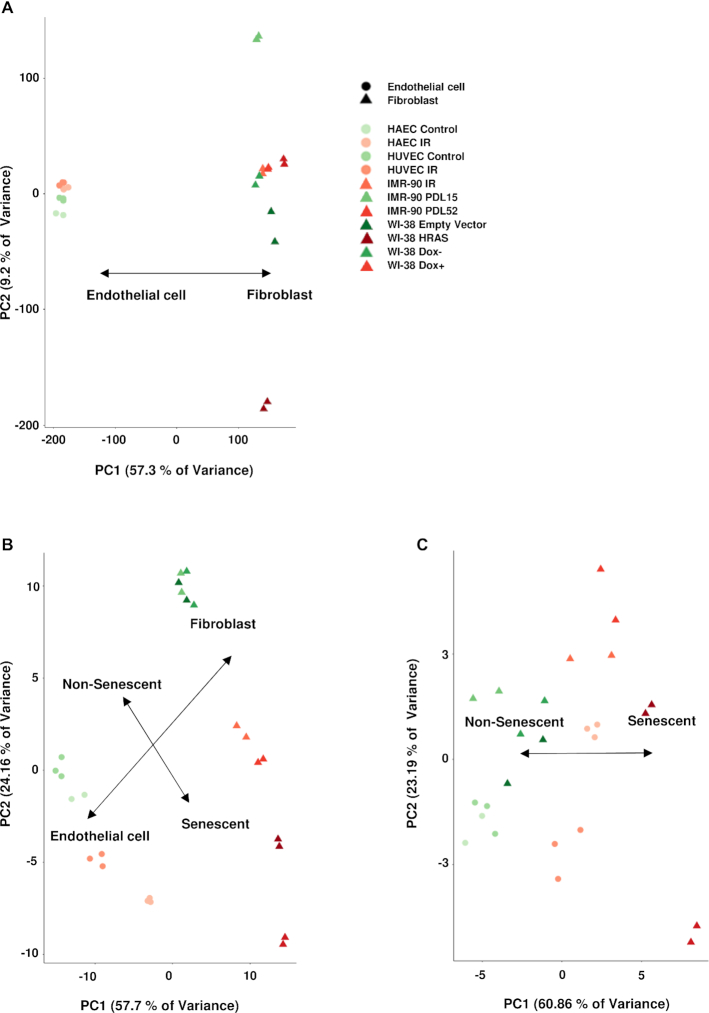
Next, we sought to determine if the 68 differentially expressed RNAs might help to discriminate between senescent and non-senescent cells. Unbiased principal component analysis (PCA) using the normalized log CPM for all the mapped genes in the sequenced samples revealed a clustering pattern similar to that established by the Pearson Coefficient heat map (Figure 2B), whereby the majority of the genetic variance lays upon the cell type of origin (Figure 6A). Importantly, however, when the PCA was recalculated including only those 68 transcripts, we observed a clear separation based on senescent versus non-senescent cell state, in addition to cell type (Figure 6B).
Figure 6.
Senescence versus non-senescence discrimination. (A) Principal component analysis (PCA) calculated using the normalized log counts per million (CPM) of all aligned transcripts. (B) PCA of the same group of samples when considering only the 68 transcripts with shared reduced (18) or increased (50) expression in all models of senescence studied. (C) PCA of the same group of samples when only considering SLCO2B1, CLSTN2 and PTCHD4 mRNAs, as well as LINC02154 and PURPL lncRNAs in the analysis.
We were interested in finding the minimum number of transcripts, among the 68, needed to achieve a discriminatory pattern between senescent and non-senescent cells using the RNA-seq log CPM values. The computational intensity and practical limitations of permutating all the unique combinations of 68 transcripts (∼1020 possible combinations) prompted us to use statistical modeling to reach this goal. Supervised logarithmic (Binomial) regression with LASSO (least absolute shrinkage and selection operator) regularization was employed, assigning non-senescent samples a truth value of 0 and senescent samples a truth value of 1. LASSO is a powerful machine learning and statistical method that is applicable for performing dimensional reduction of data for downstream analysis and may also help in feature selection and in revealing hidden biological information. Using leave-one-out (LOO) cross-validation to evaluate performance, we were able to decrease the number of transcripts to 5 at an optimal value of λ (penalty coefficient), while still observing a low misclassification error rate (Supplementary Figure S6). The five transcripts are SLCO2B1, CLSTN2 and PTCHD4 mRNAs, as well as LINC02154 and PURPL lncRNAs. We then recalculated the PCA including CPM values of only those five RNA transcripts and found that the separation axis between senescent and non-senescent samples was preserved (Figure 6C), while there was a decrease in the separation based on cell of origin. It is also important to note that while these five transcripts were computationally selected as the best variables for this statistical modeling approach, their specific biological relevance in senescence remains to be investigated.
DISCUSSION
We report global profiles of RNAs expressed in eight experimental models of cellular senescence commonly studied using WI-38 and IMR-90 fibroblasts, HUVECs and HAECs (Figure 1). We identified 50 elevated and 18 reduced transcripts shared among all comparison pairs (Figures 3–5). Computational analyses including Pearson correlation coefficient and PCA indicated that the senescence profiles are more dependent on the cell of origin than on the mode of induction (Figures 2 and 6). For example, IR-induced senescence in WI-38 and IMR-90 fibroblasts is similar and closer to senescence triggered by other stimuli in fibroblasts than it is to IR-induced endothelial senescence (Figure 6). The dissimilarity between senescent fibroblasts and endothelial cells could be due to differences in the dynamic progression of these cell types toward senescence, a dimension of senescence that has not been studied systematically to-date and warrants investigation. The transcripts listed in CellAge (23) were largely (>90%) shared with the aggregate of all differentially expressed mRNAs in at least one cell type and a given senescence trigger (Supplementary Tables S1–S9).
Several transcripts identified in this study (Figures 3 and 4) have been implicated in senescence and cancer. For example, SRPX mRNA was shown to be elevated in senescent cells and reduced in human cancer cells (24–27); accordingly, elevated SRPX was linked to the suppression of tumorigenesis and the induction of senescence and apoptosis (25,28). SRPX2 promotes angiogenesis of HUVECs through the uPAR and integrin/FAK pathways (29–35); since angiogenesis is tightly linked to tissue healing after injury, SRPX2 may be involved in senescence-mediated wound healing (36,37).
Interestingly, histone-encoding HIST1H1D, HIST1H1A, HIST1H1E and HIST2H2AB mRNAs were less abundant in senescent cells, in keeping with earlier evidence that the general expression of histones (38–40), and in particular those encoded by these mRNAs (41–43), is reduced in senescent cells. These data are in agreement with an epigenetic role for histones in the induction and maintenance of senescence. Indeed, H2AFJ is required for the production of SASP factors by fibroblasts and old human epidermis and was previously found to accumulate in senescent cells (44).
The lncRNA PURPL (p53-upregulated regulator of p53 levels) was one of the transcripts most highly and consistently elevated among senescent cells (Figure 4 and 5). PURPL production was recently shown to be transcriptionally controlled by the transcription factor p53, which is generally elevated in senescent cells. However, PURPL in turn helps to maintain low basal p53 levels in colon cancer cells (HCT116) by interacting with MYBBP1A and thereby preventing the assembly of the stable p53–MYBBP1A complex (45). In addition, given that PURPL promotes tumorigenicity by acting as a pro-survival factor in these cells (45), it is possible that PURPL may also contribute to the pro-survival phenotype of senescent cells. Our systematic analysis further reveals that PURPL may be a more robust marker transcript than p16 mRNA or p21 mRNA, as the latter two mRNAs did not reach significance cutoffs in all senescence models, as determined by RNA-seq and RT-qPCR analyses.
In closing, our study highlights the value of computational and statistical modeling methods, not simply as practical analytical tools, but also as a means to identify latent structures hidden beyond high-dimensional biological data such as transcriptomes. The subsets of transcripts we have identified, coding and non-coding, display shared expression patterns across a range of senescent cell models. Given their robust and consistent expression patterns, we propose that they may be involved in the establishment and/or maintenance of senescence, although it remains to be studied whether they regulate senescence and by what mechanisms. Finally, while cultured models of cellular senescence recapitulate the phenotypic traits of senescent cells in tissues and organs, future analyses will focus on determining whether these RNAs are also differentially expressed in physiologic and pathologic settings in vivo. Their potential utility to target senescent cells in ‘senolytic’ interventions will also be the goals of upcoming studies. With rising appreciation that senescent cells modulate age-associated processes (16,46), and that key pathways active in senescent cells (e.g. immune and lysosomal function) are also active in aging cells (47), the senescence-associated transcripts identified here constitute informative molecular parameters in studies of aging health and disease.
DATA AVAILABILITY
RNA-seq analyses have been deposited in GEO (https://www.ncbi.nlm.nih.gov/geo/) under accession number GSE130727.
Supplementary Material
ACKNOWLEDGEMENTS
This work was supported entirely by the National Institute on Aging Intramural Research Program, National Institutes of Health.
SUPPLEMENTARY DATA
Supplementary Data are available at NAR Online.
FUNDING
Funding for open access charge: National Institute on Aging Intramural Research Program, National Institutes of Health.
Conflict of interest statement. None declared.
REFERENCES
- 1. Hayflick L. The limited in vitro lifetime of human diploid cell strains. Exp. Cell Res. 1965; 37:614–636. [DOI] [PubMed] [Google Scholar]
- 2. Dimri G.P., Lee X., Basile G., Acosta M., Scott G., Roskelley C., Medrano E.E., Linskens M., Rubelj I., Pereira-Smith O. et al.. A biomarker that identifies senescent human cells in culture and in aging skin in vivo. Proc. Natl. Acad. Sci. U.S.A. 1995; 92:9363–9367. [DOI] [PMC free article] [PubMed] [Google Scholar]
- 3. Campisi J. Cellular senescence as a tumor-suppressor mechanism. Trends Cell Biol. 2001; 11:S27–S31. [DOI] [PubMed] [Google Scholar]
- 4. Zhang R., Adams P.D.. Heterochromatin and its relationship to cell senescence and cancer therapy. Cell Cycle. 2007; 6:784–789. [DOI] [PubMed] [Google Scholar]
- 5. Panda A.C., Abdelmohsen K., Gorospe M.. SASP regulation by noncoding RNA. Mech. Ageing Dev. 2017; 168:37–43. [DOI] [PMC free article] [PubMed] [Google Scholar]
- 6. Demaria M., Ohtani N., Youssef S.A., Rodier F., Toussaint W., Mitchell J.R., Laberge R.M., Vijg J., Van Steeg H., Dolle M.E. et al.. An essential role for senescent cells in optimal wound healing through secretion of PDGF-AA. Dev. Cell. 2014; 31:722–733. [DOI] [PMC free article] [PubMed] [Google Scholar]
- 7. Prieur A., Peeper D.S.. Cellular senescence in vivo: a barrier to tumorigenesis. Curr. Opin. Cell Biol. 2008; 20:150–155. [DOI] [PubMed] [Google Scholar]
- 8. Storer M., Mas A., Robert-Moreno A., Pecoraro M., Ortells M.C., Di Giacomo V., Yosef R., Pilpel N., Krizhanovsky V., Sharpe J. et al.. Senescence is a developmental mechanism that contributes to embryonic growth and patterning. Cell. 2013; 155:1119–1130. [DOI] [PubMed] [Google Scholar]
- 9. Aravinthan A., Pietrosi G., Hoare M., Jupp J., Marshall A., Verrill C., Davies S., Bateman A., Sheron N., Allison M. et al.. Hepatocyte expression of the senescence marker p21 is linked to fibrosis and an adverse liver-related outcome in alcohol-related liver disease. PLoS One. 2013; 8:e72904. [DOI] [PMC free article] [PubMed] [Google Scholar]
- 10. Aravinthan A., Challis B., Shannon N., Hoare M., Heaney J., Alexander G.J.. Selective insulin resistance in hepatocyte senescence. Exp. Cell Res. 2015; 331:38–45. [DOI] [PubMed] [Google Scholar]
- 11. Boccardi V., Pelini L., Ercolani S., Ruggiero C., Mecocci P.. From cellular senescence to Alzheimer's disease: The role of telomere shortening. Age. Res. Rev. 2015; 22:1–8. [DOI] [PubMed] [Google Scholar]
- 12. Campisi J., Robert L.. Cell senescence: role in aging and age-related diseases. Interdiscip. Top. Gerontol. 2014; 39:45–61. [DOI] [PMC free article] [PubMed] [Google Scholar]
- 13. Ito T.K., Yokoyama M., Yoshida Y., Nojima A., Kassai H., Oishi K., Okada S., Kinoshita D., Kobayashi Y., Fruttiger M. et al.. A crucial role for CDC42 in senescence-associated inflammation and atherosclerosis. PLoS One. 2014; 9:e102186. [DOI] [PMC free article] [PubMed] [Google Scholar]
- 14. Kumar M., Seeger W., Voswinckel R.. Senescence-associated secretory phenotype and its possible role in chronic obstructive pulmonary disease. Am. J. Respir. Cell Mol. Biol. 2014; 51:323–333. [DOI] [PubMed] [Google Scholar]
- 15. Chinta S.J., Lieu C.A., Demaria M., Laberge R.M., Campisi J., Andersen J.K.. Environmental stress, ageing and glial cell senescence: a novel mechanistic link to Parkinson's disease. J. Intern. Med. 2013; 273:429–436. [DOI] [PMC free article] [PubMed] [Google Scholar]
- 16. van Deursen J.M. The role of senescent cells in ageing. Nature. 2014; 509:439–446. [DOI] [PMC free article] [PubMed] [Google Scholar]
- 17. Kastenhuber E.R., Lowe S.W.. Putting p53 in Context. Cell. 2017; 170:1062–1078. [DOI] [PMC free article] [PubMed] [Google Scholar]
- 18. Serra S., Chetty R.. p16. J. Clin. Pathol. 2018; 71:853–858. [DOI] [PubMed] [Google Scholar]
- 19. Georgakilas A.G., Martin O.A., Bonner W.M.. p21: A Two-Faced genome guardian. Trends Mol. Med. 2017; 23:310–319. [DOI] [PubMed] [Google Scholar]
- 20. Lee B.Y., Han J.A., Im J.S., Morrone A., Johung K., Goodwin E.C., Kleijer W.J., DiMaio D., Hwang E.S.. Senescence-associated beta-galactosidase is lysosomal beta-galactosidase. Aging Cell. 2006; 5:187–195. [DOI] [PubMed] [Google Scholar]
- 21. Kim K.M., Noh J.H., Bodogai M., Martindale J.L., Pandey P.R., Yang X., Biragyn A., Abdelmohsen K., Gorospe M.. SCAMP4 enhances the senescent cell secretome. Genes Dev. 2018; 32:909–914. [DOI] [PMC free article] [PubMed] [Google Scholar]
- 22. Anderson S., Bankier A.T., Barrell B.G., de Bruijn M.H., Coulson A.R., Drouin J., Eperon I.C., Nierlich D.P., Roe B.A., Sanger F. et al.. Sequence and organization of the human mitochondrial genome. Nature. 1981; 290:457–465. [DOI] [PubMed] [Google Scholar]
- 23. Tacutu R., Thornton D., Johnson E., Budovsky A., Barardo D., Craig T., Diana E., Lehmann G., Toren D., Wang J. et al.. Human Ageing Genomic Resources: new and updated databases. Nucleic Acids Res. 2018; 46:D1083–D1090. [DOI] [PMC free article] [PubMed] [Google Scholar]
- 24. Shimakage M., Kodama K., Kawahara K., Kim C.J., Ikeda Y., Yutsudo M., Inoue H.. Downregulation of drs tumor suppressor gene in highly malignant human pulmonary neuroendocrine tumors. Oncol. Rep. 2009; 21:1367–1372. [DOI] [PubMed] [Google Scholar]
- 25. Tambe Y., Isono T., Haraguchi S., Yoshioka-Yamashita A., Yutsudo M., Inoue H.. A novel apoptotic pathway induced by the drs tumor suppressor gene. Oncogene. 2004; 23:2977–2987. [DOI] [PubMed] [Google Scholar]
- 26. Kim C.J., Shimakage M., Kushima R., Mukaisho K., Shinka T., Okada Y., Inoue H.. Down-regulation of drs mRNA in human prostate carcinomas. Hum. Pathol. 2003; 34:654–657. [DOI] [PubMed] [Google Scholar]
- 27. Shimakage M., Takami K., Kodama K., Mano M., Yutsudo M., Inoue H.. Expression of drs mRNA in human lung adenocarcinomas. Hum. Pathol. 2002; 33:615–619. [DOI] [PubMed] [Google Scholar]
- 28. Tambe Y., Yoshioka-Yamashita A., Mukaisho K., Haraguchi S., Chano T., Isono T., Kawai T., Suzuki Y., Kushima R., Hattori T. et al.. Tumor prone phenotype of mice deficient in a novel apoptosis-inducing gene, drs. Carcinogenesis. 2007; 28:777–784. [DOI] [PubMed] [Google Scholar]
- 29. Liu K., Fan J., Wu J.. Sushi repeat-containing protein X-linked 2 promotes angiogenesis through the urokinase-type plasminogen activator receptor dependent integrin alphavbeta3/focal adhesion kinase pathways. Drug Discov. Ther. 2017; 11:212–217. [DOI] [PubMed] [Google Scholar]
- 30. Tanaka K., Arao T., Tamura D., Aomatsu K., Furuta K., Matsumoto K., Kaneda H., Kudo K., Fujita Y., Kimura H. et al.. SRPX2 is a novel chondroitin sulfate proteoglycan that is overexpressed in gastrointestinal cancer. PLoS One. 2012; 7:e27922. [DOI] [PMC free article] [PubMed] [Google Scholar]
- 31. Yamada T., Oshima T., Yoshihara K., Sato T., Nozaki A., Shiozawa M., Ota M., Yoshikawa T., Akaike M., Numata K. et al.. Impact of overexpression of Sushi repeat-containing protein X-linked 2 gene on outcomes of gastric cancer. J. Surg. Oncol. 2014; 109:836–840. [DOI] [PubMed] [Google Scholar]
- 32. Tanaka K., Arao T., Maegawa M., Matsumoto K., Kaneda H., Kudo K., Fujita Y., Yokote H., Yanagihara K., Yamada Y. et al.. SRPX2 is overexpressed in gastric cancer and promotes cellular migration and adhesion. Int. J. Cancer. 2009; 124:1072–1080. [DOI] [PubMed] [Google Scholar]
- 33. Liu K.L., Wu J., Zhou Y., Fan J.H.. Increased Sushi repeat-containing protein X-linked 2 is associated with progression of colorectal cancer. Med. Oncol. 2015; 32:99. [DOI] [PubMed] [Google Scholar]
- 34. Tang H., Zhao J., Zhang L., Zhao J., Zhuang Y., Liang P.. SRPX2 enhances the Epithelial-Mesenchymal transition and temozolomide resistance in glioblastoma cells. Cell Mol. Neurobiol. 2016; 36:1067–1076. [DOI] [PMC free article] [PubMed] [Google Scholar]
- 35. Gao Z., Zhang J., Bi M., Han X., Han Z., Wang H., Ou Y.. SRPX2 promotes cell migration and invasion via FAK dependent pathway in pancreatic cancer. Int. J. Clin. Exp. Pathol. 2015; 8:4791–4798. [PMC free article] [PubMed] [Google Scholar]
- 36. Miljkovic-Licina M., Hammel P., Garrido-Urbani S., Bradfield P.F., Szepetowski P., Imhof B.A.. Sushi repeat protein X-linked 2, a novel mediator of angiogenesis. FASEB J. 2009; 23:4105–4116. [DOI] [PubMed] [Google Scholar]
- 37. Tonnesen M.G., Feng X., Clark R.A.. Angiogenesis in wound healing. J. Investig. Dermatol. Symp. Proc. 2000; 5:40–46. [DOI] [PubMed] [Google Scholar]
- 38. Sidler C., Kovalchuk O., Kovalchuk I.. Epigenetic regulation of cellular senescence and aging. Front. Genet. 2017; 8:138. [DOI] [PMC free article] [PubMed] [Google Scholar]
- 39. O’Sullivan R.J., Kubicek S., Schreiber R.J., Karlseder J.. Reduced histone biosynthesis and chromatin changes arising from a damage signal at telomeres. Nat. Struct. Mol. Biol. 2010; 17:1218–1225. [DOI] [PMC free article] [PubMed] [Google Scholar]
- 40. Baker D.J., Sedivy J.M.. Probing the depths of cellular senescence. J. Cell Biol. 2013; 202:11–13. [DOI] [PMC free article] [PubMed] [Google Scholar]
- 41. Funayama R., Saito M., Tanobe H., Ishikawa F.. Loss of linker histone H1 in cellular senescence. J. Cell Biol. 2006; 175:869–880. [DOI] [PMC free article] [PubMed] [Google Scholar]
- 42. Kim J., Kim Y., Choi H., Kwon A., Jekarl D.W., Lee S., Jang W., Chae H., Kim J.R., Kim J.M. et al.. Ubiquitin C decrement plays a pivotal role in replicative senescence of bone marrow mesenchymal stromal cells. Cell Death Dis. 2018; 9:139. [DOI] [PMC free article] [PubMed] [Google Scholar]
- 43. Li J.J., Ma F.X., Wang Y.W., Chen F., Lu S.H., Chi Y., Du W.J., Song B.Q., Hu L.D., Chen H. et al.. Knockdown of IL-8 provoked premature senescence of Placenta-Derived mesenchymal stem cells. Stem Cells Dev. 2017; 26:912–931. [DOI] [PubMed] [Google Scholar]
- 44. Contrepois K., Coudereau C., Benayoun B.A., Schuler N., Roux P.F., Bischof O., Courbeyrette R., Carvalho C., Thuret J.Y., Ma Z. et al.. Histone variant H2A.J accumulates in senescent cells and promotes inflammatory gene expression. Nat. Commun. 2017; 8:14995. [DOI] [PMC free article] [PubMed] [Google Scholar]
- 45. Li X.L., Subramanian M., Jones M.F., Chaudhary R., Singh D.K., Zong X., Gryder B., Sindri S., Mo M., Schetter A. et al.. Long noncoding RNA PURPL suppresses basal p53 levels and promotes tumorigenicity in colorectal cancer. Cell Rep. 2017; 20:2408–2423. [DOI] [PMC free article] [PubMed] [Google Scholar]
- 46. Childs B.G., Durik M., Baker D.J., van Deursen J.M.. Cellular senescence in aging and age-related disease: from mechanisms to therapy. Nat. Med. 2015; 21:1424–1435. [DOI] [PMC free article] [PubMed] [Google Scholar]
- 47. de Magalhães J.P., Curado J., Church G.M.. Meta-analysis of age-related gene expression profiles identifies common signatures of aging. Bioinformatics. 2009; 25:875–881. [DOI] [PMC free article] [PubMed] [Google Scholar]
- 48. Hernandez-Segura A., de Jong T.V., Melov S., Guryev V., Campisi J., Demaria M.. Unmasking Transcriptional Heterogeneity in Senescent Cells. Curr. Biol. 2017; 27:2652–2660. [DOI] [PMC free article] [PubMed] [Google Scholar]
Associated Data
This section collects any data citations, data availability statements, or supplementary materials included in this article.
Supplementary Materials
Data Availability Statement
RNA-seq analyses have been deposited in GEO (https://www.ncbi.nlm.nih.gov/geo/) under accession number GSE130727.


