

Abstract
Lon protease is evolutionarily conserved in prokaryotes and eukaryotic organelles. The primary function of Lon is to selectively degrade abnormal and certain regulatory proteins to maintain the homeostasis in vivo. Lon mainly consists of three functional domains and the N‐terminal domain is required for the substrate selection and recognition. However, the precise contribution of the N‐terminal domain remains elusive. Here, we determined the crystal structure of the N‐terminal 192‐residue construct of Lon protease from Mycobacterium avium complex at 2.4 å resolution,and measured NMR‐relaxation parameters of backbones. This structure consists of two subdomains, the β‐strand rich N‐terminal subdomain and the five‐helix bundle of C‐terminal subdomain, connected by a flexible linker,and is similar to the overall structure of the N domain of Escherichia coli Lon even though their sequence identity is only 26%. The obtained NMR‐relaxation parameters reveal two stabilized loops involved in the structural packing of the compact N domain and a turn structure formation. The performed homology comparison suggests that structural and sequence variations in the N domain may be closely related to the substrate selectivity of Lon variants. Our results provide the structure and dynamics characterization of a new Lon N domain, and will help to define the precise contribution of the Lon N‐terminal domain to the substrate recognition.
Keywords: Mycobacterium avium complex, Lon protease, the N domain, crystal structure, backbone dynamics
1. INTRODUCTION
Mycobacterium avium complex (Mac), often cause nontuberculous mycobacteria (NTM) pulmonary disease, which has been increasing worldwide and causes significant burden.1, 2 Therapy to Mac‐infected patients usually takes long time with combined medicines and high recurrence rates because of the high tolerance, and no effective vaccines are currently available in the market.3, 4, 5, 6 Structure determinations of Mac important functional proteins could help to develop new therapeutic strategies against this pathogen.
Lon protease, belonging to the AAA+ (ATPases associated with diverse cellular activities) superfamily, is evolutionarily conserved in prokaryotes and eukaryotic organelles.7 Its primary function is to selectively degrade abnormal proteins and regulatory proteins, and maintain the homeostasis in vivo.8, 9, 10 Lon functions as a homo‐hexamer and each subunit mainly consists of three functional domains, the N‐terminal non‐catalytic domain, the central ATPase (A) domain, and the C‐terminal proteolytic (P) domain, among which the feature of the N‐terminal domain is less defined.11, 12, 13 The N‐terminal domain of bacterial Lon consists of ~300 amino acids and is further divided into two or more subdomains including the N domain (~200 amino acids) and the coiled‐coil (CC) domain (~100 amino acids).13, 14, 15 Mutagenesis experiments have indicated that the N‐terminal domain is required for substrate selection and recognition, and the direct interaction between the N domain of the Escherichia coli Lon (EcLon) and the sul20 degron has been detected, but the precise contribution of the N domain remains unclear.12, 16, 17
The high resolution structure of the full‐length Lon has not been determined, and the determined structures were focused on the Lon ATPase and proteolytic domains, including the α subdomain of the Lon ATPase domain from Brevibacillus thermoruber,18 the Lon ATPase domains from Meiothermus taiwanensis and Bacillus subtilis,14, 19 and the Lon proteolytic domain from four organisms.14, 19, 20, 21, 22, 23 Whereas structural information about the N‐terminal domain is still scarce, only the N domains of B. subtilis and E. coli Lon proteases (BsLon‐N, EcLon‐N) have been structurally determined.14, 15, 24 However, sequence identities of BsLon‐N and EcLon‐N with the N domain of Mac Lon (MacLon‐N) are only 23% and 26%, respectively. In this work, we determined the crystal structure of MacLon‐N (residues 1–192, MacLon‐N192) at 2.4 å resolution using the single‐wavelength anomalous dispersion (SAD) method, as no structure has been deposited in the PDB database that has a sequence identity of more than 30% with MacLon‐N192. We also performed a structural comparison between MacLon‐N192 and its homologs. Meanwhile, we applied solution NMR spectroscopy to characterize its secondary structure and measure backbone 1H—15N relaxation parameters. Our report provides initial data on the MacLon structure and will potentially contribute to defining substrate‐binding sites and understanding the N‐terminal domain functions of Lon in depth.
2. RESULTS AND DISCUSSION
2.1. Overall structure and backbone dynamics of MacLon‐N192
The N domain structures of E. coli and B. subtilis Lon proteases have been resolved with PDB IDs of 3LJC and 3M65, respectively.14, 15 According to their sequences together with homology modeling, we made two Mac Lon constructs, MacLon‐N231 (residues 1–231) and MacLon‐N192 (residues 1–192). Crystals of the MacLon‐N231 construct diffracted poorly even after optimization with around 1000 crystallization conditions, and its 1H—15N HSQC spectrum shows crowded peaks in the spectral center (Figure 1a), which restricted the structure determination by either X‐ray crystallography or NMR. In comparison, the MacLon‐N192 construct could produce well‐diffracted crystals and well‐resolved 1H—15N HSQC spectrum (Figure 1a) and is better for the further structure investigation.
Figure 1.
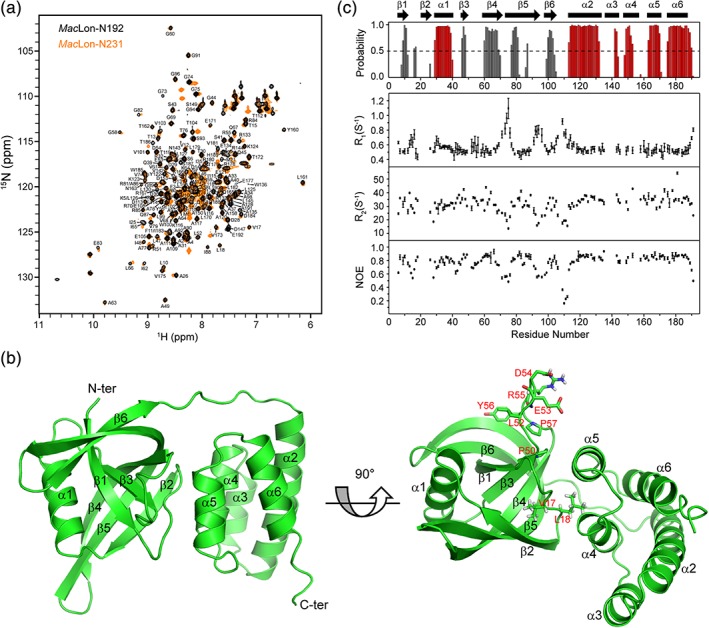
Structure and backbone dynamics of MacLon‐N192. (a) 2D 1H—15N HSQC spectra of MacLon‐N192 (black) and MacLon‐N231 (orange). Assignments for MacLon‐N192 are indicated. (b) Crystal structure of MacLon‐N192 shown in cartoon representation with two different directions of views. Secondary structure elements are labeled on the structure. (c) 1H—15N relaxation parameters (bottom) for MacLon‐N192. Secondary structures predicted by TALOS+ (α‐helix: red; β‐strand: black) based on assigned chemical shifts agree well with the crystal structure regardless of unassigned regions (top). The crystal secondary structure elements are labeled at the top for comparison
The crystal structure of MacLon‐N192 was determined in the space group of P3121 by the SAD method at 2.4 å resolution. In the crystal, each asymmetric unit contains one monomer, and the size exclusion chromatography also illustrates that MacLon‐N192 exists as a monomer (Figure S1). The X‐ray diffraction data and refinement statistics are shown in Table 1. The structure of MacLon‐N192 consists of two distinct subdomains connected by a seven‐residue linker (V106‐T112) (Figure 1b). The N‐terminal subdomain (NS1) is rich in β‐strands, consisting of six β‐strands (β1: 5–12, β2: 20–26, β3: 46–50, β4: 59–71, β5: 74–95, β6: 98–105) and one α‐helix (α1: 29–40) among which strands β4 and β5 are much longer than the other four strands. Moreover, three β‐sheets are formed, one of which is a mixed parallel/antiparallel sheet formed by strands β1/β3/β4/β5, and the other two are antiparallel sheets formed by strands β2/β5/β4 and β1/β6/β5, respectively. The α1‐helix connecting strands β2 and β3 is surrounded by three sheets in a semicircle. The C‐terminal subdomain (NS2) consists of five α‐helices (α2: 113–133, α3: 136–144, α4: 148–157, α5: 163–171, α6: 175–187) that form a compact five‐helix bundle. Helices α3 and α4 are close to the NS1 subdomain, especially to the loop between strands β1 and β2 (Lβ1β2), partially contributing to the hydrophobic interactions between the two subdomains.
Table 1.
Data collection and refinement statistics for MacLon‐N192
| Data collection | Native | SeMet |
|---|---|---|
| Wavelength (å) | 0.9785 | 0.9785 |
| Space group | P3121 | P3121 |
| Unit‐cell parameters | a = b = 58.6, | a = b = 58.7, |
| c = 118.3, | c = 118.8, | |
| α = β = 90°, γ = 120° | α = β = 90°, γ = 120° | |
| Resolution range (å)a | 50.00–2.40 (2.44–2.40) | 50.00–2.50 (2.54–2.50) |
| Total observations | 178997 | 146954 |
| Unique reflections | 9758 | 8447 |
| Redundancya | 18.3 (12.4) | 17.4 (11.4) |
| Completeness (%)a | 91.9 (80.7) | 78.6 (54.8) |
| I/σ (I)a | 41.6 (3.0) | 30.2 (2.0) |
| Molecules in asymmetric unit | 1 | 1 |
| R merge (%)a | 7.6 (63.0) | 9.7 (68.9) |
| CC1/2 a | 1 (0.968) | 1 (0.935) |
| CC*a | 1 (0.99) | 1 (0.98) |
| Refinement | ||
| Resolution range (å)a | 24.82–2.40 (2.48‐2.40) | |
| R work/R free (%)b | 22.7/26.8 | |
| Wilson B factor (å2) | 34.8 | |
| Average B factor (å2) | ||
| Protein | 46.51 | |
| Water | 42.26 | |
| Number of atoms | ||
| Protein | 1409 | |
| Water | 28 | |
| R.m.s. deviations | ||
| Bond lengths (å) | 0.009 | |
| Bond angles (°) | 1.11 | |
| Ramachandran plot (%) | ||
| Most favored | 95.65 | |
| Allowed | 3.80 | |
| Outlier | 0.54 | |
Values in parentheses are for the highest resolution shell.
R work was calculated with 95% of the unique reflections used for refinement, whereas R free was calculated with the remaining 5% of the unique reflections.
Characterizing dynamics of proteins is helpful for understanding their structures and functions at a detailed level. In this study, we labeled MacLon‐N192 with 13C and 15N isotopes, assigned more than 83% backbone resonances (BMRB accession code: 12025), and measured backbone 1H—15N relaxation parameters of R1, R2, and NOE (Figure 1a,c). The secondary structures were predicted by TALOS+25 based on the assigned chemical shifts. MacLon‐N192 in solution exhibits the similar secondary structures as those in crystal except for the unassigned regions such as parts of strand β2 and helix α3 and the C‐terminal portion of strand β5 that was predicted as loop. Sequence variations of the relaxation parameters were observed for residues I71‐T76 in the loop Lβ4β5 and the N‐terminal portion of strand β5, residues S93‐A98 in the loop Lβ5β6 and the C‐terminal portion of strand β5, and residues A109‐T112 in the loop Lβ6α2. These regions are highly flexible with 1H—15N NOE values <0.6, among which the most flexible one is loop Lβ6α2 with 1H—15N NOEs even <0.4. Moreover, these regions show significantly higher R1 and lower R2 values than most of structural regions, indicating the nanosecond motion. Interestingly, residues in loop Lβ3β4 have 1H—15N NOE values ≥0.7, reflecting the relatively restricted high‐frequency motion that results from the conformation stabilized by H‐bond between E53 and R55 (i → i + 2 turn), salt‐bridge between D54 and R55, and hydrophobic interactions between L52 and Y56. Residues P50 and P57 may also contribute to the stabilization of loop Lβ3β4 by mediating the formation of turn‐like structures. Proline‐stabilized conformations have recently been found for in vitro designed bicyclic peptides with irregular turns.26 Residues V17 and L18 in loop Lβ1β2, stabilized by hydrophobic interactions with the NS1 and NS2 subdomains respectively, show 1H—15N NOE values ≥0.8. Unexpectedly, the structural flexibility was observed for parts of strand β5, which was potentially caused by its highly distorted conformation. The structural distortion may shift the strand chemical shifts to random coil as well.
2.2. Structural comparison with homologs
Crystal structures of the N domains of B. subtilis and E. coli proteases (BsLon‐N and EcLon‐N) have been solved, and both consist of two subdomains (NS1, NS2) connected by an extended linker.14, 15 The NS1 subdomains of MacLon‐N192 and BsLon‐N209 adopt similar structures with an RMSD of 2.3 å for 100 residue pairs superposed by DALI (Z‐score: 15.3), whereas the NS2 subdomains are significantly different with a compact five‐helix bundle for MacLon‐N192 but a differently oriented four‐helix bundle for BsLon‐N209 [Figure S2(a)]. Furthermore, MacLon‐N192 is in a monomeric form as identified by size exclusion chromatography (Figure S1), while BsLon‐N209 exists as a homo‐dimer.14 The structure and amino acid sequence differences of the NS2 subdomains might contribute to the different oligomeric states. BsLon‐N209 exists as a domain‐swapped dimer through intermolecular interactions including coiled–coil interaction and hydrophobic interaction mainly resulting from the helical bundle of the NS2 subdomain,14 which are not present in the NS2 domain of MacLon‐N192 without a long α helix and specific hydrophobic pockets [Figure S2(b,c)].
In addition, the DALI search provided a hypothetical protein BPP1347 with unknown functions showing the similar structure to the N domains of both EcLon and MacLon. The structural comparisons among EcLon‐N, BsLon‐N, and BPP1347 have been extensively investigated.14, 15, 24 In this study, we focus on the structural comparison between MacLon‐N192 and EcLon‐N.
The overall structure of MacLon‐N192 is very similar to that of EcLon‐N245 with an RMSD of 2.3 å for 185 residue pairs superposed by DALI (Z‐score: 19.6) (Figure 2a). Because the crystal structure of EcLon‐N245 was solved under the condition of poor electron density for the NS1 subdomain,15 for accuracy, only the structure of the NS2 subdomain of EcLon‐N245 together with the structure of EcLon‐N119 (the isolated NS1 subdomain) was used for the comparison (Figure 2a). The significant diversities are observed in the NS1 subdomain. The region between strands β3 and β4 comprises eight residues in MacLon‐N192 but 16 residues in EcLon‐N, and includes a turn structure in MacLon‐N192 but a four‐residue helix in EcLon‐N. The strand β5 in MacLon‐N192 is four‐residue longer than that in EcLon‐N, and the structures of the C‐terminal regions of strands β4 and β5 are more distorted in MacLon‐N192. In addition, the region representing helix α3 in the NS2 subdomain of MacLon‐N192 is rotated ~ 90° in EcLon‐N mainly caused by the proline at the beginning of the helix. The very long C‐terminal helix observed in EcLon‐N245 is only seen for a quarter in length in MacLon‐N192 due to the truncation, and the compact structure is almost not affected by the truncated part, which can be observed from the crystal structure and is also suggested by the well overlaid 1H—15N HSQC spectra between MacLon‐N192 and MacLon‐N231 constructs.
Figure 2.
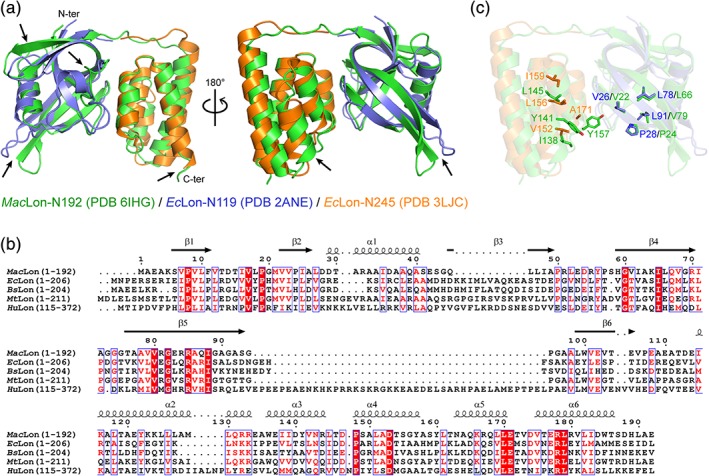
Comparison of MacLon and its homologs. (a) Superposition of MacLon‐N192 (green, PDB ID: 6IHG) and EcLon‐N245 (orange, PDB ID: 3LJC)/EcLon‐N119 (blue, PDB ID: 2ANE) in different directions of views. Part of the long C‐terminal helix of EcLon‐N245 are deleted in comparison. Arrows indicate the structural deviation of MacLon‐N192 from EcLon‐N. (b) Sequence alignment of MacLon‐N192 with the corresponding fragments of Escherichia coli Lon (EcLon; UniProt ID P0A9M0), Bacillus subtilis Lon (BsLon; UniProt ID P37945), Mycobacterium tuberculosis Lon (MtLon; UniProt ID A0A0T9M6Q7), and human Lon (HuLon; UniProt ID P36776). (c) Superposition of possible binding residues of MacLon‐N192 (green) and EcLon‐N245 (orange)/EcLon‐N119 (blue) to the potential hydrophobic substrates
Structural variations of the N domains even being small may contribute to the specific substrate recognition in different species of Lon proteases. The substrate selection of Lon proteases is organism dependent, and three domains were all observed functioning in the substrate selectivity revealed by the domain swap experiments.17 The N domains of bacteria and human Lon proteases share the sequence identity less than 10% (Figure 2b), whereas the sequence identity of the AP domains is more than 30%,19 suggesting that the N domain may contribute more to the substrate selectivity. Thus, the different conformations of the region between strands β3 and β4 probably indicate the different substrate binding for EcLon and MacLon although no substrates have been identified for MacLon so far. Moreover, a similar substrate cleavage pattern exists in various Lon proteases, and the hydrophobic or nonpolar amino acids such as Leu, Ala, Val, Pro, and Phe are preferred at the preceding position of the cleavage site,17 suggesting that hydrophobic interactions between Lon and its substrates may be important for the substrate selection and cleavage. By analysis of conserved residues in EcLon‐N, a hydrophobic patch mainly consisting of V22, P24, L66, V79, I138, Y141, L145, and Y157 was found and an interaction with the substrate β20 rich in aromatic residues was suggested (Figure 2c).15, 27 Interestingly, a similar hydrophobic patch consisting of V26, P28, L78, L91, V152, L156, I159, and A171 was also observed in MacLon‐N (Figure 2c). Thus, the hydrophobic interactions between the N domain and the substrate may involve in the initial substrate selection and recognition.
3. CONCLUSION
In summary, we determined the crystal structure of MacLon‐N192 at 2.4 å, obtained the relaxation parameters of backbones, and performed the structural comparison between MacLon‐N192 and EcLon‐N. The MacLon‐N192 structure consists of two subdomains connected by a flexible linker and is similar to the overall structure of EcLon‐N. The relaxation parameters reveal two relatively rigid loops Lβ1β2 and Lβ3β4 in which the Lβ1β2 is stabilized by the interactions with two subdomains and the Lβ3β4 is stabilized by H‐bond, salt‐bridge, hydrophobic interactions, and specific prolines. The sequence and structural diversities between MacLon‐N192 and EcLon‐N may contribute to the substrate selectivity, and the hydrophobic interactions between Lon protease and its substrates may involve in the initial substrate selection and recognition. More structures of the N domains of various Lon proteases need to be solved to uncover the precise contribution to substrate recognition.
4. MATERIAL AND METHODS
4.1. Protein expression and purification
The gene for MacLon‐N192 (residues 1–192) was synthesized by GenScript and incorporated into the pET28a vector with an N‐terminal His6 tag followed by a thrombin cleavage site via NdeI/XhoI restriction sites. The protein was expressed in E. coli BL21(DE3) cells. The bacteria were grown in LB medium at 37°C until the OD600 reached 0.6–0.8, and then 1 mM IPTG was added to induce protein expression for 5 hr. To express 13C/15N‐ or Selenomethionine (SeMet)‐labeled proteins, the cells were grown in 1 L of LB medium to an OD600 of ~0.8 and then centrifuged at 4000 rpm for 4 min at 4°C. For 13C/15N‐labeled MacLon‐N192, the cell pellets were resuspended in 0.5 L of M9 medium containing 2 g of uniformly 13C‐labeled glucose and 0.5 g of 15N‐labeled ammonium chloride, and for SeMet‐labeled MacLon‐N192, the cell pellets were resuspended in 0.5 L of M9 medium containing 50 mg each of SeMet, Val, Leu, and Ile and 100 mg each of Phe, Lys, and Thr. After 30 min of growing at 37°C, 1 mM IPTG was added to induce protein expression for 5 hr. Then the cells were centrifuged at 4°C and 9000 rpm for 4 min and stored at −80°C.
The cell pellets were suspended in the lysis buffer (50 mM Tris–HCl, 300 mM NaCl, pH 8.0), and lysed in an ice‐water bath for 30 min using ultrasonic cell crusher VCX800 (Sonic & materials). The lysate was centrifuged at 4°C and 12,000 rpm for 30 min. The supernatant containing the soluble protein was loaded onto a Ni‐NTA column and the column was washed stepwise with the lysis buffer containing 20 mM and 40 mM imidazole. The protein was finally eluted using the lysis buffer containing 250 mM imidazole. After removal of imidazole by dialysis against the buffer of 20 mM Tris–HCl (pH 8.0) and 150 mM NaCl, the thrombin protease (Sigma) was added to cleave the protein overnight at 4°C. The cleaved MacLon‐N192 was further purified using a Superdex 75 10/300 GL gel‐filtration column (GE Healthcare) and the collected fraction was concentrated using Amicon Ultra‐15 (Millipore). The protein purity was verified by SDS‐PAGE and the protein concentration was measured using NanoVue ultra micro spectrophotometer (GE Healthcare).
4.2. Crystallization
Crystallization screening of MacLon‐N192 was performed at 22°C using crystallization kits (Hampton Research) and the sitting‐drop vapor‐diffusion method. The protein was prepared at a concentration of 13 mg/mL for crystallization. The best crystals were obtained within 8 days under the condition of 100 mM sodium acetate trihydrate (pH 4.8) and 3.3 M sodium formate for both native and SeMet‐labeled MacLon‐N192.
4.3. Data collection and structure determination and refinement
The X‐ray diffraction data were collected using a pilatus3 6M detector on the 19U1 beamline at Shanghai Synchrotron Radiation Source. All crystal data were indexed, integrated, and scaled by HKL2000.28 The crystal structure of MacLon‐N192 was determined using the SAD method. The initial phase was calculated with CCP4 Crank2 program29 by using three selenium atoms identified in one asymmetric unit of MacLon‐N192 and the SAD method. The crystal structures were refitted manually in Coot30 and refined with Phenix.refine.31 The crystal diffraction data and refinement statistics are shown in Table 1. The crystal structure of MacLon‐N192 was deposited to Protein Data Bank (PDB) with an accession code of 6IHG.
4.4. NMR experiments
The 15N‐ and 13C/15N‐labeled samples were prepared by dissolving 0.5 mM proteins in NMR buffer (20 mM Na2HPO4‐NaH2PO4, 100 mM NaCl, 0.02% NaN3, 10% D2O, pH 6.4). All NMR experiments were conducted at 308 K on a Bruker 850 MHz spectrometer equipped with a z‐gradient triple‐resonance cryoprobe. Two‐ and three‐dimensional spectra of 1H—15N HSQC, 1H—13C HSQC, 1H—13C‐15N HNCACB, CBCA(CO)NH, HNCA, HN(CO)CA, HNCO, and HN(CA)CO were recorded for backbone resonance assignments. For 15N T1 measurements, the delay times were set to 10, 50, 100 (×2), 200, 400, 600, 800 (×2), 1200, 1600, and 2000 ms, and for 15N T2 measurements, the delay times were set to 16.96, 33.92 (×2), 50.88, 67.84, 84.8, 101.76, 118.72, 135.68 (×2), 152.64, and 169.6 ms. The repeated experiments were used to estimate uncertainties of T1 and T2 values. In the 1H—15N NOE experiments, a delay of 2 s was followed by 1H saturation of 3 s, and in the control experiments without 1H saturation, a total delay of 5 s was applied. All NMR spectra were processed using NMRPipe32 and analyzed using NMRFAM‐SPARKY.33 The assigned chemical shifts of MacLon‐N192 were deposited to Biological Magnetic Resonance Data Bank (BMRB) with an accession code of 12025.
CONFLICT OF INTEREST
The authors declare no conflicts of interest.
Supporting information
Supplementary Figure S1 Size exclusion chromatography analysis of MacLon‐N192.
Supplementary Figure S2. Structural comparison of MacLon‐N192 with its homologs.
ACKNOWLEDGMENTS
This research was financially supported by the National Key Research and Development Project of China (No. 2016YFA0500600). The crystal diffraction data were collected on the BL19U1 beamline of National Facility for Protein Science (NFPS) at Shanghai Synchrotron Radiation Facility. All the NMR experiments were performed at the High‐Field Nuclear Magnetic Resonance Centre of Xiamen University.
Chen X, Zhang S, Bi F, et al. Crystal structure of the N domain of Lon protease from Mycobacterium avium complex . Protein Science. 2019;28:1720–1726. 10.1002/pro.3687
Significance statement: Nontuberculous mycobacteria pulmonary disease has been increasing worldwide and causes significant burden. Lon proteases are essential for the survival and reproduction of all cells, but no structural information of Lon protease from Mycobacterium avium complex is available. Our research on the structure, backbone assignments, and backbone dynamics analysis of the N domain of Lon protease from M. avium complex provide a structural and dynamic basis for well understanding biological functions of the N‐terminal domain of Lon protease, and can help to develop new therapeutic strategies against the pathogen.
Funding information National Key Research and Development Project of China, Grant/Award Number: 2016YFA0500600
Contributor Information
Hongwei Yao, Email: hwyao@xmu.edu.cn.
Donghai Lin, Email: dhlin@xmu.edu.cn.
REFERENCES
- 1. Nishiuchi Y, Iwamoto T, Maruyama F. Infection sources of a common non‐tuberculous mycobacterial pathogen, Mycobacterium avium complex . Front Med. 2017;4:27. [DOI] [PMC free article] [PubMed] [Google Scholar]
- 2. Lande L, George J, Plush T. Mycobacterium avium complex pulmonary disease: new epidemiology and management concepts. Curr Opin Infect Dis. 2018;31:199–207. [DOI] [PubMed] [Google Scholar]
- 3. Taylor RH, Falkinham JO, Norton CD, LeChevallier MW. Chlorine, chloramine, chlorine dioxide, and ozone susceptibility of Mycobacterium avium . Appl Environ Microb. 2000;66:1702–1705. [DOI] [PMC free article] [PubMed] [Google Scholar]
- 4. Griffith DE, Aksamit T, Brown‐Elliott BA, et al. An official ATS/IDSA statement: diagnosis, treatment, and prevention of nontuberculous mycobacterial diseases. Am J Respir Crit Care Med. 2007;175:367–416. [DOI] [PubMed] [Google Scholar]
- 5. Wallace RJ Jr, Brown‐Elliott BA, McNulty S, et al. Macrolide/Azalide therapy for nodular/bronchiectatic Mycobacterium avium complex lung disease. Chest. 2014;146:276–282. [DOI] [PMC free article] [PubMed] [Google Scholar]
- 6. Lee BY, Kim S, Hong Y, et al. Risk factors for recurrence after successful treatment of Mycobacterium avium complex lung disease. Antimicrob Agents Ch. 2015;59:2972–2977. [DOI] [PMC free article] [PubMed] [Google Scholar]
- 7. Sauer RT, Baker TA. AAA+ proteases: ATP‐fueled machines of protein destruction. Annu Rev Biochem. 2011;80:587–612. [DOI] [PubMed] [Google Scholar]
- 8. Lee I, Suzuki CK. Functional mechanics of the ATP‐dependent Lon protease‐ lessons from endogenous protein and synthetic peptide substrates. Biochim Biophys Acta. 2008;1784:727–735. [DOI] [PMC free article] [PubMed] [Google Scholar]
- 9. Van Melderen L, Aertsen A. Regulation and quality control by Lon‐dependent proteolysis. Res Microbiol. 2009;160:645–651. [DOI] [PubMed] [Google Scholar]
- 10. Venkatesh S, Lee J, Singh K, Lee I, Suzuki CK. Multitasking in the mitochondrion by the ATP‐dependent Lon protease. Biochim Biophys Acta. 2012;1823:56–66. [DOI] [PMC free article] [PubMed] [Google Scholar]
- 11. Cha SS, An YJ, Lee CR, et al. Crystal structure of Lon protease: molecular architecture of gated entry to a sequestered degradation chamber. EMBO J. 2010;29:3520–3530. [DOI] [PMC free article] [PubMed] [Google Scholar]
- 12. Wohlever ML, Baker TA, Sauer RT. Roles of the N domain of the AAA+ Lon protease in substrate recognition, allosteric regulation and chaperone activity. Mol Microbiol. 2014;91:66–78. [DOI] [PMC free article] [PubMed] [Google Scholar]
- 13. Kereiche S, Kovacik L, Bednar J, et al. The N‐terminal domain plays a crucial role in the structure of a full‐length human mitochondrial Lon protease. Sci Rep. 2016;6:33631. [DOI] [PMC free article] [PubMed] [Google Scholar]
- 14. Duman RE, Lowe J. Crystal structures of Bacillus subtilis Lon protease. J Mol Biol. 2010;401:653–670. [DOI] [PubMed] [Google Scholar]
- 15. Li M, Gustchina A, Rasulova FS, et al. Structure of the N‐terminal fragment of Escherichia coli Lon protease. Acta Cryst. 2010;D66:865–873. [DOI] [PMC free article] [PubMed] [Google Scholar]
- 16. Cheng I, Mikita N, Fishovitz J, Frase H, Wintrode P, Lee I. Identification of a region in the N‐terminus of Escherichia coli Lon that affects ATPase, substrate translocation and proteolytic activity. J Mol Biol. 2012;418:208–225. [DOI] [PubMed] [Google Scholar]
- 17. He L, Luo D, Yang F, et al. Multiple domains of bacterial and human Lon proteases define substrate selectivity. Emerg Microbes Infect. 2018;7:149. [DOI] [PMC free article] [PubMed] [Google Scholar]
- 18. Lee AY, Chen YD, Chang YY, et al. Structural basis for DNA‐mediated allosteric regulation facilitated by the AAA+ module of Lon protease. Acta Cryst. 2014;D70:218–230. [DOI] [PubMed] [Google Scholar]
- 19. Lin CC, Su SC, Su MY, et al. Structural insights into the allosteric operation of the Lon AAA+ protease. Structure. 2016;24:667–675. [DOI] [PubMed] [Google Scholar]
- 20. Su SC, Lin CC, Tai HC, et al. Structural basis for the magnesium‐dependent activation and hexamerization of the Lon AAA+ protease. Structure. 2016;24:676–686. [DOI] [PubMed] [Google Scholar]
- 21. Nishii W, Kukimoto‐Niino M, Terada T, et al. A redox switch shapes the Lon protease exit pore to facultatively regulate proteolysis. Nat Chem Biol. 2015;11:46–51. [DOI] [PubMed] [Google Scholar]
- 22. Garcia‐Nafria J, Ondrovicova G, Blagova E, et al. Structure of the catalytic domain of the human mitochondrial Lon protease: proposed relation of oligomer formation and activity. Protein Sci. 2010;19:987–999. [DOI] [PMC free article] [PubMed] [Google Scholar]
- 23. Botos I, Melnikov EE, Cherry S, et al. The catalytic domain of Escherichia coli Lon protease has a unique fold and a Ser‐Lys dyad in the active site. J Biol Chem. 2004;279:8140–8148. [DOI] [PubMed] [Google Scholar]
- 24. Li M, Rasulova F, Melnikov EE, et al. Crystal structure of the N‐terminal domain of E. coli Lon protease. Protein Sci. 2005;14:2895–2900. [DOI] [PMC free article] [PubMed] [Google Scholar]
- 25. Shen Y, Delaglio F, Cornilescu G, Bax A. TALOS+: a hybrid method for predicting protein backbone torsion angles from NMR chemical shifts. J Biomol NMR. 2009;44:213–223. [DOI] [PMC free article] [PubMed] [Google Scholar]
- 26. Lin P, Yao H, Zha J, Zhao Y, Wu C. Ordered and isomerically stable bicyclic peptide scaffolds constrained through cystine bridges and proline turns. Chembiochem. 2019;20:1514–1518. [DOI] [PubMed] [Google Scholar]
- 27. Gur E, Sauer RT. Recognition of misfolded proteins by Lon, a AAA(+) protease. Genes Dev. 2008;22:2267–2277. [DOI] [PMC free article] [PubMed] [Google Scholar]
- 28. Otwinowski Z, Minor W. Processing of X‐ray diffraction data collected in oscillation mode. Methods Enzymol. 1997;276:307–326. [DOI] [PubMed] [Google Scholar]
- 29. Bailey S. The CCP4 suite: programs for protein crystallography. Acta Cryst. 1994;D50:760–763. [DOI] [PubMed] [Google Scholar]
- 30. Emsley P, Cowtan K. Coot: model‐building tools for molecular graphics. Acta Crystallogr. 2004;D60:2126–2132. [DOI] [PubMed] [Google Scholar]
- 31. Adams PD, Grosse‐Kunstleve RW, Hung LW, et al. PHENIX: building new software for automated crystallographic structure determination. Acta Cryst. 2002;D58:1948–1954. [DOI] [PubMed] [Google Scholar]
- 32. Delaglio F, Grzesiek S, Vuister GW, Zhu G, Pfeifer J, Bax A. NMRPipe: a multidimensional spectral processing system based on UNIX pipes. J Biomol NMR. 1995;6:277–293. [DOI] [PubMed] [Google Scholar]
- 33. Lee W, Tonelli M, Markley JL. NMRFAM‐SPARKY: enhanced software for biomolecular NMR spectroscopy. Bioinformatics. 2015;31:1325–1327. [DOI] [PMC free article] [PubMed] [Google Scholar]
Associated Data
This section collects any data citations, data availability statements, or supplementary materials included in this article.
Supplementary Materials
Supplementary Figure S1 Size exclusion chromatography analysis of MacLon‐N192.
Supplementary Figure S2. Structural comparison of MacLon‐N192 with its homologs.