Abstract
Real-time monitoring of arteriovenous graft blood flow would provide early warning of graft failure to permit interventions such as angioplasty or graft replacement to avoid catastrophic failure. We have developed a new type of flexible pulsation sensor (FPS) consisting of a 3D printed elastic cuff wrapped around a graft and thus not in contact with blood. The FPS uses multi-walled carbon nanotubes (MWCNTs) dispersed in polydimethylsiloxane (PDMS) as a piezoresistive sensor layer, which is embedded within structural thixotropic PDMS. These materials were specifically developed to enable sensor additive manufacturing via 3D Bio-plotting, and the resulting strain sensor is more compliant and has a wider maximum strain range than graft materials. Here, we analyze the strain transduction mechanics on a vascular graft and describe the memristive properties of MWCNT-PDMS composites, which may be mitigated using AC biasing. In vitro testing of the FPS on a vascular graft phantom showed a robust, linear sensor output to pulsatile flows (170–650 mL/min) and pressures (62–175 mmHg). The FPS showed an RMS error when measuring pressure and flow of 7.7 mmHg and 29.3 mL/min, with a mean measurement error of 6.5% (pressure) and 8.0% (flow).
I. Introduction
Synthetic arteriovenous vascular grafts are widely used for bypass or for vascular access in hemodialysis [1]. Maintaining the graft’s functional blood flow (patency) is critical to avoid occlusion which can lead to loss of the graft. Graft failure is driven by cellular and molecular processes which are difficult to detect without medical imaging. As a result, approximately 60% of newly-placed vascular access grafts will fail within the first year, causing a cascade of costly and dangerous health complications for patients using the graft for hemodialysis [2]. A key objective in clinical monitoring is to detect changes in graft hemodynamics so preemptive interventions can be planned. Non-invasive imaging is too costly for widespread monitoring of all grafts [3]. Therefore, graft dysfunction is often detected too late to reduce emergency interventions [4].
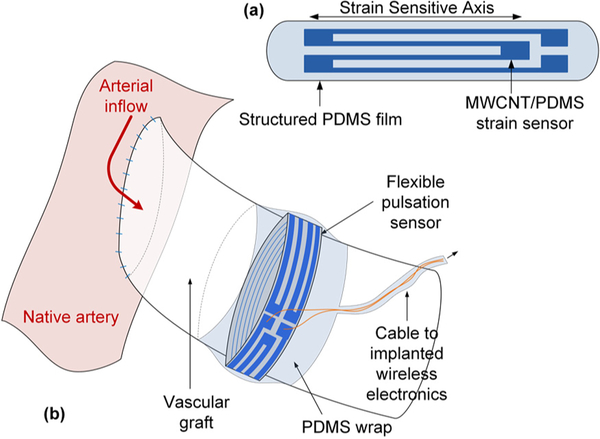
New devices for simple and accurate point of care measurements of graft status would help caregivers to determine if an intervention is required to avoid graft failure or extend graft patency. Instrumenting the graft with integrated sensors is a direct way to measure graft flow and pressure [5,6], however, blood-contacting sensors may stimulate hypercellular processes to accelerate graft failure, or alter the graft mechanical structure. Further, instrumented grafts must be pre-assembled and sterilized prior to use, which could interfere with surgical implantation. We propose that flexible pulsation sensors that detect changes in graft wall motion, are a suitable candidate for implanted graft monitoring (Fig. 1).
Figure 1.
The FPS is a MWCNT-PDMS implantable strain sensor (a) which can provide real-time measurement of pulsatile blood flow (b).
The FPS must be more flexible than the graft material to avoid constricting the graft when pressurized with blood flow [7]. Therefore, we have investigated the use of strain-sensitive, piezoresistive elastomers as the FPS transduction material. Unlike metals, these materials can be strained over very wide strains of 20–100% without damage, and piezoresistive sensors can be measured more easily and precisely than capacitive sensor topologies. We fabricated prototype FPS sensors by dispersing multi-walled carbon nanotubes (MWCNTs) in polydimethylsiloxane (PDMS) to form conductive PDMS (CPDMS) [8]. Here, we report on an improved fabrication method to increase the gauge factor of this material by an order of magnitude and present data for the first time showing that the FPS can sense graft pressure and flow under physiologic conditions from a vascular phantom.
II. FPS Design And Fabrication
The FPS was designed to operate over 0–20% strain to match the strain range of grafts in clinical use [7]. The composite materials in the FPS were developed specifically for printing via a 3D Bio-plotting system [8].
A. Preparation of Conductive and Printable PDMS
The body of the FPS was created with printable PDMS which acts like a gel in the uncured state. Printable PDMS was produced using liquid silicone rubber (A-103, Factor-II) combined with a dispersion of fumed silica nanoparticles with average particle diameter of 10 nm. A concentration of 0.45% fumed silica produced a shear-thinning PDMS gel that were printed at pressures below 3.5 bar with 220 μm line widths.
CPDMS was produced by gently grinding MWCNT granules in a ceramic mortar and sieving to 0.1 mm. MWCNTs were evenly dispersed in toluene at 10 wt% and sonicated for 30 min (Qsonica Q500 probe, 500W, 20 kHz, 30% duty cycle). Next, Sylgard 184 PDMS (Dow Corning) elastomer base and curing agent was added to the MWCNT dispersion. Sylgard 184 was used for the CPDMS layer because of its lower viscosity which enhanced printability. Fumed silica was added at 0.45 wt% to stabilize the mixture when printing. The MWCNT-PDMS-toluene mixture was magnetically stirred at room temperature to evaporate the toluene. Once the mixture became too thick to stir it was transferred to a vacuum desiccator and evaporated to below 3% residual toluene by weight, then transferred to a syringe barrel for 3D Bio-plotting.
D. Elastomeric FPS Design & Fabrication
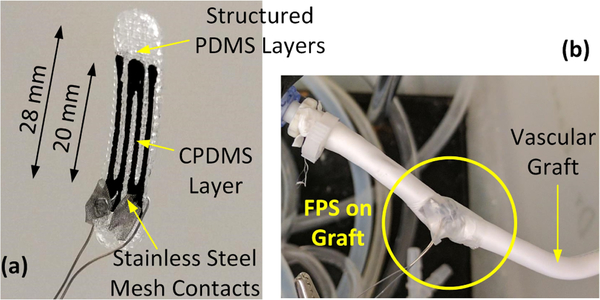
FPS prototypes were printed using an EnvisionTec 3D Bio-plotter system from a CAD model of a strain gauge sensor. Both MWCNT/PDMS (2 – 6%) and printable PDMS inks were printed from a 23-gauge needle at 3.0 bar pressure. The device is a rectangular cuboid composed of a central CPDMS strain gauge layer sandwiched between 2 layers of thixotropic structured PDMS. The strain gauge was designed with 4 stripes (20 × 1.5 mm and 0.23 mm thick) and enlarged contact pads (Fig. 2). CPDMS stripes were spaced 1.5 mm apart. The outer 2 layers of structured PDMS each measured 0.46 mm thick with rectangular 80 μm × 160 μm pores [8]. These pores reduce the rigidity of the structured PDMS layers to improve the strain sensitivity.
Figure 2.
Electrical contacts for the 3D bio-plotted FPS were formed using stainless steel mesh contacts (a). The FPS was wrapped around a vascular graft and secured with PDMS film for pressure-flow characterization(b).
For in vitro testing on a graft, the printed FPS was attached to stainless steel leads terminated in 2 mm × 6 mm stainless steel mesh electrodes. The leads were crimped around the FPS to penetrate the CPDMS layer. To avoid short circuits, the electrodes were placed so only 1/2 of the strain sensor was measured, which halved sensitivity.
E. FPS pressure-flow-related output signal
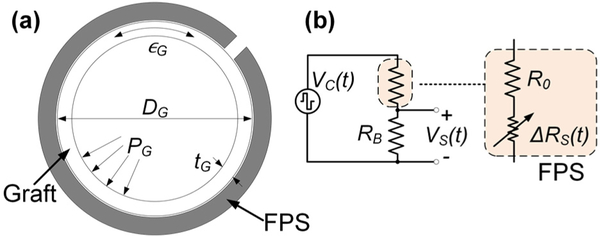
Here, we relate the transduction mechanics linking graft pressure and flow to FPS resistance change via mechanical strain (Fig. 3a). This model assumes that the FPS is the same circumference as the graft and is mechanically linked such that the FPS and graft distension are equal under pressurized flow. We assume, via the Poiseuille equation that graft flow QG and pressure PG are linearly related by a factor η, i.e. ηQG = PG.
Figure 3.
A simple graft model (a) assumes that the FPS experiences the graft strain ∊G generated by pressure PG. The FPS in a half bridge circuit (b) is modeled as a fixed R0 in series with a strain-dependent RS.
For a cylindrical graft, circumferential stress σθ is approximated by Barlow’s equation and related to the graft Young’s modulus EG by
| (1) |
where ∊G is the circumferential strain in the graft, and DG and tG are the graft diameter and thickness, respectively. Because the FPS is more flexible than the graft, we assume that the graft’s modulus and thickness are mechanically dominant. The change in circumferential length ΔL can be calculated through circumferential strain (∊G = ΔL/L0):
| (2) |
Under a pressure PG, the FPS strain ∊S is approximately
| (3) |
which is the same as (1) with the assumption . To first order, ∊S is therefore proportional to graft pressure and flow.
For a FPS in a half bridge with RB (Fig. 3b), R0 is the nominal FPS resistance and ΔRS(t) is the time-variant sensor resistance under periodic pulsatile flow. ΔRS(t) can be derived using a strain sensor gauge factor (GF) conversion
| (4) |
The change in sensor resistance is linked to graft flow through the relation ηQG(t) = PG(t). If RB is chosen as RB = R0, the flow-dependent sensor output is given by
| (5) |
If all time-invariant factors (relating to sensor geometry and material properties) are grouped into a single term γFPS, the FPS output signal is approximately
| (6) |
To avoid memristive effects (discussed later), and to reduce the effect of 1/f noise, VC(t) should be an AC carrier, i.e. a square wave. Equation (6) shows that the FPS output in these conditions is an AM-modulated waveform with modulation index h = max(γFPSQG(t))/max(VC(t)).
III. CPDMS Strain Characterization
CPDMS composites were electrically characterized using stencil-cast 6.0 × 2.0 × 0.1 mm films probed with gold-plated, spring-loaded contact pins. Current and voltage sweeps were performed with a Keithley 2400 SourceMeter.
A. CPDMS memristive behavior
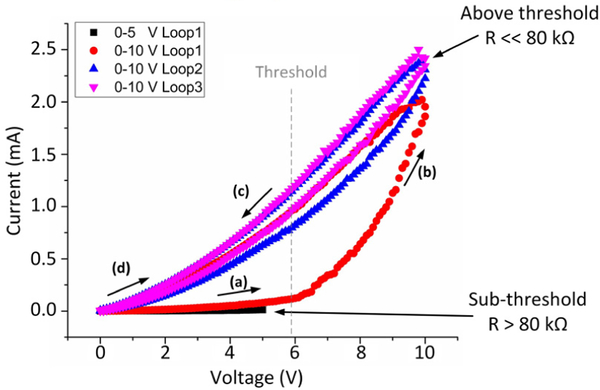
CPDMS films were first tested using swept DC bias (Fig. 4). For brevity, only data from 3 wt% MWCNT CPDMS is presented. At low voltages, the CPDMS showed a linear I-V curve, with R > 80 kΩ. At a voltage threshold, the material switched to a lower resistivity phase, with R << 80 kΩ. Repeated low voltage sweeps followed the low resistance curve. This effect persisted even when removing all current and electric field from the CPDMS. Reversing the direction of current flow, or straining the CPDMS composite, reset the composite to the initial high-resistance state. Therefore, CPDMS has memristive properties which should be studied.
Figure 4.
Memristive behavior in 3% CPDMS. Initially the material has a high resistance (a). After crossing a voltage threshold, a phase shift occurs (b) as resistance drops by at least an order of magnitude (c). The phase shift is maintained even with no current (d). Reversing the current polarity or straining the composite resets the composite to the high-resistance state.
The memristive effect in CPDMS was also time-dependent, with samples eventually shifting to the low-resistance phase even at low DC voltage bias, over periods of minutes to hours. This might be due to localized Van der Waal’s forces which maintain short MWCNT spacing after the CNTs align to an electric field or thermally vibrate within a critical distance [9–10]. Flipping the bias current polarity eliminated the memristive effect; under 200-Hz AC bias, CPDMS had a more stable and lower resistance (Table I).
Table I.
Sheet And Contact Resistance For AC-Biased CPDMS
| MWCNT wt.% | Sheet resistance | Contact resistance |
|---|---|---|
| 2% | 3.9K Ω | 3.3K Ω |
| 4% | 450 Ω | 360 Ω |
| 6% | 160 Ω | 120 Ω |
B. CPDMS strain gauge factor
The gauge factor of 6.0 × 2.0 × 0.1 mm CPDMS samples was tested over the range of 0–20%. Static strain was induced by clamping the sample between copper foil contacts and stretching the sample using a micro-positioner. Sensors showed an increasing resistance when strained, as expected based on prior reports of MWCNT/PDMS composites. Only data from the 3% CNT material is shown for brevity (Fig. 5). Across 20 stretching cycles, average variation at each level of strain was +/− 0.80%. This material showed an average gauge factor of 11.6, which is an order of magnitude higher than prior results [8]. We attribute the improvement in gauge factor to the MWCNT grinding and sonication steps, which produce a more homogeneous composite so that more CNTs contribute to changing conductivity under strain.
Figure 5.
Static strain response of 3% CPDMS sample over 20 cycles. The sensor had a nonlinear response to strain with average gauge factor of 11.6.
IV. FPS Flow Sensing On Vascular Graft Phantom
The FPS prototype was tested on a vascular graft phantom simulating physiologic flow rates and pressures. Here we present preliminary data showing the correlation between FPS outputs and graft pressure and flow.
A. Vascular graft phantom
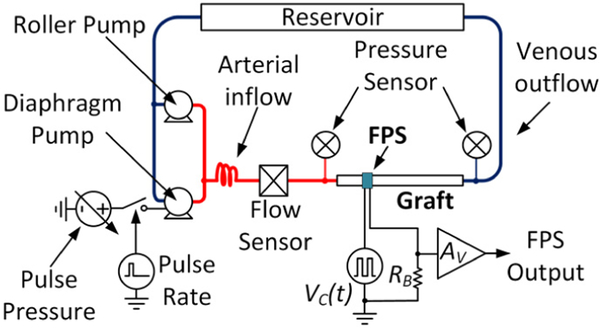
An in vitro vascular flow loop was created based on prior reports of benchtop systems using water to simulate blood [11] (Fig. 6). The system used a peristaltic roller pump (Cole Parmer Masterflex L/S 07522), a variable-voltage diaphragm pump (Shurflo 4008), and a 6-mm diameter, 20-cm long, thin-wall, vascular access graft (Gore-Tex Stretch). Pressure sensors monitored the graft inlet and outflow pressures. In all experiments the roller pump was set to a constant flow and the diaphragm pump was pulsed at 10% duty cycle to simulate a systolic pulse. Pulsatile pressure was controlled by varying the diaphragm pump voltage from 3–12 V. Graft flow was monitored using an Omega FMG90 flow meter. A data acquisition system (National Instruments cDAQ-9178) controlled by National Instruments Labview software was used to record pressure and flow sensors, and to control the pulsatile pump at 60 beats per minute.
Figure 6.
Schematic of the pulsatile graft flow circuit used for FPS in vitro test.
B. In vitro flow sensing using FPS
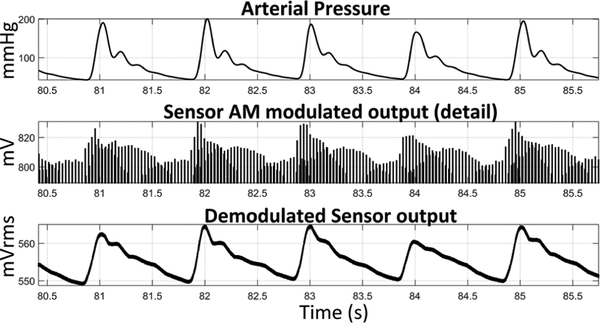
The sensor was placed in a half-bridge sensing configuration as described in Section IIE and driven with a 3-Vpp, 200-Hz square wave. This produced an output signal which was amplitude modulated based on graft flow (Fig. 7). Due to the correlation between flow and pressure the FPS therefore measures both properties. The FPS output was simply AM-demodulated using a moving root-mean-square (RMS) filter with 10 Hz cutoff. Envelope or synchronous demodulation would also be feasible.
Figure 7.
The demodulated FPS output signal was strongly correlated with graft pressure (175 mmHg) and flow (1,160 mL/min).
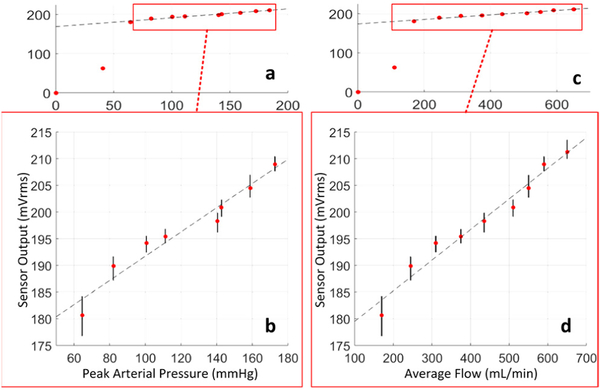
The FPS was tested over a wide range of graft flows within physiologic limits. The FPS strain response varied periodically in each simulated cardiac cycle, as expected. The amplitude of the FPS signal was strongly correlated with arterial pressure, suggesting that graft diameter expansion caused significant strain changes in the FPS. Because the FPS output was periodic with pulsation, RMS amplitude of the sensor response was calculated to produces singular FPS output values for each tested level of graft flow between 0–650 mL/min (Fig. 8a,c).
Figure 8.
The FPS output correlated with arterial pressure (a), with a linear response above 100 mmHg (b). Similar correlation to graft flow (c) was observed, with linear response to physiologic flows in functional grafts (d).
A large change in FPS response occurred between 0–170 mL/min, because peak arterial pressure was below 50 mmHg which was insufficient to keep the graft pressurized through each pulse cycle. Within a physiologic range of flows (170–650 mL/min) [3] and pressures (62–175 mmHg) a linear FPS response was obtained (Fig. 8b,d). Based on a linear fit to the means, the FPS output predicted pressure and flow within an average 6.5% and 8.0% respectively (Table II).
Table II.
Measured In Vitro Accuracy Of FPS Sensor
| Peak Graft Pressure | RMS Error | 7.7 mmHg |
| Max Error | 11.4 mmHg | |
| Average Percent Error | 6.5% | |
| Average Graft Flow | RMS Error | 29.3 mL/min |
| Max Error | 47.7 mL/min | |
| Average Percent Error | 8.0% |
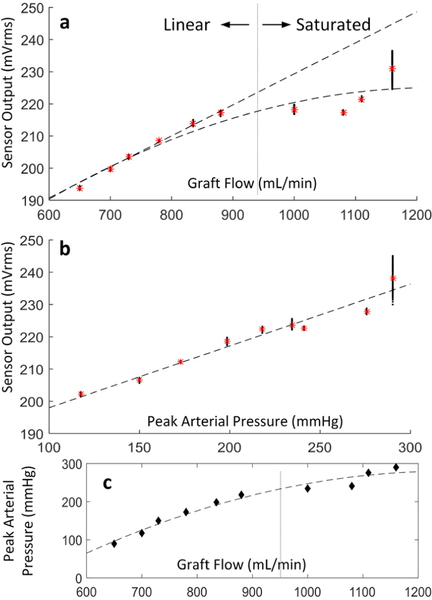
The FPS output was also correlated to flow and pressure at greater flow rates (650 – 1,160 mL/min) also in a physiologic range for hemodialysis access grafts (Fig. 9) [3]. The FPS output was linearly correlated to graft flow rate and pressures, but the response saturated above 900 mL/min (Fig. 9a).
Figure 9.
FPS response relative to graft flow (a) and arterial pressure (b). A nonlinear relation between pressure and flow was observed for both the FPS output and the flow phantom beyond 950 mL/min (c).
When plotted against pressure, however, the FPS output remained linearly correlated with pressure, even at extreme pressures above 225 mmHg. This suggests that a mechanical strain limit is reached within the graft material, which becomes dynamically stiffer at pressures exceeding the normal physiologic range.
V. Conclusion
We have demonstrated multi-layer, 3D structures can be fabricated using additive manufacturing, enabling flexible pulsation sensors for vascular graft flow- and pressure-sensing. Conductive PDMS exhibited memristive properties that were mitigated through AC biasing. AC biasing produces a sensor output that is an amplitude modulated signal proportional to graft dimensions, mechanical properties, and sensor gauge factor. Circumferential strain in the graft during pulsatile flow causes minor changes in graft diameter, which are transduced by the FPS. In vitro testing on vascular phantoms showed that the FPS output correlated linearly with arterial pressure and graft flow. Presented data indicate that the FPS may be suitable for distinguishing small variations in hemodynamics within typical physiologic ranges.
Acknowledgments
This work was supported in part by RX001968–01 from the US Dept. of Veterans Affairs Rehabilitation Research and Development Service. The contents do not represent the views of the US Government.
REFERENCES
- [1].Greenwald S and Berry C, “Improving vascular grafts: the importance of mechanical and haemodynamic properties,” J Pathology, vol. 190, pp. 292–299, 2000. [DOI] [PubMed] [Google Scholar]
- [2].Bosman P et al. , “A comparison between PTFE and denatured homologous vein grafts for haemodialysis access: A prospective randomised multicentre trial. The SMASH Study Group. Study of Graft Materials in Access for Haemodialysis,” European Journal of Vascular Endovascular Surgery, vol. 16, p. 126–132, 1998. [DOI] [PubMed] [Google Scholar]
- [3].National Kidney Foundation, “NKF-K/DOQI clinical practice guidelines for vascular access: update 2006,” Am J Kidney Disease, vol. 48, p. S176–S276, 2006. [DOI] [PubMed] [Google Scholar]
- [4].Paulson W, Moist L and Lok C, “Vascular Access Surveillance: Case Study of a False,” Seminars in Dialysis, vol. 26, no. 3, pp. 281–286, 2013. [DOI] [PubMed] [Google Scholar]
- [5].Locke SE, Gale TJ and Kilpatrick D, “Implantable blood flow measurement techniques for humans,” in Int. Conference of the IEEE Engineering in Medicine & Biology Society, 2005. [DOI] [PubMed] [Google Scholar]
- [6].Cheong JH et al. , “An Inductively Powered Implantable Blood Flow Sensor Microsystem for Vascular Grafts,” IEEE Transactions on Biomedical Engineering, vol. 59, no. 9, pp. 2466–2475, 2012. [DOI] [PubMed] [Google Scholar]
- [7].Gozna ER et al. , “Necessity for elastic properties in synthetic arterial grafts,” Can. J. Surg, vol. 17, pp. 176–179, 1974. [PubMed] [Google Scholar]
- [8].Majerus S, Dunning J, Potkay J and Bogie K, “Flexible, structured MWCNT/PDMS sensor for chronic vascular access monitoring,” in Internal IEEE Sensors Conference, Orlando, 2016. [DOI] [PMC free article] [PubMed] [Google Scholar]
- [9].Ageev OA et al. , “Study of the resistive switching of vertically aligned carbon nanotubes by scanning tunneling microscopy,” Physics of the Solid State, vol. 57, no. 4, p. 825–831, 2015. [Google Scholar]
- [10].Kriegerand JH and Spitzer SM, “Non-traditional, non-volatile memory based on switching and retention phenomena in polymeric thin films,” IEEE Comput Sys Bioinformatics Conf, Orlando, 2004. [Google Scholar]
- [11].Nemati M et al. , “Application of full field optical studies for pulsatile flow in a carotid artery phantom,” Biomed Opt Express, vol.6, no.10, p. 4037–4050, 2016. [DOI] [PMC free article] [PubMed] [Google Scholar]


