Abstract
Subjective analysis of bruits has long been an element of vascular access physical exams. Digital recordings of blood flow bruits—phonoangiograms (PAGs)—may provide an objective, non-imaging measure of vascular access stenosis. We have analyzed the long-term stability in PAGs from typical dialysis patients with arteriovenous fistulas and grafts and found that typical patients have correlated PAG spectra. PAGs can be analyzed using nonlinear, sub-band frequency-domain linear prediction to produce both bruit-enhanced recordings and a bruit-enhanced power envelope. This approach is novel over prior methods because it adaptively predicts signal envelopes based on physiologic properties of blood flow determined from chronic dialysis recipients. Our results indicate that a generalized bruit-enhancing filter can be developed for dialysis vascular access. Outputs from this filter may be analyzed to determine vascular physiology, including re-stenosis risk.
I. Introduction
The success of long-term dialysis and minimization of cost are dependent on maintaining the patient’s vascular access, typically using an arteriovenous (AV) fistula (AVF) or synthetic AV graft (AVG). Loss of access patency is common and is the so-called “Achilles Heel” of hemodialysis. The predominate causes of access dysfunction are stenosis (vascular narrowing) and thrombosis (vascular occlusion) with a combined incidence of 66–73% in AVFs and 85% in AVGs [1,2]. Access dysfunction accounts for an average of two hospital visits/year for dialysis patients [3] and the loss of access patency can double their mortality risk [4].
Monitoring strategies for vascular access include physical examination of vibrations and sounds caused by blood flow, with dialysis equipment, or by imaging technologies. Prospective monitoring of vascular access is costly and requires specialized equipment. This is often not feasible at busy dialysis centers and thus reduced access flow may be undetected until the access is nearly occluded, increasing complication rates and cost. New tools for rapid, objective, economical monitoring are needed to track the function of a vascular access.
Non-invasive access monitoring via phonoangiograms (PAGs) may enable objective, automated screening at the point of dialysis care. PAGs are recordings of blood flow sounds (also known as bruits). PAGs contain a unique acoustic spectrum that correlates strongly with degree of stenosis (DOS) [5] and their interpretation can be automated [6]. Previous studies have recorded and analyzed pathological PAGs, on patients with known access dysfunction, and have relied on imaging to localize the PAG recording site [5,6]. In this context, PAG analysis is of limited value when a patient has already received an intervention and clinical imaging is available. The utility of PAG monitoring is by detecting changes in blood flow across even asymptomatic patients.
In this study, we recorded PAGs over 12 months from 20 stable dialysis outpatients to describe the variability and stability of PAGs over time. Here we describe a signal processing approach which can determine the time-pitch properties (timbre) of a PAG. This method could be used for weekly monitoring at multiple sites along a vascular access to detect shifts in the vascular anatomy over time (Fig. 1). In this study, we analyze the average variation in PAG spectral properties in stable dialysis patients, and demonstrate a new type of filter specifically designed to amplify the physiologic components of blood sound recordings.
Fig. 1.
Prospective monitoring of dialysis vascular access using multi-site PAGs (A) processed through an autoregressive filterbank (B), to produce outputs (C) correlated to physiology. Weekly monitoring determines a map of vascular access function to predict access risk (D).
II. Autoregressive Modeling of Phonoangiograms
Here we describe a novel approach to PAG parameterization, using signal processing based on recordings of human PAGs (Fig. 2). This approach has been generalized but could be customized to a specific patient for more sensitive detection of PAG parametric shifts. Further, this signal processing method only requires causal filters and could therefore be modified for real-time use.
Figure 2.
Phonoangiograms are processed in frames using a bruit-enhancing filter to produce an enhanced X[n] and the power envelope E[n].
Briefly, PAGs are first segmented into 2000-ms frames so that each frame will contain at least one systolic pulse cycle. Each frame is processed through an autoregressive, N-band Bruit-Enhancing Filter (BEF) which applies N sub-band weights W1-WN model the temporal bruit envelope. Frames are recombined using a 25% overlap-add frame smoother to produce 2 time-domain outputs, XBEF[n] and EBEF[n]. XBEF[n] is the bruit-enhanced version of the original PAG and is a clearer recording which can be analyzed using frequency-domain or data clustering methods [5,6]. In this work, we analyze the properties of EBEF[n], which is the modeled time-domain envelope of the bruit signal. In the following sections we analyze typical PAGs to determine the appropriate number and weighting factors for the sub-bands, and also present the mathematical basis for the BEF.
A. Analysis of PAG spectra from dialysis patients
We collected PAGs from volunteers receiving chronic dialysis in a Veterans Affairs outpatient facility. All studies were performed under the ethical oversight of the Louis Stokes Cleveland Veterans Affairs Medical Center Institutional Review Board, protocol 15043-H18. Inclusion criteria for the study were: upper extremity AV access fistula or graft, access used for dialysis at least 2 months, and no access patency concerns at time of enrollment. 20 subjects were enrolled and PAGs were recorded 1–4 times per subject per month over a period of 2–12 months (based on subject availability). PAGs were recorded at 5–8 sites spaced 3 cm apart along the subject’s access, starting at the arterial side and ending at the venous outflow (Fig. 1). 10-s recordings at each site were captured with a 3M Littmann 3200 stethoscope just prior to dialysis treatment. Data was analyzed in MATLAB.
To generalize the BEF in tins representative patient population, the average PAG spectra of all recording sites was computed (Fig. 3) from 1,126 recordings. This analysis is significant due to the large number of recordings spanning much longer time periods than have been previously studied [7–9]. Further, the data was obtained from patients with functional accesses, unlike many other studies enrolling only pathological patients. Therefore, this analysis captures the “normal” PAG spectrum over long time periods, which is useful for monitoring even in asymptomatic patients.
Figure 3.
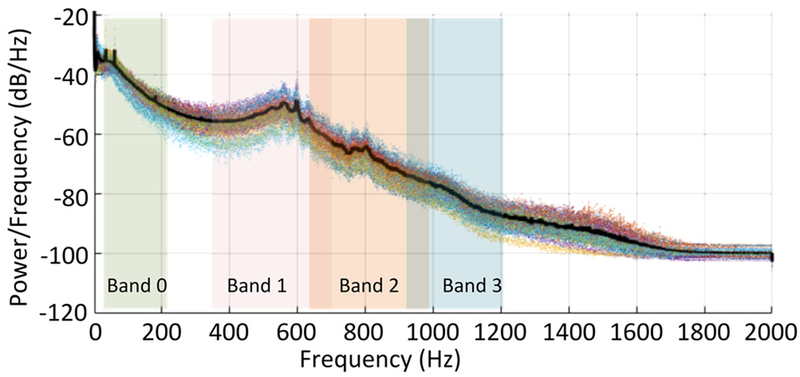
PAG spectra from chronic dialysis recipients (1,126 recordings). Spectra were consistent across patients over 2–12 months of recordings. The average spectrum (black line) revealed 4 bands with unique spectral features.
The spectrum was consistent amongst all subjects in tins study, revealing at least 4 bands with localized spectral peaks (Table I). The spectra agree with prior studies [7–9] that indicated significant spectral content above 400 Hz correlated with vascular stenosis causing turbulent blood flow. However, to our knowledge, this study is the first to formally divide the PAG spectrum into multiple spectral bands.
Table I.
Selected Bands for Frequency-Domain Modeling
| Sub-band Width | Sub-band weight | |
|---|---|---|
| Band 0 | 25 – 225 Hz | 5% |
| Band 1 | 350 – 700 Hz | 50% |
| Band 2 | 650 – 1000 Hz | 30% |
| Band 3 | 950 – 1200 Hz | 15% |
B. Autoregressive Bruit Enhancing Filter
The BEF selectively amplifies PAGs in the time domain, based on frequency-domain content. This nonlinear filter amplifies the systolic pulses of blood flow (and associated stenosis-related turbulence) while attenuating inter-pulse intervals and artifacts due to ambient noise. The BEF is fundamentally based on frequency-domain linear prediction (FDLP) [10]. In general, FDLP estimates the square of a signal’s Hilbert envelope by decorrelating the time and spectral components. Thus, the time-domain envelope is modeled by detecting temporal peaks in the spectral power.
The BEF uses a variant called sub-band FDLP (SB-FDLP) in which FDLP is applied to selected sub-bands (Fig. 4). The BEF is unique because it combines N modeled sub-band envelopes using weight factors W1-WN to produce the modeled time-domain envelope of the bruit signal EBEF[n], and which is used to produce the enhanced PAG XBEF[n].
Figure 4.
The BEF breaks the discrete cosine transform of X[n] into N sub-bands. Sub-bands are modeled using linear predictive coding and recombined with weights WN to produce a bruit envelope EBEF[n].
FDLP relies on the discrete-cosine transform (DCT) of a signal x[n], which produces coefficients XDCT that are real, i.e.
| (1) |
where
| (2) |
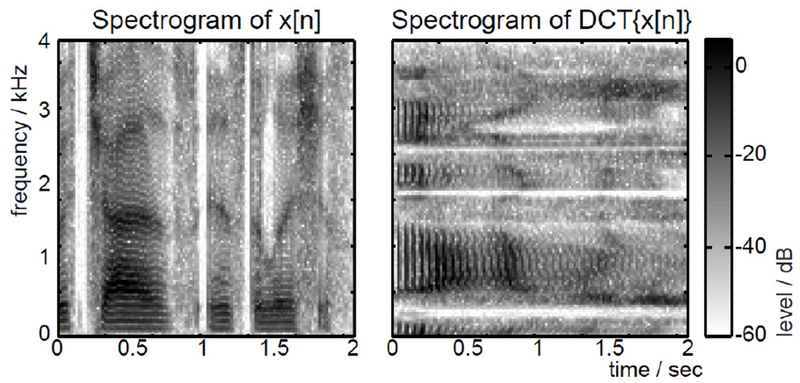
The DCT approximates the envelope of the Discrete Fourier Transform commonly used in temporo-spectral analysis. This implies that the spectrogram of the DCT (treating the DCT as a time sequence) mirrors the time-domain spectrogram around the time/frequency axes (Fig. 5).
Figure 5.
The spectrogram of the DCT matches the spectrogram of x[n] mirrored around the time-frequency axis. Image from [11].
FDLP estimates the temporal envelope when applied in the frequency domain. This implementation uses linear predictive coding (LPC) to model the spectral envelope using a pth-order, all-pole FIR filter
| (3) |
where p is the order of the filter polynomial and P(z) is its z-transform. LPC uses least-squares iterative fitting to determine the coefficients ak of the FIR filter P(z) such that the error in determining the next value of a series is minimized. The calculated filter is an autoregressive model because it predicts the future value of a signal based on a linear combination of past values of the same signal.
In the BEF, the DCT coefficients are divided into N sub-bands which can be arbitrarily defined or overlapping. LPC is used on each set of N sub-band coefficients to fit a filter Hm(z) which predicts the series of DCT coefficients in the mth sub-band. By time-frequency duality and the properties of the DCT (see Fig. 5), the frequency response of Hm(z) actually models the effective temporal envelope of signal x[n] at frequencies within the mth sub-band. In other words, the impulse response of Hm(z), hm[n], predicts the time-domain envelope of x[n] due to frequencies within the mth sub-band.
The N sub-band envelopes hm[n] are combined to produce a bruit-enhanced envelope EBEF[n] using weights Wm:
| (4) |
Finally, the enhanced PAG, XBEF[n] is produced simply by multiplying the original PAG by EBEF [n] to amplify the time components of XBEF[n] which contribute strongly to the N modeled sub-bands.
III. Analysis of Sub-Band Modeled Envelopes
One advantage of FDLP over other analytic signals like the Hilbert transform is that the time-sensitivity of the predictor can be adjusted by limiting the number of poles (p in Eqn. 3). In the least-squares fitting step of LPC, poles are first fit to the spectral coefficients with the most power. Once all the poles are fitted, less significant DCT coefficients are ignored. The FDLP “pole rate” (number of poles per sample) controls time-sensitivity: low rates produce smoother power envelopes while high rates approximate the Hilbert envelope.
A. Sub-band FDLP envelopes of PAGs
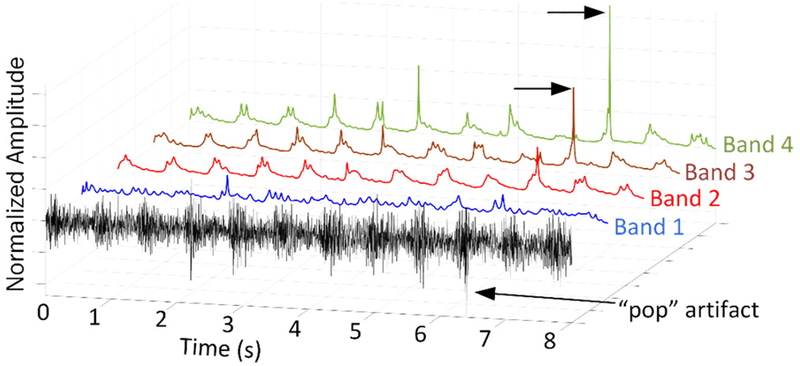
Based on the spectral analysis of Section IIA, we determined 4 sub-bands for autoregressive modeling in the BEF. Each sub-band is modeled using the same pole rate of 1/50 poles/ms, or equivalently, 40 LPC poles per 2000 ms frame. The SB-FDLP decomposition can be easily demonstrated using a typical PAG signal (Fig. 6). Note that the power envelopes of Bands 1–2 contain distinct repetitive waveforms within each blood flow systole. This is expected, as those bands range from 350–1000 Hz, matching the local maxima in the spectral analysis of all subjects in Section IIA and reported previously. In this example, a “pop” artifact is present, which is reflected as in a transient spike of envelope power in the high frequency Bands 2–3. This demonstrates how SB-FDLP adaptively allocates LPC poles within each frame, to nonlinearly estimate the effective temporal contributions of each PAG band.
Figure 6.
Sub-band FDLP estimates the temporal envelopes based on spectral power of each sub-band. In this example, the “pop” artifact is modeled in high-frequency bands 2–3.
As indicated in Eqn. 4, sub-band envelopes are combined using weights Wm to produce an output bruit envelope XBEF[n]. We selected sub-band weights to be proportional to the degree of spectral variation in each band, and also prior studies of PAGs (Table I). Because the most patient-to-patient variation is seen in Bands 1 and 2, those bands are weighted more heavily so that the BEF amplifies differences in PAGs caused by physiologic differences between patients.
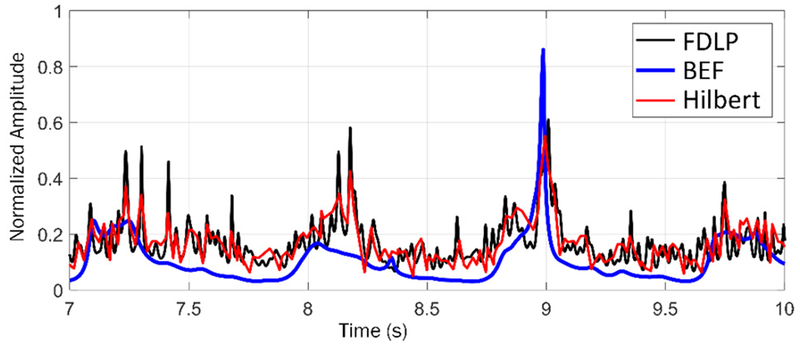
The combined envelope XBEF[n] is significantly different from typical analytic envelopes such as the broadband FDLP and Hilbert envelopes (Fig. 7). Despite using the same pole rate, the SB-FDLP envelope is significantly smoother than that of FDLP. Roughly, the SB-FDLP envelope approximates the Hilbert envelope, but attenuates inter-systole periods which do not contain bruit-related frequencies. Therefore, it adaptively amplifies portions of the PAG with frequencies related to turbulent blood flow. Besides producing the enhanced PAGA XBEF[n], the SB-FDLP envelope itself can be parametrically analyzed to describe PAG signal properties.
Figure 7.
Comparison of different analytic signal envelopes. The BEF envelope produced from SB-FDLP is smoother and amplifies systolic periods more accurately than broadband FDLP or Hilbert envelopes.
B. Bruit-enhanced time-domain PAGs
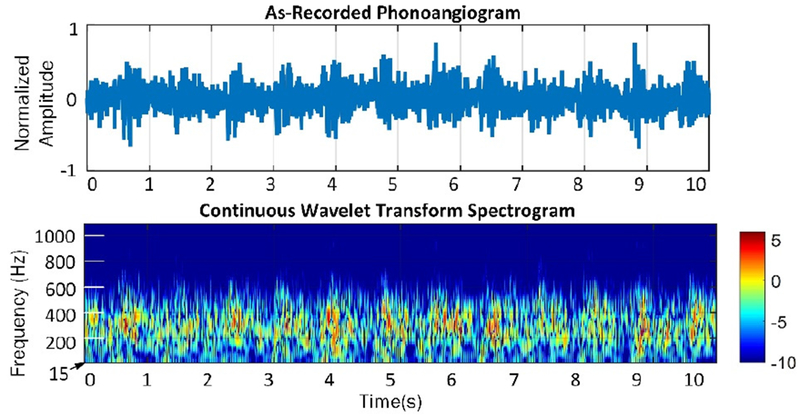
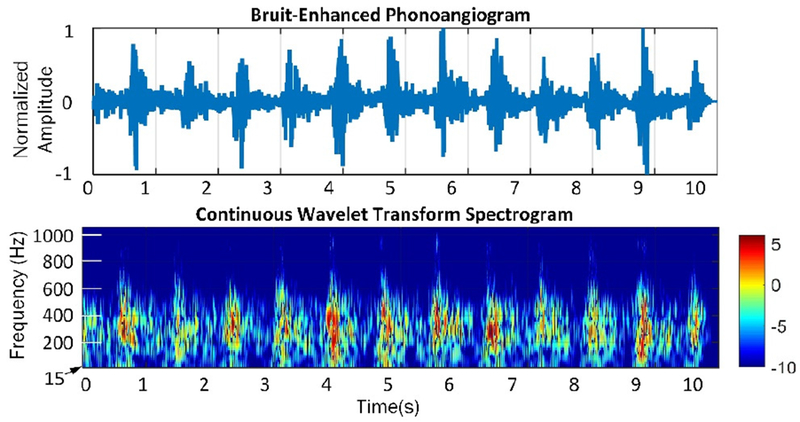
The qualitative time- and spectral-domain effects of the BEF are clear when comparing PAGs before and after BEF processing (Figs. 8–9). The figures also show spectrograms produced by a continuous wavelet transform using the Morlet wavelet; wavelet scales were computed over 6 octaves with 12 voices/octave, starting at scale 3. The processed PAG has frequency components which are nonlinearly amplified within systoles and attenuated between them; this is the advantage of the BEF compared to linear filtering.
Figure 8.
Time- and spectral-domain representations of example PAG.
Figure 9.
Time- and spectral-domain representations of a bruit-enhanced PAG. Note that in-band frequencies are adaptively amplified and attenuated by the BEF to accentuate the physiologic bruit.
C. Determining access patency from SB-FDLP envelopes
PAGs can be parametrically analyzed to quantity vascular access function [5–6]. One promising parameter derived from EBEF[n] is the RMS sub-band velocity SBVRMS, i.e., time-derivative of EBEF[n]:
| (5) |
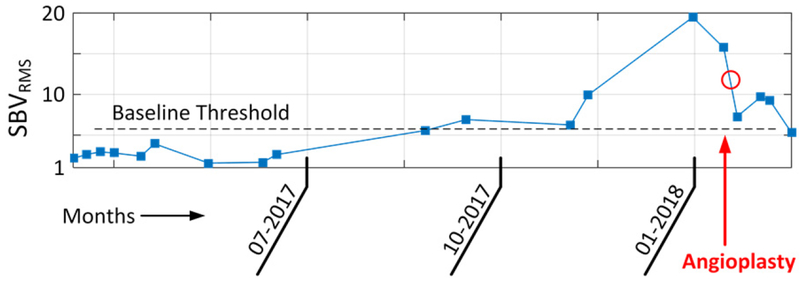
Note that (5) only uses the modeled SB-FDLP envelope and not the enhanced PAG XBEF[n]. SBVRMS estimates the spectral flux, or the rate at which frequencies in the PAG shift between low and high bands. SBVRMS can be tracked over time to detect subtle changes in access function. In one example subject, 17 values of SBVRMS were calculated over 11 months (Fig. 10). This subject showed a stable baseline for 8 months with an accelerating increase, peaking 2 weeks before losing access function due to clotting. After a successful angioplasty (de-clotting), SBVRMS values recovered. This suggests that parametric description of bruits may predict declining access function and be a useful tool for clinical decision making.
Figure 10.
Clinical example of access monitoring using SBVRMS parameter. Two weeks after 01–2018 this patient had angioplasty to restore access function. SBVRMS was elevated for 6 weeks prior, suggesting that early detection of access dysfunction via PAG monitoring is clinically feasible.
IV. Conclusion
We have developed a bruit-enhancing filter (BEF) based on the natural spectra of blood flow sounds. An average spectrum calculated from 1,126 PAG recordings indicated 4 bands with local spectral features, which were modeled using sub-band FDLP to produce a unique BEF. This filter adaptively assigns all-pole filters to a PAG to nonlinearly amplify sections of the recording that correlate with spectral properties of bruits. Filtered recordings from research volunteers showed that the BEF selectively amplified spectral components within systolic pulses and produced parametric outputs that correlate with vascular access stenosis. Future work will include determining vascular access dysfunction risk based on PAG analysis.
Acknowledgments
* This work was supported in part by RX001968-01 from the US Dept. of Veterans Affairs Rehabilitation Research and Development Service. The contents do not represent the views of the US Government.
References
- [1].Al-Jaishi AA, Liu AR, Lok CE, Zhang JC and Moist LM, “Complications of the Arteriovenous Fistula: A Systematic Review,” J Am Soc Nephrol, vol. 28, no. 6, 2016. [DOI] [PMC free article] [PubMed] [Google Scholar]
- [2].Bosman P et al. “A comparison between PTFE and denatured homologous vein grafts for haemodialysis access: A prospective randomised multicentre trial. The SMASH Study Group. Study of Graft Materials in Access for Haemodialysis,” Eur J Vasc Endovasc Surg, vol. 16, p. 126–132, 1998. [DOI] [PubMed] [Google Scholar]
- [3].Sehgal A, Dor A and Tsai A, “Morbidity and cost implications of inadequate hemodialysis,” Am J Kidney Dis, vol. 37, pp. 1223–1231, 2001. [DOI] [PubMed] [Google Scholar]
- [4].L. E Jr, Wang W, Lazarus J and Hakim R, “Change in vascular access and mortality in maintenance hemodialysis patients,” Am J Kidney Dis, vol. 54, no. 5, pp. 912–921, 2009. [DOI] [PubMed] [Google Scholar]
- [5].Sung P, Kan C, Chen W, Jang L and Wang J, “Hemodialysis vascular access stenosis detection using auditory spectro-temporal features of phonoangiography,” Med Biol Eng Comput, vol. 53, pp. 393–403,2015. [DOI] [PubMed] [Google Scholar]
- [6].Du Y-C et al. “Residual stenosis estimation of arteriovenous grafts using a dual-channel phonoangiography with fractional-order features,” IEEE Journal of Biomedical and Health Informatics, vol. 19, no. 2, pp. 590–600,2015. [DOI] [PubMed] [Google Scholar]
- [7].Mansy H, Hoxie S, Patel N and Sandler R, “Computerised analysis of auscultatory sounds associated with vascular patency of haemodialysis access,” Medical & Biological Engineering & Computing, vol. 43, pp. 56–62, 2005. [DOI] [PubMed] [Google Scholar]
- [8].Akay YM, Welkowitz W, Semmlow JL and Kostis JB, “Noninvasive acoustical detection of coronary artery disease: a comparitive study of signal processing methods,” IEEE Transactions on Biomedical Engineering, vol. 40, no. 6, p. 1993, 571–578. [DOI] [PubMed] [Google Scholar]
- [9].Pravica DW, Bier M and Day O, “Murmurs and noise caused by arterial narrowing - Theory and clinical practice,” Fluctuation and Noise Letters, vol. 6, no. 4, pp. 415–25, 2006. [Google Scholar]
- [10].Athineos M and Ellis DPW, “Autoregressive Modeling of Temporal Envelopes,” IEEE Transactions on Signal Processing, vol. 55, no. 11, pp. 5237–45,2007. [Google Scholar]
- [11].Athineos M and Ellis DPW, “Frequency-domain linear prediction for temporal features,” in IEEE Workshop on Automatic Speech Recognition and Understanding, 2003. [Google Scholar]
- [12].Nemati M et al. “Application of full field optical studies for pulsatile flow in a carotid artery phantom,” Biomed Opt Express, vol. 6, no.10, p. 4037–4050, 2016. [DOI] [PMC free article] [PubMed] [Google Scholar]


