Abstract
Background/Aims
Lipoxin A4 (LXA4), an anti-inflammatory lipid mediator, regulates leukocyte cellular activity and activates gene transcription. The therapeutic effect of LXA4 on liver fibrosis and its mechanism on the immune system are largely unknown. Because the regenerative capacity of hepatocytes in acute and chronic liver failure models of mouse increases by silencing MKK4, we aimed to investigate the effect of parenteral administration of LXA4 on the genes responsible for regeneration of liver, namely MKK4, MKK7, and ATF2, and visualize the therapeutic effects in an experimental model.
Materials and Methods
Fibrosis was induced in mice by administration of thioacetamide (TAA). LXA4 was administered during the last two weeks of fibrosis induction. The fibrosis level was measured by Knodell scoring. The liver function was measured by analyzing serum ALT, AST, and AP levels. Expression levels of genes responsible for liver fibrosis (TGF-α) and cell regeneration (MKK4, MKK7, and ATF2) have been measured by RT-PCR analysis. Inflammatory and anti-inflammatory cytokine levels were measured in serum samples and liver homogenates by Enzyme Linked Immunosorbent Assay (ELISA). Ultrathin sections were examined using a transmission electron microscope and analyzed.
Results
We observed significant healing in liver of the LXA4-treated group, histologically. This finding was in parallel with reduction of serum ALT, AST, but not AP levels. TGF-α and MKK4 expressions were significantly reduced in the LXA4-treated group. Administration of LXA4 caused significant elevation of IL-10 in systemic circulation; however, that elevation was not detected in liver homogenates. Nevertheless, significant reductions in TNF-α and IL-17 have been observed.
Conclusion
The anti-inflammatory effect of LXA4 maintains the regenerative capacity of liver during fibrosis in an experimental liver fibrosis model. LXA4 may be therapeutically beneficial in liver fibrosis.
Keywords: Lipoxin A4, liver fibrosis, immune response, MKK4, MKK7, ATF2
INTRODUCTION
Liver fibrosis is a common worldwide health problem which has significant morbidity and mortality rates (1,2). Chronic hepatitis C infection and alcoholic and non-alcoholic steatohepatitis are among the main causes of liver fibrosis. Parasite infections, excessive iron and copper loading, biliary obstruction, and overdose of drugs may be considered as other causes of liver fibrosis (3). Due to its extraordinary self-renewal capacity, fibrosis slowly progresses in the vast majority of patients. If fibrosis is not treated, cirrhosis associated with organ shrinkage and nodule formation can occur, resulting in organ failure and death (1).
Fibrosis is a result of chronic liver damage resulting from excessive accumulation of various extracellular proteins, especially type I collagen. In later periods of fibrosis, liver contains six times more extracellular proteins including collagens (I, III, and IV), fibronectin, undulin, elastin, laminin, hyaluronan, and proteoglycans. Excessive accumulation of these extracellular proteins results in a patho-physiological damage that disrupts the normal structure of the liver (4–6). The primary cell types responsible for accumulation of extracellular proteins following fibrotic stimulation are active hepatic stellate (Hepatic Stellate Cell, HSC) and Kupffer cells. There are strong evidences that lipid peroxidation and reactive oxygen species also play a key role in the initiation and development of fibrosis. Furthermore, immune system cells such as lymphocytes and polymorphonuclear cells migrating to the region activate HSCs for more collagen release. Active HSCs secrete inflammatory chemokines, state cell adhesion molecules, and regulate the activation of lymphocytes. Thus, a vicious cycle of mutual stimulation between inflammatory and fibrogenic cells arises (7–9).
Today, there are several anti-fibrotic drugs used in the standard treatment of liver fibrosis. However, the use of these drugs is limited because some of them are not effective enough on active HSCs, some are specific for only one product of fibrotic reaction, and some have adverse side effects. In order to be a therapeutic agent against fibrosis; an agent should be specific to liver, easily tolerated in long-term applications, and should effectively reduce the inflammatory process and excess collagen accumulation without affecting the extracellular matrix protein synthesis (10–12).
Lipoxin A4 (LXA4) is biosynthesized from the metabolism of arachidonic acid and the major physiological lipoxin is formed in the mammalian system during inflammation. LXA4 not only regulates the cellular activities of leukocytes by binding to a specific G-protein receptor, but also activates gene transcription, directly regulating the intracellular enzyme activity. It is known that LXA4 plays a role in the interaction between different cell types such as neutrophil-endothelial cells or neutrophil-platelets. In addition, it is also thought that LXA4 works as an endogenous “braking signal” in inflammation. LXA4 reduces the activation status of neutrophils and reduces the release of proinflammatory cytokines in different models of inflammation. More than that, it activates monocyte migration into the inflammatory tissue and regulates the inflammatory response process by blocking the survival signal to support neutrophil apoptosis (13,14).
In this study, we investigated histological, immunological, and ultrastructural effects of parenteral administration of LXA4 on liver fibrosis. In addition, the capacity of renewal of liver cells after treatment was detected by investigating expression levels of MKK4 and related genes ATF2 and MKK7 in liver tissue.
MATERIALS AND METHODS
Reagents and mediums
Formaldehyde (Merck), ethanol (Sigma), xylene (Merck), and paraffin were used in routine tissue follow-up for histological examination. For histological evaluation; hematoxylin (Merck), eosin Y (Merck), glacial acetic acid (Merck), phosphotungstic acid (Merck), light green, Bouin fixative solution, 0.5% periodic acid (Merck), 1N hydrochloric acid, Coleman Schiff’s solution (1.0 g basic fuchsin, 200 mL of distilled water, 2.0 g potassium metabisulphite, 10 mL of 1N hydrochloric acid, and 0.5 g of active carbon) were used.
Animals and establishment of experimental liver fibrosis
For experimental animal studies, male BALB/c mice 5–6 weeks of age were used. Experimental animal studies started with the permission from the İnönü University Experimental Animal Production and Research Center (Ethics Committee Permission No: 2014/A-15) and the studies were carried out in accordance with ethical rules of practices of the center.
Experimental design
Liver fibrosis was induced by intraperitoneal administration of thioacetamide (TAA) (15). TAA was dissolved in a phosphate buffer solution (150 mM NaCl, 30 mM KCl, 15 mM Na2HPO4, 2 mM KH2PO4, pH 7.4) (PBS, Sigma-Aldrich) before being injected to animals. TAA at a concentration of 100 mg/kg was administered intraperitoneally three days a week for 12 weeks. Experimental groups and the number of experimental animals in each group were determined as follows. The healthy animal group consisted of 10 animals. TAA and the liver fibrosis group consisted of 10 animals (represented as TAA). Only LXA4 administered group consisted of 10 animals (represented as LXA4), and liver fibrosis induced and LXA4 administered group consisted of 10 animals (indicated as TAA+LXA4). For a group other than these groups, phosphate salt buffer solution, which is used to prepare the solutions, was given to healthy animals. Only biochemical and histological parameters were examined on this group. LXA4 was prepared at 5 μg/kg concentration by diluting 5 (S), 6 (R), 15 (R)-trihydroxy-7E, 9E, 11Z, 13E-eicosatetraenoic acid (15-Epi-LXA4) in ice-cold PBS. LXA4 was administered at 0.5 μg/0.1 mL/mouse (16,17) every two days in a week for 2 weeks, intarperitoneally. Because chronic fibrosis occurs at the end of 10 weeks, administration of LXA4 was initiated at the last two weeks of fibrosis induction. Hence, TAA injections to experimental mice were continued during LXA4 injection. The experiment was ended the day after the last injection of LXA4.
Macroscopic and biochemical evaluations of liver
Liver weight/body weight ratio, liver macroscopic view, serum alanine transferase (ALT), AST, and AP level analyzes were performed. ALT, AST, and AP levels in serum samples were studied in an automated system (Abbot Architect C8000) with quantitative tests. Normal range levels of ALT, AST, and AP in mice are 15–77 U/L, 54-298 U/L, and 35–96 U/L, respectively (18,19).
Microscopic evaluations
In order to determine the histological damage and its level, liver sections were fixed in 10% neutral buffered formalin and sections of tissues were sliced in 5 μm size using a microtome (Leica RM2145) from paraffin blocks. Following that, samples were stained with Mayer’s H & E method. The formation of connective and supporting tissues was performed by Gomori’s one-step trichrome staining method.
Sections were examined by a blind researcher on a light microscope (Leica DFC280) and imaged on an image analysis system (Leica QWin). The Knodell scoring system, which is frequently used in liver fibrosis, was followed for numerical analysis of injury, inflammation level, and regeneration (20). Accordingly, the main criteria of evaluation were divided into fragmented necrosis, intralobular degeneration, portal inflammation, and fibrosis main titles. For fragmented necrosis in these main titles, rating scale was none (0 points), light (1 point), medium severity (3 points), significant (4 points), medium severity and bridge necrosis (5 points), significant and bridge necrosis (6 points), and multi-lobe necrosis (10 points). For intralobular degeneration, the rating scale was none (0 points), mild (1 point), moderate (3 points), and significant (4 points). For portal inflammation, the rating scale was none (0 points), mild (1 point), moderate (3 points), and significant (4 points). For fibrosis, the rating scale was none (0 points), portal-distributed fibrosis (1 point), bridging fibrosis (3 points), and significant (4 points). Histological points were the sum of the four assessments listed above.
Ultrastructural analysis
For electron microscopic evaluation, the liver samples at 2 mm3 volume were fixed in 2.5% glutaraldehyde for 3 h buffered with 0.1 M NaH2PO4+NaHPO4 (pH 7.2–7.4), post-fixed in 1% osmium tetroxide (OsO4) for 2 h, and embedded in Araldite CY 212. Ultrathin sections (80 nm) were contrasted with uranyl acetate and lead citrate and examined using a Zeiss Libra 120 (Carl Zeiss NTS GmBH., Oberkochen, Germany) transmission electron microscope.
Liver homogenate preparation
Liver homogenates were prepared by mehanical distruption of 100 mg weighted liver for each sample after digestion in collagenase IV (500 CDU/mL) (Sigma, St. Louis, MO, USA) in a Krebs-Ringer bicarbonate buffer containing 1% Triton-X-100. The homogenates were incubtaed for 12 h in an incubator at 37 °C with 5% CO2. Following that, homogenates were centrifuged and supernatants were analyzed for cytokine levels. Cytokine levels were presented as pg/100 mg.
Enzyme Linked Immunosorbent Assay (ELISA)
Th1 [interferon gamma (IFN-α), interleukin-2 (IL-2), tumor necrosis factor-alpha (TNF-α)], Th2 [interleukin-4 (IL-4) and interleukin-10 (IL-10)], and Th17 [interleukin-17 (IL-17)] cytokine analyses were performed by ELISA according to manufacturer’s instructions (ebioscience, Austria).
Gene expression analysis
Recently, Wuestefeld et al. identified dual specific kinase MKK4 as a master regulator of liver regeneration and described the relationship between MKK4 and related genes MKK7 and ATF2 (21). Based on that, we investigated the level of liver regeneration in our study. Total RNA was extracted from mouse liver tissues using an RNeasy Plus Mini kit (Qiagen, Germany). RNA presence and quality were assessed using a nanodrop device (Maestro NanoDrop; Taiwan). RNA isolations were repeated according to RNA/DNA ratios. In order to obtain cDNA, an RT2 HT First Strand Kit was used according to manufacturer’s instructions (Qiagen, Germany). The cDNAs obtained at the end of that process were stored at −20 °C until usage for real-time polymerase chain reaction (RT-PCR) assay. The RT-PCR assay was performed using an RT2 SYBR Green qPCR Mastermix (Qiagen, Germany) according to manufacturer’s instructions. Briefly, for each gene (ATF2, Map2k4, Map2k7, TGF-B, and GAPDH), PCR mix was prepared. For each sample, 12.5 μL RT2 SYBR Green Mastermix, 6.5 μL RNase free water, 1 μL RT2qPCR primer were pipetted. Following that, 5 μL cDNA for each gene was added to this mixture. RT-PCR conditions were determined as 95°C for 10 minutes (1 cycle), 40 cycles of 15 s at 95°C, and 30 s at 60°C in a RotorGene.
RNA samples were visualized using 1% agarose gel before and after heating the samples at 70°C to eliminate the artifical genomic structure. PCR products were visualized on a 2% agarose gel. A 100 bp standard DNA sample and 15 μL of PCR product with 3 μL of 6× loading dye for each gene were mixed and run on a 2% agarose gel for 30 minutes at 100 volts. Gel images were obtained and recorded on a KODAK Gel Logic 2200 Imaging System gel imaging device.
Statistical analysis
Statistical analyses of data were peformed by using a two-tailed Mann-Whitney U test. We performed those analyses by using the Statistical Package for Social Sciecnes (SPSS) 10.0 software program (SPSS Inc.; Chicago, IL, USA). The level of significance was set as p<0.05.
RESULTS
In our study, an experimental liver fibrosis model was established by intraperitoneal (i.p) administration of TAA in mice. By using this model, the effect of LXA4, an anti-inflammatory lipid intermediate product, on immune response and liver regeneration was investigated. We formed five different groups, according to our purpose. The groups along with their abbreviations are: healthy group-naive-; liver fibrosis induced group-TAA; liver fibrosis group, 5 μg/kg LXA4 injected group (i.p)-TAA+LXA4−, 5 μg/kg LXA4 injected healthy animals group (i.p)-LXA4−. In addition to these groups, a group was created in which the phosphate buffer solution used for the dilution of both TAA and LXA4 was injected i.p.
Body weight/liver weight ratio was analyzed for each group. ALT, AST, AP, Th1/Th2, and Th17 cytokine levels were investigated in serum samples and liver homogenates. Expression levels of genes responsible for liver regeneration were investigated. Histological and ultrastructural examinations were also established for each sample.
Body weight/liver weight and biochemical analysis
Development of liver fibrosis by TAA administration caused a significant reduction on body weight/liver weight ratio in TAA subjects compared to the control naive group. However, administration of LXA4 to fibrotic mice did not cause a significant elevation (Table 1).
Table 1.
Structural and functional impairments are evaluated by analyzing Body Weight/Liver Weight ratio and ALT, AST, AP levels in serum samples of experimental liver fibrosis models. Body/Weight ratio of mice and ALT, AST and AP enzyme levels in serum samples were presented for healthy group (naïve); only Lipoxin A4-administered group (LXA4); following thioacetamide administration 3 via i.p route 3 days a week for 12 weeks in the liver fibrosis group (TAA), lipoxin A4 administered in a fibrotic mice group (TAA+LXA4) and healthy animals administered PBS (naïve+PBS) used for Lipoxin A4 dilution.
| Group | Body Weight/Liver Weight | ALT (U/L) (15–84 U/L)¶ | AST(U/L) (54–298 U/L)¶ | AP (U/L) (35–96 U/L)¶ |
|---|---|---|---|---|
| Naive | 20.271±1.34 | 29.40±8.58 | 139.80±29.32 | 33.18±7.62 |
| LXA4 | 18.869±2.36 | 36.60±12.45 | 109.20±14.26 | 87.12±9.48 |
| TAA | 15.916±1.73* | 255.56±71.04# | 247.87±33.38ŧ | 151.95±14.44$ |
| TAA+LXA4 | 16.263±3.44 | 77.40±13.74 | 169.50±14.13 | 132.93±17.57 |
| Naive+PBS | 21.476±2.13 | 26.22±3.84 | 128.31±18.56 | 42.15±5.58 |
symbolize significant differences between the TAA and TAA+LXA4 group (p<0.05 for both evaluation).
symbolizes significant difference between the naive group and TAA group (p<0.05).
Normal range of AST, ALT, and AP in serum of BALB/c mice (18).
ALT, AST, and AP, which are markers related to liver function, were significantly increased in the TAA group compared to the naive group. LXA4 administration to the fibrosis group significantly reduced ALT and AST levels (Table 1).
Histological evaluation
Hematoxylin-eosin staining was used to determine the level of inflammation and fibrosis during histological evaluation of liver tissues (Figure 1a–h). Glycogen storage status of liver, the distribution of cytoplasmic inclusions, and the presence of seroid pigment in liver cells were determined by Periodic Acid Schiff (PAS) staining (Figure 2a, c, e, g).The presence of connective tissue associated with the formation of fibrosis was determined by Gomori’s trichrome staining method (Figure 2b, d, f, h).
Figure 1.
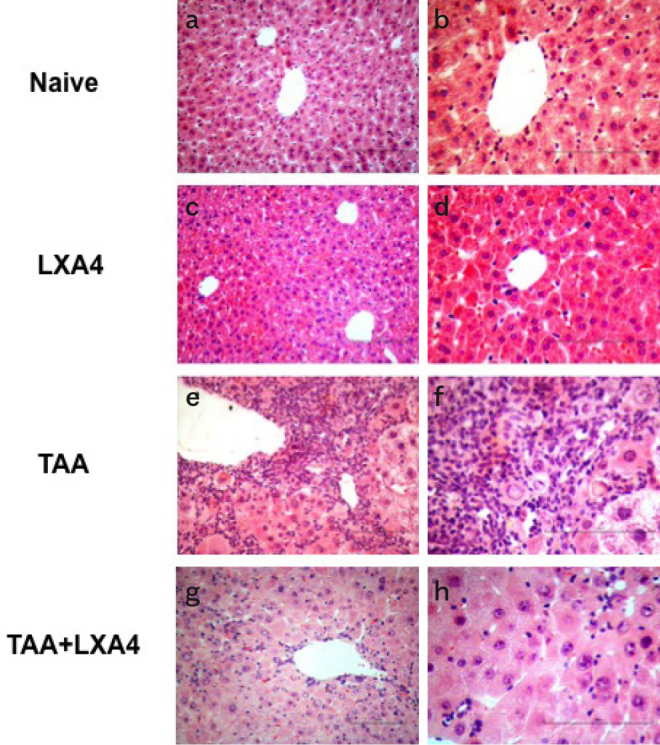
a–h. The effect of LXA4 on mononuclear cell infiltration and inflammation induced by fibrosis in the liver was analyzed according to H&E staining. Figure shows representative histologic views of liver samples for each group named as naïve (a, b), only LXA4 administered group (c, d), fibrosis group (e, f), and LXA4 administered fibrosis group (g, h). a, c, e, g, were at 20× and b, d, f, h were at 40× magnifications.
Figure 2.
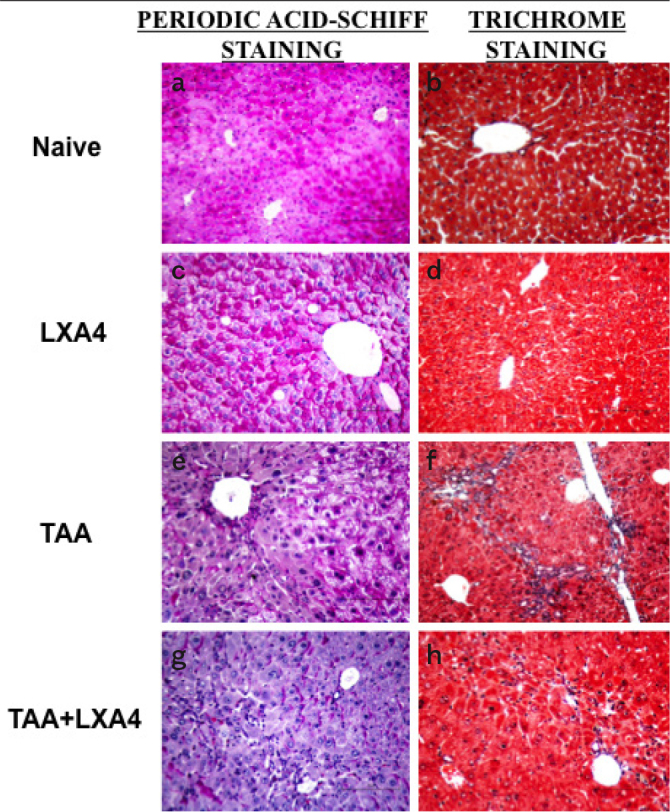
a–h. The distribution of glycogen storage status in liver cells and the presence of seroid pigment in hepatocytes have been determined by Periodic Acid Schiff (PAS) staining (a, c, e, g). The formation of connective and supporting tissues associated with the formation of fibrosis has been determined by Gomori’s Trichrom staining (b, d, f, h). Figures show representative histologic views of naïve ((a, b), only LXA4-administered group, LXA4 (c, d); liver fibrosis group, TAA (e, f) and LXA4administered fibrotic mice, TAA+LXA4 (g, h).
Histological quantitative evaluation was performed by Knodell scoring. Accordingly, liver fibrosis induced by TAA caused significant erosive necrosis, inflammation, lobular necrosis, and fibrosis. LXA4 administration to fibrotic mice caused a significant reduction in inflammation, erosional necrosis, lobular necrosis, and fibrosis parameters compared to the TAA group. In total evaluation, LXA4 injection to TAA-induced fibrotic mice marked significant improvement in liver histology (Table 2).
Table 2.
Quantitative analysis of histological evaluation of liver tissue after Knodell scoring. The values indicate the mean±standard error of the analysis results obtained from all subjects.
| Groups | Pathologic Parameters | Total | |||
|---|---|---|---|---|---|
|
| |||||
| Erosion and Necrosis | Lobular Degeneration and Focal Necrosis | Fibrosis | Inflammation | ||
| Naive | 0.0±0.0 | 0.1±0.1 | 0.0±0.0 | 0.2±0.15 | 0.3/53 |
| LXA4 | 0.0±0.0 | 0.2±0.13 | 0.0±0.0 | 0.3±0.13 | 0.5/53 |
| TAA | 4.7±0.77# | 2.3±0.36# | 2.4±0.30# | 2.7±0.30# | 12.1/53# |
| TAA+LXA4 | 1.9±0.48 | 0.7±0.15 | 1.0±0.26 | 1.4±0.26 | 5/53 |
symbolizes significant differences between the TAA group and TAA+LXA4 groups (p<0,05).
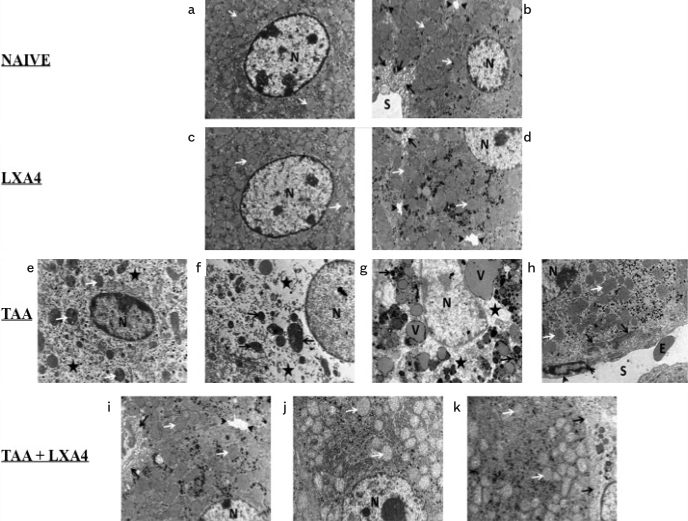
Ultrastructural examinations on liver tissues demostrate intense collagen fibril deposition in Disse space and vacuolization and severe intracellular edema in the fibrosis group. Treatment with LXA4 caused an improvement in those parameters (Figure 3a–k).
Figure 3.
a–k. Ultrastructural views of liver tissues in naïve (a, b); only LXA4-administered, LXA4 (c, d); liver fibrosis group, TAA (e, f, g, h), and LXA4-administered fibrotic mice, TAA+LXA4 (i, j, k) groups. Scale bars represent 2 mm in all figures. Figure 3a, nucleus of hepatocyte (n), mitochondria (arrow). Figure 3b, nucleus of hepatocyte (N), mitochondria (white arrow), sinusoid (S), space of Disse (black arrow), and bile canaliculi (arrow head). In Figure 3c, nucleus of hepatocyte (N), mitochondria (arrow). In Figure 3d, nucleus of hepatocyte (N), mitochondria (white arrow), space of Disse (black arrow), bile canaliculi (arrow head). Figure 3e, nucleus of hepatocyte (N), mitochondria (white arrow), intracellular edema (aster). In Figure 3f, nucleus of hepatocyte (N), mitochondria (arrow), intracellular edema (aster). In Figure 3g, nucleus of hepatocyte (N), intracellular edema (aster), intracellular vacuole (V), and electron-dense granules (arrow). In Figure 3h, nucleus of hepatocyte (N), mitochondria (white arrow), collagen fibrils in space of Disse (black arrow), sinusoid (S), sinusoidal endothelial cells (arrow head), and erythrocyte (E). In Figure 3i, nucleus of hepatocyte (N), mitochondria (white arrow), space of Disse (black arrow), bile canaliculi (arrow head). Figure 3j, nucleus of hepatocyte (N), mitochondria (arrow). Figure 3k, TAA+lipoxin: Nucleus of hepatocyte (N), mitochondria (white arrow), space of Disse (black arrow).
Inflammatory and anti-inflammatory cytokine levels
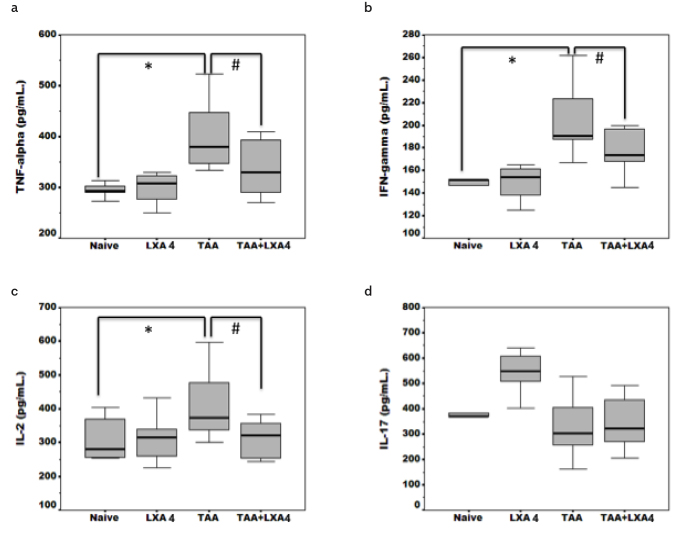
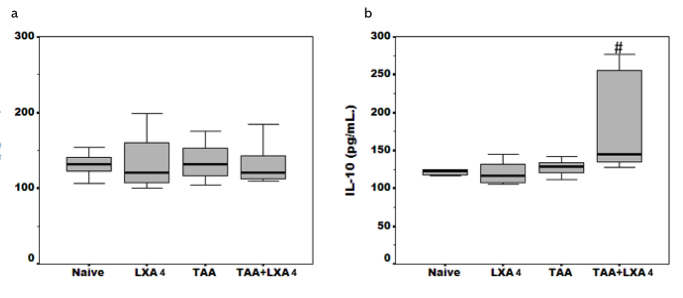
Inflammatory (TNF-α,, IFN-g,, IL-2, IL-17) and anti-inflammatory cytokine (IL-4, IL-10) levels were detected in serum samples (Figure 4, 5) and liver homogenates (Figure 6) by ELISA. Serum TNF-α, IFN-g, and IL-2 levels were significantly elevated during fibrosis (Figure 4a–c). Interestingly, we did not observe an alteration on IL-17, the cytokine secreted by Th17 subgroup, during fibrosis (Figure 4d). There were no significant differences in IL-4 and IL-10 levels, cytokines directing anti-inflammatory response, between the fibrosis group and the healthy group (Figure 5a, b). LXA4 administration during fibrosis caused a significant reduction in levels of TNF-α, IFN-g, and IL-2. The most interesting result at this stage was observed in IL-10 cytokine level analysis. In the TAA+LXA group, IL-10 was signficiantly higher than in the fibrosis group. Additionally, injection of LXA4 into healthy subjects did not alter IL-10 levels (Figure 5b).
Figure 4.
a–d. Inflammatory cytokine (TNF-α, IFN-g, IL-2, IL-17) (4a–4d) levels in serum samples of animals in each group. The data represent the mean±SD for five animals in two separate experiments.
*symbol represents significant difference between the naïve and TAA group in existing figures. #symbol represents significant difference between the TAA and TAA+ LXA4 group in existing figures.
p<0.01 for IFN-g between the naïve and TAA group.
Figure 5. a, b.
Anti-inflammatory cytokine (IL-4 and IL-10) (5a, 5b) levels in serum samples of animals in each group. The data represent the mean±SD for five animals in two separate experiments.
#symbol represents significant difference between the TAA group and TAA+LXA4 group. p=0.032 for IL-10 between the TAA and TAA+LXA4 group.
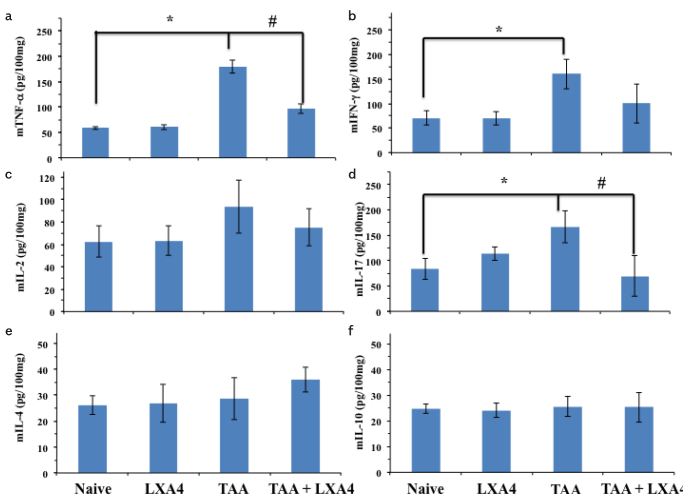
Figure 6. a–f.
Inflammatory (6A–6D) and anti-inflammatory (6E, 6F) cytokine (TNF-α, IFN-g, IL-2, IL-17 and IL-4, IL-10, respectively) levels in liver homogenates of animals in each group. The data represent the mean±SD of five animals in two separate experiments.
*symbol represents significant difference between the naive group and TAA group where it exists.
#symbol represents significant difference between the TAA and TAA+LXA4 group.
p=0.017 for mTNF-a between the naïve and TAA group, p=0.021 for mIFN-g between the naïve and TAA group, p=0.024 for mIL-17 between the naïve and TAA group, p=0.037 for mIL-17 between the TAA and TAA+LXA4 group.
In case of cytokine levels in liver homogenates, we observed a completely different cytokine network in comparison to serum samples. While the TNF-α level significantly decreased in the LXA+TAA group, that level was still significantly high in comparison to the naive group (Figure 6a). TAA-induced an elevation on IL-17 level in liver; however, LXA4 administration reduced that elevation significantly (Figure 6d). Interestingly, we did not observe significant elevation on anti-inflammatory cytokines IL-4 and IL-10 in comparison to other groups (Figure 6e, f).
Expression levels of genes responsible for degeneration and regeneration in liver fibrosis
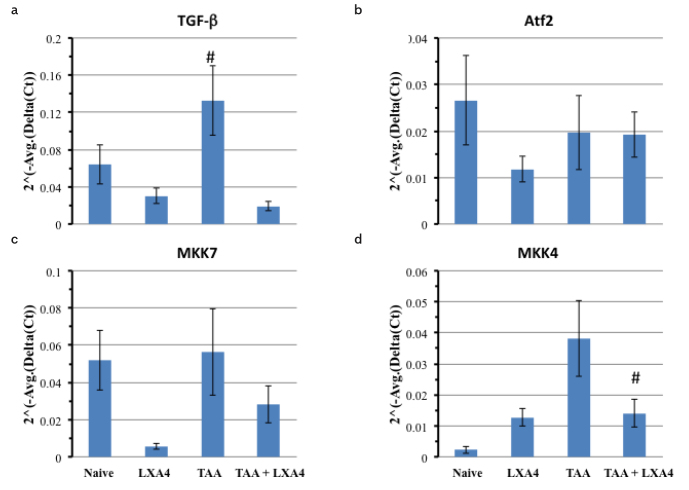
After RNA isolation, samples were run in 1% agarose gel to visualize 28S and 18S RNA in isolates (Supplemental Figure 1). Properties of primers used in the RT-PCR procedure for TGF-b, MKK4, and MKK7 are provided in Table 3. Products of RT-PCR were also run in 2% agarose gel to visualize the specific bands (Supplemental Figure 1). Transforming growth factor-beta (TGF-α) plays a pivotal role in the sequence of events leading to end stage chronic liver diseases. Liver fibrosis caused an elevation on TGF-α expression in liver in comparison to the naïve group. The TGF-α expression level was significantly lower than in liver of fibrotic mice (Figure 7a).
Table 3.
Properties of primers for target and house-keeping genes.
| Gene | Reference segment number | Reference position | Band size (bp) |
|---|---|---|---|
| Tgfb1; Transforming growth factor, beta 1 | NM_011577.1 | 1526 | 63 |
| ATF2; Activating transcription factor 2 | NM_009715.3 | 3556 | 92 |
| Map2k7; Mitogen-activated protein kinase kinase 7 | NM_011944.3 | 539 | 93 |
| Map2k4; Mitogen-activated protein kinase kinase 4 | NM_009157.4 | 1019 | 89 |
| Gapdh; Glyceraldehyde 3-phosphate dehydrogenase | NM_008084.2 | 309 | 140 |
Figure 7. a–d.
Expression levels of genes (ATF2, MKK7, MKK4) responsible for regeneration of hepatocytes and expression level of TGF-α gene that elevates during fibrosis in liver. As TGF-α expression level elevates during fibrosis, we used that gene as a positive control to show the fibrosis at the molecular level. The data represent the mean±SD of 2^ (−Avg.(Delta(Ct)) values in two separate experiments.
*symbol represents the significant elevation of TGF-α in the TAA group in comparison to the TAA+LXA4 group.
#symbol represents the significant reduction at MKK4 expression level in the TAA+LXA4 group in comparison to the TAA group.
We did not observe a significant alteration on ATF2 and MKK7 expression during fibrosis in comparison to the naïve group. The most prominent data was observed on MKK4 expressions in the LXA4+TAA group in comparison to fibrotic mice. However, MKK4 expression was still significantly higher in the LXA4+TAA group than in the control group (Figure 7b–d).
DISCUSSION
In our project, we investigated the therapeutic effect of LXA4, a lipid intermediate, on liver fibrosis in mean of histological, molecular, and immunological parameters. The level of liver tissue injuries, biochemical parameters that inform about liver function, the levels of cytokines which direct inflammatory and anti-inflammatory responses in the systemic circulation, expression levels of the genes responsible for liver cell degeneration and regeneration were analyzed.
The TAA model is often used to form chronic liver fibrosis in experimental animals. Pathologic similarities between TAA fibrosis formation in rodents and human liver fibrosis are widely observed in liver. In this sense, it is stated that there is more validity and ease of use than the models applied by using other chemicals (22,23). Therefore, the TAA liver fibrosis model that we used throughout our study is both ethical and scientifically appropriate, to make the data obtained from our study more valuable.
In our study, we have demonstrated that LXA4 administration reduced mononuclear cell infiltration in TAA-induced liver fibrosis, significantly decreasing degeneration and necrotic formation, but that effect could not be reduced in the healthy control level. Zhang et al. (24) investigated the effect of LXA4 receptor agonist BML-111 on liver during CCl4 induced fibrosis. They observed that BML-111 administration histologically reduced hepatic necrosis and inflammation in the liver in both preventive and protective aproaches. Additionally, they observed that preventive use of BML-111 was more effective than the protective one in healing the inflammation histologically in liver.
Many enzymes are present in the liver, those which are primarily present at a high concentration in the circulation during liver fibrosis and are routinely used in diagnosis. In general, two types of liver specific enzymes are measured in the serum. The first ones are those elevated during increased permability and/or necrosis and the second ones are those elevated during cholestasis. In our experiment, we measured ALT, which is particularly useful in measuring hepatic necrosis for small animals, AST, and AP which is one of a number of cholestatic enzymes (25). We observed elevation of three enzymes during fibrosis in serum samples. After LXA4 treatment, we detected significant reduction in only ALT and AST levels; the AP level was higher than normal range values for mice. Despite treatment with LXA4, maintenance of serum AP levels may be related to an intrahepatic biliary obstruction or transport defects.
We did not observe a significant elevation on anti-inflammatory cytokine levels in contrast to results of systemic circulation. Alteration on the level of IL-17 in serum and liver tissue can be explained by accumulation of IL-17 producing cell resources, especially Th17 cells and IL-17 producing non-immune cells such as biliary epithelial cells, to enhance and sustain Th17 type response in the liver (26). Recently, in our laboratory we observed that regulatory immune response in spleen acting by expansion of Treg and Breg cells during chronic fibrosis in the liver. That is probably to modulate the inflammatory immune response in liver (27). Elevation of IL-10 but not IL-4, because its production is controlled by IFN-g secretion, can be explained by the expansion of those Treg cells in spleen. The inflammatory cytokine view in liver homogenates can also be related with the alteration on MKK7 expression level because MKK7 may be required for polarized differentiation of Th cells into Th1 lineage (28).
It is known that lipoxins have potent anti-inflammatory properties in many inflammatory disorders such as nephritis, inflammatory bowel diseases, and arthritis. They show that effect by inhbiting leukotriene function, leukocyte migration, natural killer cell function, tumor necrosis factor induced production of chemokines, expression of chemokine receptors and adhesion molecules and pathogen induced IL-12 production (29–31). However, there is still a conflict about the anti-inflamamtory mechanism of LXA4. Although a group of scientists role that effect on antigen presenting cells, another group explains that as a switch of Th1 response to Th2 by the help of IL-10. Machado et al. has observed that LXA4 shows its anti-inflammatory effect by inducing expression of suppressor of cytokine signaling (SOCS)-2 molecule which is expressed in dendrtitic cells (DC). They observed that SOCS-2 deficient DCs are hyperresponsive to microbial stimuli and durable to inhibitory actions of LXA4 (32). In parallel to Machado’s observation, Posselt et al. determined that SOCS-2 deficient DCs highly express IL-1α and IL-10 (33). Lia et al. (34) investigated the role of LXA4 in prevention of acute rejection. They observed that LXA4 attenuates acute rejection by shifting Th1/Th2 cytokine balance and concerning that they detected significant elevation on IL-10 expression and IL-10 level in serum samples of LXA4 injected liver transplanted rats.
The c-Jun NH2-terminal protein kinases (JNK) also called as stress activated protein kinases are members of mitogen-activated protein kinase (MAPK) family, which function on regulation of a wide range of cellular functions. JNKs are activated by activation of protein kinases that include two dual specificty MAP kinase kinases (MKK4 and MKK7). Activation of MKK4 and MKK7 after phosphorylation by MKKKs, then results in the activation of JNK by dual phosphorylation. MKK7 is a specific activator of JNKs, whereas MKK4 phosphorylates both JNK and p38 MAPKs. Both mechanisms may operate in parallel to allow diferent types of responses for the same MAPK signaling pathway (28). Recently, Wuestefeld et al. have proved that MKK4, MKK7, ATF2, JNK1, and ELK1 are the key transcription factors that play a role in liver regeneration. They showed that stimulation of MKK7, ATF2, and ELK1 transcription factors and inhibition of MKK4 are effective on hepatocyte regeneration in an experimental fibrosis model (21). They had reached that result both by depleting and by causing deficiency on the MKK4 gene. Their data indicate that MKK4 deficiency alone is not sufficient to cause hepatocyte proliferation since another compensatory molecule “MKK7” activation causes signaling on JNK. In our study, we observed significant reduction on MKK4 expression in LXA4 treated fibrotic liver in comparsion to the fibrotic group That reduction was probably caused by anti-inflammatory features of LXA4, especially inhibiton of chemokine receptor expression and leukocyte infiltration. MKK7 and MKK4 have several downstream target transcription factors activating transcription factor 2 (ATF2) and Elk1 are the ones shared by both MKK signaling pathways. Activated ATF2 complexes stimulate the transcription of various genes, playing a role in imflammation such as cell adhesion molecules, proinflammatory cytokines, and chemokines. We observed no change on the expression levels of ATF2 between groups. These results lead to two different questions. First one is “why is the ATF2 expression not changing when there is an increase in the MKK4 expression during fibrosis?”, and the second one is “if there is no change in ATF2 expression during fibrosis, what could be the soruce of the proinflammatory cytokines increase” in the liver? Although we do not have evidences to prove our answers, we think there is an independent regulatory mechanism active on p38. However, Mendelson et al. has mentioned a selective down regulation mechanism by dephosphorylation following oxidative stress in the liver. They observed that MKP-1, which has high affinity for phosphorylated p38 as a substrate, dephosphorylates p38 (35). If that is the case, other downstream targets ELK-1 or c-jun may be activated during fibrosis. Furthermore, expression of ATF2 can be downregulated by tissue specific miRNAs in which Lv et al. has demosntrated that microRNA-451 targets ATF2 and inhibits the expression (36). MKK4 and MKK7 activity is increased following phosphorylation at Ser and Thr residues within a Ser-Xaa-Ala-Lys-Thr motif in the activation loop by multiple MKKKs, including MEKK1–4, apoptosis signal-regulated kinases (Ask1), and TGF-α activated kinase 1 (TAK1). MEKK1 can phosphorylate both MKK4 and MKK7, whereas MEKK4 is a specific activator for MEKK4 (35). Although we observed non-significant reduction on the MKK7 expresion level in the TAA+LXA4 group, in order to understand whether or not MKK7 is activated alone, investigating the phosphorylation status would be beneficial for future studies.
Despite the data shown in this study, some limitations should be addressed. First, in the model used in this study, inflammation in the liver was determined by macroscopic, histological observations and also expression level of TGF-α at the molecular level. However, we did not investigate the HSCs and Kupffer cells at the molecular level. Second, As LXA4 is a natural metabolic product, it is also synthesized in its natural arachidonic acid metabolism. Because of that investigating the LXA4 levels in serum and liver would be supportive data to understand the direct effect. Concerning that we only measured serum LXA4 levels in each group. We observed only significant elevation on the TAA group in comparison to naïve, and LXA4 treated groups (data not shown).
Further investigation is needed to fully elucidate the effects and therapeutic potential of LXA4 toward chronic liver fibrosis. Overall, the results of this study suggest that, LXA4 exerts therapeutic effect during liver fibrosis by reducing infiltration of mononuclear cells in the liver and inflammatory cytokines not only in systemic circulation but also in liver. We also showed that LXA4 elevates the regenerative capacity of liver by reducing MKK4 expression.
Supplementary Material
RNA samples were run in 1% agarose gel to identify 28S and 18S RNA bands (A). 100 bp DNA ladder (A), RNA sample w/o heating (B), and RNA sample heated at 70 °C for 1 minute (C). After RT-PCR, PCR products were run in 2% agarose gel with a 100 bp DNA ladder. Column A1 and A2 represent 100 bp DNA ladder, B1 and B2; ATF2 (92bp), C1 and C2; MKK4 (89) bp), D1 and D2; MKK7 (93 bp), E1 and E2; TGF-α1 (63 bp), F1 and F2; GAPDH (140 bp).
Footnotes
Ethics Committee Approval: Ethics committee approval was received from the İnönü University Experimental Animal Production and Research Center (Decision No: 2014/A-15).
Informed Consent: N/A.
Peer-review: Externally peer-reviewed.
Author Contributions: Concept - B.K.; Design - B.K., E.L.K., M.G.; Supervision - B.K., S.Y., Burçak K., M.A.K., E.Y.; Resources - B.K., S.Y., E.Y.; Materials - B.K., E.L.K., M.G., Z.M.K., Data Collection and/or Processing - B.K., E.L.K., Z.M.K., M.G.; Analysis and/or Interpretation - B.K., E.L.K., S.Y., Burçak K., M.A.K., M.G., E.Y.; Literature Search - E.L.K., Burçak K., M.A.K., S.Y.; Writing Manuscript - B.K., E.L.K., M.G.; Critical Review - Burçak K., M.A.K., S.Y., E.Y.
Conflict of Interest: The authors have no conflict of interest to declare.
Financial Disclosure: The Scientific and Technological Research Council of Turkey (TUBİTAK) has supported this project (Project Number: 114S161).
REFERENCES
- 1.Henderson NC, Iredale JP. Liver fibrosis: Cellular mechanism of progression and resolution. Clin Sci. 2007;112:265–80. doi: 10.1042/CS20060242. [DOI] [PubMed] [Google Scholar]
- 2.Parsons CJ, Takashima M, Rippe RA. Molecular mechanisms of hepatic fibrogenesis. J Gastroenterol Hepatol. 2007;22(S1):S79–S84. doi: 10.1111/j.1440-1746.2006.04659.x. [DOI] [PubMed] [Google Scholar]
- 3.Bataller R, Brenner DA. Liver fibrosis. J Clin Invest. 2005;115:209–18. doi: 10.1172/JCI200524282C1. [DOI] [PMC free article] [PubMed] [Google Scholar]
- 4.Lee UE, Friedman SL. Mechanisms of hepatic fibrogenesis. Best Pract Res Clin Gastroenterol. 2011;25:195–206. doi: 10.1016/j.bpg.2011.02.005. [DOI] [PMC free article] [PubMed] [Google Scholar]
- 5.Arias IM. The Liver: Biology and pathobiology. New York: Raven Press; 1982. [Google Scholar]
- 6.Malhi H, Gores GJ. Cellular and molecular mechanisms of liver injury. Gastroenterology. 2008;134:1641–54. doi: 10.1053/j.gastro.2008.03.002. [DOI] [PMC free article] [PubMed] [Google Scholar]
- 7.Li D, Friedman SL. Liver fibrogenesis and the role of hepatic stellate cells: new insights and prospects for therapy. J Gastroenterol Hepatol. 1999;14:618–33. doi: 10.1046/j.1440-1746.1999.01928.x. [DOI] [PubMed] [Google Scholar]
- 8.Xu R, Zhang Z, Wang FS. Liver fibrosis: mechansims of immune-mediated liver injury. Cell Mol Immunol. 2012;9:296–301. doi: 10.1038/cmi.2011.53. [DOI] [PMC free article] [PubMed] [Google Scholar]
- 9.Hernandez-Gea V, Friedman SL. Pathogenesis of liver fibrosis. Annu Rev Pathol. 2011;6:425–56. doi: 10.1146/annurev-pathol-011110-130246. [DOI] [PubMed] [Google Scholar]
- 10.Satopathy SK, Sakhuja P, Malhotra V, Sharma BC, Sarin SK. Beneficial effects of pentoxifylline on hepatic steatosis, fibrosis and necroinflammation in patients with non-alcoholic steatohepatitis. J Gastroeterol Hepatol. 2007;22:634–8. doi: 10.1111/j.1440-1746.2006.04756.x. [DOI] [PubMed] [Google Scholar]
- 11.Yamaguchi N, Mezaki Y, Miura M, et al. Antiproliferative and proapoptotic effects of tocopherol and tocol on activated hepatic stellate cells. J Nutr Sci Vitaminol (Tokyo) 2011;57:317–25. doi: 10.3177/jnsv.57.317. [DOI] [PubMed] [Google Scholar]
- 12.Ahmad A, Ahmad R. Understanding the mechanism of hepatic fibrosis and potential therapeutic approaches. Saudi J Gastroenterol. 2012;18:155–67. doi: 10.4103/1319-3767.96445. [DOI] [PMC free article] [PubMed] [Google Scholar]
- 13.Schwab JM, Serhan CN. Lipoxins and new lipid mediators in the resolution of inflammation. Curr Opin Pharmacol. 2006;6:414–20. doi: 10.1016/j.coph.2006.02.006. [DOI] [PubMed] [Google Scholar]
- 14.Serhan CN, Savill J. Resolution of inflammation: the beginning programs the end. Nat Immunol. 2005;6:1191–7. doi: 10.1038/ni1276. [DOI] [PubMed] [Google Scholar]
- 15.Starkel P. Animal models for the study of hepatic fibrosis. Best Prac Res Clin Gastroenterol. 2011;25:319–33. doi: 10.1016/j.bpg.2011.02.004. [DOI] [PubMed] [Google Scholar]
- 16.Souza MC, Pauda TA, Torres ND, et al. Lipoxin A4 attenuates endothelial dysfunction during experimental cerebral malaria. Int Immunopharmacol. 2015;24:400–7. doi: 10.1016/j.intimp.2014.12.033. [DOI] [PubMed] [Google Scholar]
- 17.Xu Z, Zhao F, Lin F, Chen J, Huang Y. Lipoxin A4 Inhibits the Development of Endometriosis in Mice: The Role of Anti-Inflammation and Anti-Angiogenesis. Am J Reprod Immunol. 2012;67:491–7. doi: 10.1111/j.1600-0897.2011.01101.x. [DOI] [PubMed] [Google Scholar]
- 18.Huang WC, Shen JJ, Liou CJ, Kuo ML, Chang YP, Yang RC, Li ML. Enhancing Th1 Cell Activities in Mice by Short-term Oral Administration of Gynostemma pentaphyllum Extracts. Bio Formosa. 2007;42:9–16. [Google Scholar]
- 19.Kaneko JJ. Normal Blood Analyte Values in Small and Some Laboratory Animals. In: Kaneko Jiro J., editor. Clinical Biochemistry of Domestic Animals. Academic Press; San Diego, California: 1989. pp. 892–8. [Google Scholar]
- 20.Goodman ZD. Grading and staging systems for inflammation and fibrosis in chronic liver diseases. J Hepatol. 2007;47:598–607. doi: 10.1016/j.jhep.2007.07.006. [DOI] [PubMed] [Google Scholar]
- 21.Wuestefeld T, Pesic M, Rudalska R, et al. A direct in vivo RNAi screen identifies MKK4 as a key regulator of liver regeneration. Cell. 2013;153:389–401. doi: 10.1016/j.cell.2013.03.026. [DOI] [PubMed] [Google Scholar]
- 22.Jang JH, Kang KJ, Kim YH, Kang YN, Lee IS. Reevaluation of experimental model of hepatic fibrosis induced by hepatotoxic drugs: an easy, applicable, and reproducible model. Transplant Proc. 2008;40:2700–3. doi: 10.1016/j.transproceed.2008.07.040. [DOI] [PubMed] [Google Scholar]
- 23.Hajovsky H, Hu G, Koen Y, et al. Metabolism and toxicity of thioacetamide and thioacetamide S-oxide in rat hepatocytes. Chem Res Toxicol. 2012;25:1955–63. doi: 10.1021/tx3002719. [DOI] [PMC free article] [PubMed] [Google Scholar]
- 24.Zhang L, Wan J, Li H, et al. Protective effects of BML-111, a lipoxin A(4) receptor agonist, on carbon tetrachloride-induced liver injury in mice. Hepatol Res. 2007;37:948–56. doi: 10.1111/j.1872-034X.2007.00154.x. [DOI] [PubMed] [Google Scholar]
- 25.Cornelius CE. Liver Function. In: Kaneko Jiro J., editor. Clinical Biochemistry of Domestic Animals. Academic Press; San Diego, California: 1989. pp. 364–97. [Google Scholar]
- 26.Hammerich L, Heymann F, Tacke F. Role of IL-17 and Th17 Cells in Liver Diseases. Clin Develop Immunol. 2011;2011:1–12. doi: 10.1155/2011/345803. 345803. [DOI] [PMC free article] [PubMed] [Google Scholar]
- 27.Canpolat E, Karaca ZM, Kayhan B, Kayhan B, Bayındır Y, Yılmaz S. Attenuation of Antibody Response and Elevation of CD4+CD25+Foxp3+ Treg cell Frequency During Chronic Liver Fibrosis. Hepatology. 2017;66(Suppl 1):687A. [Google Scholar]
- 28.Wang X, Destrument A, Tournier C. Physiological roles of MKK4 and MKK7: Insights from animal models. Biochimica et Biophysica Acta. 2007;1773:1349–57. doi: 10.1016/j.bbamcr.2006.10.016. [DOI] [PubMed] [Google Scholar]
- 29.Vong L, Ferraz JG, Dufton N, et al. Up-regulation of Annexin-A1 and Lipoxin A(4) in individuals with ulcerative colitis may promote mucosal homeostasis. Plos One. 2012;7:e39244. doi: 10.1371/journal.pone.0039244. [DOI] [PMC free article] [PubMed] [Google Scholar]
- 30.Ohse T, Ota T, Kieran N, et al. Modulation of interferon-induced genes by lipoxin analogue in anti-glomerular basement membrane nephritis. J Am Soc Nephrol. 2004;15:919–27. doi: 10.1097/01.ASN.0000119962.69573.CC. [DOI] [PubMed] [Google Scholar]
- 31.Kong X, Wu SH, Zhang L, Chen XQ. Pilot application of lipoxin A4 analog and lipoxin A4 receptor agonist in asthmatic children with acute episodes. Exp Ther Med. 2017;14:2284–90. doi: 10.3892/etm.2017.4787. [DOI] [PMC free article] [PubMed] [Google Scholar]
- 32.Machado FS, Johndrow JE, Esper L, et al. Anti-inflammatory actions of lipoxin A4 and aspirin-triggered lipoxin are SOCS-2 dependent. Nat Med. 2006;12:330–4. doi: 10.1038/nm1355. [DOI] [PubMed] [Google Scholar]
- 33.Posselt G, Schwarz H, Duschi A, Horejs-Hoeck J. Suppressor of cytokine signaling 2 is a feedback inhibitör of TLR-induced activation in human monocyte-derived dendritic cells. J Immunol. 2011;187:2875–84. doi: 10.4049/jimmunol.1003348. [DOI] [PubMed] [Google Scholar]
- 34.Liao W, Zeng F, Kang K, Qi Y, Yao L, Yang H, Ling L, Wu N, Wu D. Lipoxin A4 attenuates acute rejection via shifting Th1/Th2 cytokine balance in rat liver transplantation. Transplant Proc. 2013;45:2451–4. doi: 10.1016/j.transproceed.2013.01.069. [DOI] [PubMed] [Google Scholar]
- 35.Mendelson KG, Contois LR, Tevosian SG, Davis RJ, Paulson KE. Independent regulation of JNK/p38 mitogen-activated protein kinases by metabolic oxidative stress in the liver. Proc Natl Acad Sci USA. 1996;93:12908–13. doi: 10.1073/pnas.93.23.12908. [DOI] [PMC free article] [PubMed] [Google Scholar]
- 36.Lv G, Zhu Z, Tie Y, et al. MicroRNA-451 regulates activating transcription factor 2 expression and inhibits liver cancer cell migration. Oncol Rep. 2014;32:1021–8. doi: 10.3892/or.2014.3296. [DOI] [PubMed] [Google Scholar]
Associated Data
This section collects any data citations, data availability statements, or supplementary materials included in this article.
Supplementary Materials
RNA samples were run in 1% agarose gel to identify 28S and 18S RNA bands (A). 100 bp DNA ladder (A), RNA sample w/o heating (B), and RNA sample heated at 70 °C for 1 minute (C). After RT-PCR, PCR products were run in 2% agarose gel with a 100 bp DNA ladder. Column A1 and A2 represent 100 bp DNA ladder, B1 and B2; ATF2 (92bp), C1 and C2; MKK4 (89) bp), D1 and D2; MKK7 (93 bp), E1 and E2; TGF-α1 (63 bp), F1 and F2; GAPDH (140 bp).


