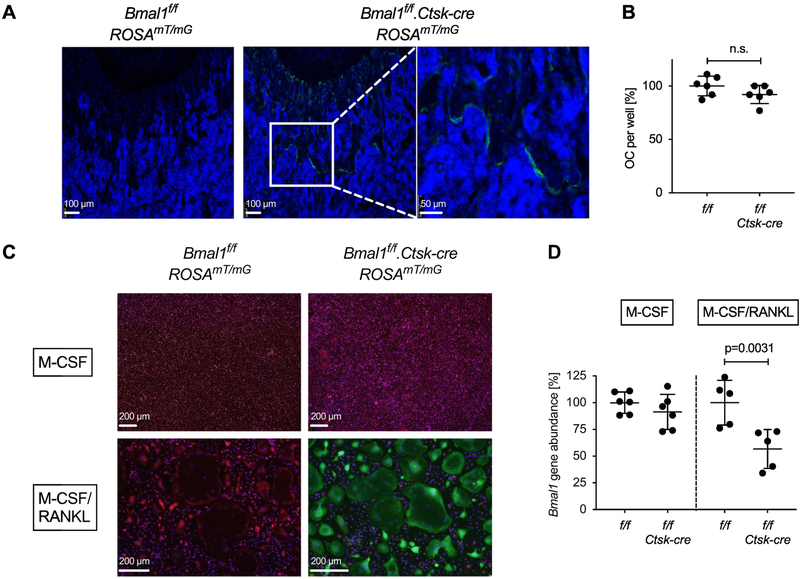
Fig. 3. Deletion of Bmal1 in osteoclasts from Bmal1f/f.Ctsk-cre mice.
(A) Sections of the distal femur from representative 4-week-old Bmal1f/f.ROSA26mT/mG and Bmal1f/f.Ctsk-cre.ROSA26mT/mG mice analyzed by fluorescence microscopy. Green = EGFP, Blue = DAPI. Positive EGFP fluorescence documents a history of Cre activity. (B) Osteoclasts were differentiated in vitro from Bmal1f/f and Bmal1f/f.Ctsk-cre bone marrow of individual mice in the presence of M-CSF and RANKL, and the number of TRAP positive osteoclasts per well was counted. Pooled data from two experiments are shown with each symbol representing one animal. Data were normalized to the mean number of Bmal1f/f osteoclasts in each experiment (100%). (C) Bone marrow cells from Bmal1f/f.ROSA26mT/mG and Bmal1f/f.Ctsk-cre.ROSA26mT/mG mice were differentiated into osteoclasts as in (B), control macrophages were generated by culture with M-CSF. Green = EGFP, Red = tdTomato. (D) Genomic DNA was prepared from Bmal1f/f and Bmal1f/f.Ctsk-cre macrophage (M-CSF) and osteoclast (M-CSF + RANKL) cultures. Deletion of Bmal1 was assessed by real-time quantitative PCR analysis of genomic DNA. Data were normalized to the Bmal1 content in macrophage cultures (100%). Each data point represents one animal. Pooled data from two experiments are shown. Bars are mean and SD; p values by Student’s t test.

