

Abstract
Scarce in criminological literature is an exploration of whether crime reporting varies geographically. Yet, there are substantive reasons to believe not only that the percentage of crimes reported to the police varies across jurisdictions, but also that crime reporting can be explained by ecological characteristics. Drawing upon data from both the National Crime Victimization Survey and the census, this study examines the relationship between immigration and the likelihood that crimes are reported to the police. Results indicate that crime reporting is inversely related to increases in the rates of noncitizens and foreign-born residents within a metropolitan area, and that the negative effect is greater for violence than for property crime. Implications for policing and public safety are discussed.
Keywords: immigration, crime reporting, contextual effects, victimization, social contexts
Sir Robert Peel, the late British Prime Minister and founder of the London Metropolitan Police Department, is generally attributed with the creation of the nine principles of policing that still serve as a blueprint for modern police organizations (New York Times, 2014). The first principle states, “The basic mission for which the police exist is to prevent crime and disorder.” If, however, the police are aware of relatively few of the crimes committed, is it possible for the police to fulfill their mission or to evaluate their capacity to do so?
The fact is that the police do not know about most crimes. Based on analysis of National Crime Victimization Survey (NCVS) data, the Bureau of Justice Statistics (BJS) estimates that fewer than 37% of all victimizations are reported to the police (Truman & Langton, 2014). For property crimes, just 36% are reported to the police. The situation with violence is slightly better, yet the police are notified of only 46% of violent crimes (Truman & Langton, 2014). Hence, data compiled by the Federal Bureau of Investigation (FBI) from local law enforcement for the Uniform Crime Reports (UCR) provides only a partial picture of the true volume of crime in society.
The FBI recognizes the fallible nature of crime data, and cautions data users of its “Crime in the United States” information series from ranking cities or counties based upon reported crime statistics. The FBI (2010, p. 2) states, “One city may report more crime than a comparable one, not because there is more crime, but rather because its law enforcement agency, through proactive efforts, identifies more offenses. Attitudes of the citizens toward crime and their crime reporting practices, especially concerning minor offenses, also have an impact on the volume of crimes known to police.”
While an extensive amount of scholarly attention has been dedicated to understanding both the incident-and individual-level factors that contribute to one’s likelihood of reporting crime to the police (Baumer & Lauritsen, 2010; Felson et al., 2002; Gottfredson & Hindelang, 1979; Skogan, 1984), relatively scarce in the research literature is an exploration of whether there is geographic variation in the reporting of crime (exceptions include: Baumer, 2002; Goudriaan et al., 2006). Yet there are substantive reasons to believe not only that the percentage of crimes reported to the police varies across jurisdictions, but also that crime reporting can be explained by characteristics of urban areas. For instance, in cities with large numbers of immigrants, proportionally fewer crimes may be reported to the police than in cities with fewer such residents because of harassment or the threat of deportation (of unauthorized immigrants).
Prior work on immigrant attitudes toward the law and legal officials highlights some of the challenges encountered in areas densely populated by immigrant groups, which may ultimately affect the likelihood of crimes being reported to the police. For example, negative experiences with legal authorities in their countries of origin (Pogrebin & Poole, 1990; Tyler, Schulhofer, & Huq, 2010), fear of the police due to their immigration status (Menjívar & Bejarano, 2004), and cultural and language barriers between immigrants and legal officials (Davis, 1985; Pogrebin & Poole, 1990), may all deter immigrants from reporting crime to the police. Many immigrant destinations routinely cited by journalists, politicians, and police chiefs as being the safest in the country—such as San Diego, San Jose, Austin, and New York (CQ Press, 2013)—may be more dangerous than commonly perceived, and the police simply do not know how unsafe because of the underreporting of crime. Though some legal experts suggest that the underreporting of crime is related to immigration (e.g., Pogrebin & Poole, 1990), no empirical work has tested this assumption. Accordingly, in this study we ask: to what extent does the underreporting of crime to the police vary by characteristics of metropolitan areas (MSAs), particularly changes in the relative rates of the noncitizen and foreign-born populations?
We draw upon data on the reporting of crimes from the National Crime Victimization Survey (NCVS) as well as estimates on the sizes of the noncitizen and foreign-born populations noncitizen and foreign-born populations within a metropolitan area are significantly and negatively predictive of police notification rates.
In our analysis, we focus on the effect of the growth in two related subsets of the immigrant population—i.e., the relative sizes of the noncitizen population and foreign-born population. The underreporting of crime may be especially prevalent among unauthorized immigrants due to their fears of detection and deportation inspired by law enforcement (Menjívar & Bejarano, 2004). However, the underreporting of crime to the police may not be limited to unauthorized immigrants. Many factors may influence even authorized immigrants to avoid the police, such as their preexisting perceptions of illegitimate or corrupt legal systems in their countries of origin (Pogrebin & Poole, 1990; Tyler, Schulhofer, & Huq, 2010) and their difficulty navigating such contact due to language and cultural barriers (Davis, 1985; Meeker & Dombrink, 1988). Hence, we separately examine the association between the growth of these two subsets of the immigration population and the reporting of crime to the police in order to account for the different reasons why crime would be underreported.
Correlates of Police Notification
Researchers have developed a large body of literature concerning the correlates of crime reporting to the police (e.g., Block, 1974; Laub, 1981; Skogan, 1976, 1977, 1984). Scholars widely agree that a crime’s level of severity most strongly predicts whether it is reported to the police (Baumer, 2002; Bennett & Weigan, 1994; Felson et al., 2002; Gottfredson & Hindelang, 1979; Skogan, 1976, 1984). More serious crimes that involve the presence or use of a weapon, result in an injury, or bring about significant financial loss increase the likelihood of police notification (Baumer, 2002; Block, 1974; Gottfredson & Hindelang, 1979; Skogan, 1976, 1984). Accordingly, robberies and aggravated assaults are more likely to be reported to the police than petty thefts or simple assaults (Rand & Catalano, 2007; Truman & Langton, 2014).
An incident’s severity (or lack thereof) has also been found to influence the rationale for non-reporting decisions. For instance, analysis of the NCVS reveals that the majority of simple assault victims who chose not to notify the police of their experience disclosed that their decision was based on the fact that they considered their incident a “personal matter,” and that their incident was “dealt with in another way.” Victims of less severe crimes also commonly reveal that they forewent the reporting process because it was “not important enough” (Langton et al., 2012, p. 2–4). Similar narratives for non-reporting have also been found across international contexts (e.g., Buikhuisen, 1975; Schwind, 1984).
Although much of the decision involved in crime reporting to the police depends on the incident’s severity, the likelihood of reporting also rests on offender and victim traits. For example, reporting to the police is more common when the offender was under the influence of alcohol or drugs. Reporting is also more common for crimes involving a Black offender as well as multiple offenders, and reporting corresponds positively with offender age (Fisher et al., 2003; Hart & Rennison, 2003). In terms of victim characteristics, crimes are more likely to be reported to the police when the victim is older, female, Black, and married (Baumer & Lauritsen, 2010; Block, 1974; Hart & Rennison, 2003). Moreover, in their comprehensive investigation of NCVS data from 1973 to 2005, Baumer and Lauritsen (2010) find that rates of notification to the police for burglary, motor vehicle theft, larceny, and other forms of violence—except for robbery—have increased since the mid-to-late 1980s.
Contextual Determinants of Crime Reporting
In order to understand the relationship between immigration and crime reporting, we turn centers on socioeconomic disadvantage as it relates to ecological levels of crime reporting, yet the findings from existing studies on this relationship are somewhat mixed. Whereas research from the latter part of the 20th century generally finds little evidence of an association between poverty and crime reporting (e.g., Bennett & Wiegand, 1994; Gottfredson & Hindelang, 1979; Warner, 1992), recent work demonstrates a more nuanced understanding. For example, Baumer (2002) finds no significant relationship between an area’s socioeconomic standing and the probability that the police are notified of most forms of violence, with the exception of simple disadvantaged neighborhoods, with higher levels of reporting for neighborhoods falling in the middle range on a socioeconomic scale. Baumer (2002) suggests the patterns of lower reporting in wealthy and poor areas relative to middle-income neighborhoods may reflect higher levels of informal social control in very advantaged and very disadvantaged communities.
Other contextual work examines the variation in reporting across time and space. Xie (2014) finds significant differences in crime reporting from 1979 to 2004 across U.S. metropolitan areas. Over this time, New Yorkers were significantly less likely to notify the police of most crimes than residents of the other top five largest MSAs (i.e., Los Angeles, Chicago, Philadelphia, and Detroit). Xie (2014) also observes that Los Angeles closely resembles New York in terms of crime reporting rates, suggesting “research needs to go beyond crime characteristics to explain the low rates of reporting in New York and Los Angeles” (Xie, 2014, p. 8). One potential reason for these MSA differences in reporting—although untested to date—is immigration. Immigrants represent a much larger share of the total population in New York and Los Angeles than in Chicago, Detroit, or Philadelphia (see Table 2 to follow). Hence, one factor explaining the MSA-level differences found in Xie’s study could be the extent of immigration.
Table 2.
Police Notification Rates, and the Percentage of the Population Noncitizen and Foreign-born by MSA
| Police Notification Rates | Population Rates | |||||
|---|---|---|---|---|---|---|
| Metropolitan Area | Property Crime |
Violent Crime |
Noncitizens (1990) |
Noncitizens (2000) |
Foreign- born (1990) |
Foreign- born (2000) |
| Anaheim-Santa Ana, CA | 41% | 57% | 17% | 19% | 24% | 30% |
| Atlanta, GA | 41% | 48% | 3% | 9% | 5% | 13% |
| Baltimore, MD | 44% | 53% | 2% | 3% | 4% | 6% |
| Boston, MA-NH | 33% | 47% | 6% | 9% | 11% | 15% |
| Charlotte-Gastonia-Rock Hill, NC-SC | 48% | 33% | 2% | 7% | 3% | 9% |
| Chicago, IL | 42% | 50% | 7% | 11% | 12% | 18% |
| Cincinnati, OH-KY-IN | 41% | 44% | 1% | 2% | 2% | 3% |
| Cleveland, Lorain, Elyria, OH | 41% | 72% | 2% | 2% | 5% | 6% |
| Columbus, OH | 49% | 48% | 2% | 4% | 3% | 6% |
| Dallas, TX | 39% | 37% | 6% | 13% | 9% | 17% |
| Denver, CO | 40% | 29% | 3% | 8% | 5% | 11% |
| Detroit, MI | 39% | 49% | 3% | 4% | 6% | 8% |
| Fort Lauderdale, FL | 45% | 53% | 9% | 14% | 16% | 25% |
| Fort Worth-Arlington, TX | 43% | 58% | 4% | 8% | 6% | 12% |
| Houston, TX | 43% | 49% | 9% | 14% | 13% | 20% |
| Kansas City, MO-KS | 50% | 55% | 1% | 3% | 2% | 5% |
| Los Angeles-Long Beach, CA | 37% | 39% | 24% | 22% | 33% | 36% |
| Miami, FL | 48% | 56% | 29% | 27% | 45% | 51% |
| Minneapolis-St. Paul, MN-WI | 42% | 49% | 2% | 5% | 4% | 8% |
| Nassau-Suffolk, NY | 30% | 65% | 5% | 7% | 10% | 14% |
| New York, NY | 36% | 33% | 16% | 19% | 27% | 34% |
| Newark, NJ | 35% | 65% | 8% | 11% | 15% | 21% |
| Norfolk-Virginia Beach-Newport News, VA-NC | 31% | 38% | 2% | 2% | 4% | 5% |
| Oakland, CA | 40% | 50% | 10% | 13% | 16% | 24% |
| Orlando, FL | 45% | 21% | 4% | 7% | 7% | 13% |
| Philadelphia, PA-NJ | 37% | 54% | 2% | 3% | 5% | 7% |
| Phoenix-Mesa, AZ | 35% | 32% | 4% | 11% | 7% | 14% |
| Pittsburgh, PA | 48% | 55% | 1% | 1% | 3% | 3% |
| Portland-Vancouver, OR-WA | 36% | 47% | 3% | 7% | 6% | 11% |
| Riverside-San Bernardino, CA | 37% | 57% | 10% | 12% | 14% | 19% |
| Sacramento, CA | 34% | 46% | 6% | 9% | 10% | 15% |
| San Antonio, TX | 36% | 39% | 5% | 6% | 8% | 11% |
| San Diego, CA | 31% | 45% | 11% | 13% | 17% | 22% |
| San Francisco, CA | 40% | 40% | 16% | 15% | 28% | 32% |
| San Jose, CA | 29% | 51% | 15% | 20% | 23% | 34% |
| Seattle-Bellevue-Everett, WA | 43% | 45% | 4% | 8% | 8% | 14% |
| St. Louis, MO-IL | 42% | 51% | 1% | 2% | 2% | 3% |
| Tampa-St. Petersburg-Clearwater, FL | 40% | 45% | 4% | 6% | 7% | 11% |
| Washington, DC-MD-VA-WV | 35% | 37% | 9% | 12% | 13% | 20% |
| West Palm Beach-Boca Raton, FL | 52% | 58% | 6% | 10% | 12% | 17% |
Recent survey findings also emphasize the importance of investigating the relationship between crime reporting and immigration. In their survey of local district attorneys and police chiefs in the 50 largest MSAs, Davis and colleagues (2001) find that 67% of legal officials believe that immigrants report crime less often than non-immigrants. Officials cited their own personal experiences as well as information from community leaders, the media, and police data as sources that influenced their beliefs about immigrant crime reporting (Davis, Erez, & Avitabile, 2001). While legal officials assume a relationship between immigration status and the reporting of crime and victimizations to the police, research is generally lacking on this question.
Current Study
Whereas some prior research has investigated the ecological correlates of crime reporting, important challenges remain. Most work in this area focuses on the influence of structural disadvantage or mere spatial variation, yet other factors, such as immigration, may also influence the reporting of crime. We address these limitations by conducting one of the first analyses on the relationship between measures of the immigrant population (i.e., noncitizen and foreign-born groups) and crime reporting. Matching crime reporting data from the NCVS to MSA-level demographic information, we test whether changes in the relative size of the immigrant population is significantly related to the likelihood that crimes are reported to the police. We examine this relationship for both property1 and violent2 crime.
Research Design
Data
We use data from the NCVS to examine MSA-level differences in police notification of victimizations. The NCVS is a nationally representative survey of approximately 160,000 individuals in about 90,000 households. The survey aims to interview all members within a household who are at least 12 years old. About 90% of households and 88% of all eligible individuals within households ultimately participate (Planty, 2014). The NCVS was designed to uncover comprehensive information about individual and household probabilities of victimization, the effect of the relationship between victims and offenders, and both the police, the NCVS is considered the most accurate source of information on the true volume and characteristics of crime and victimization in the United States. We draw upon a special subset of the NCVS data produced by BJS in conjunction with the Census Bureau. This dataset, which is archived at the Interuniversity Consortium for Political and Social Research (U.S. Department of Justice, 2007), allows for a multilevel investigation of the victimization incidents occurring within the 40 largest MSAs in the country3 (see Table 2 for a complete list of the MSAs). The dataset covers the time period from 1979 to 2004.
In the interest of providing the most current analysis possible of crime reporting trends by MSA, we draw upon the most recent years of data available from this dataset. Following prior research using this same dataset (e.g., Xie, 2014), we pool three years of data in order to smooth year-to-year fluctuations in crime. We also draw upon Census Bureau data for the purpose of measuring immigrant populations and other contextual characteristics. Using the MSA geographic codes, we merge the 2002–2004 NCVS with demographic information from the 1990 and 2000 decennial censuses.
Measures
The dependent variable for our analysis is a binary measure indicating whether the police were notified of a victimization that occurred. Among respondents who disclosed they experienced victimization, a follow-up question asks “were the police informed or did they find out about this incident in any way?” We use this question to determine whether (1) or not (0) the police were notified of a crime—regardless of whether the incident was reported by the victim, a third party, or if the police were at the scene or they found out in some other way.
As noted previously, we measure immigration through two different methods: based on the percentages of noncitizens and foreign-born residents in an MSA. In analyses, we use the 1990 rates, as well as estimates of the raw change in the population rates from 1990 to 2000. We focus on the changes in the rates of the noncitizens and foreign-born residents because we anticipate areas that experienced a substantial influx of immigrant groups may lack the infrastructure and resources that facilitate the integration of immigrants, leaving them isolated from institutions such as the police. In order to control for unobserved heterogeneity, we control for the initial levels of the dependent variables (i.e., the 1990 rates of the noncitizen and foreign-born populations).
Consistent with previous studies of macro-level predictors associated with crime reporting (e.g., Baumer, 2002; Goudriaan et al., 2006), we also include socio-demographic measures collected from the census to control for confounding characteristics at the MSA-level. Our control variables include an estimate of the share of residents who are Black and an index of socioeconomic disadvantage computed via principal components analysis (see Sampson, Raudenbush, & Earls, 1997). This index is derived from the following census indicators: the unemployment rate of the adult civilian population, median family income, the proportion of and the proportion of households that receive public assisted income.
In order to separate the effects of individual and contextual features associated with the likelihood of crime reporting, as well as to control for key confounding variables that may bias results if otherwise left unaccounted, we include several individual characteristics in our models. We measure NCVS respondents’ sex, race and ethnicity, marital status, education, and homeownership. Females, non-Latino Whites, and non-married individuals serve as the reference categories for victims’ sex, race and ethnicity, and marital status, respectively. We account for age using the available NCVS measure. The NCVS provides age as an interval variable coded into eight categories. Categories one through seven include five-year age groups for persons between 12 and 59 years old, while the eighth category includes those respondents 60 years and older. Lastly, we include variables for education and housing tenure as indicators of socioeconomic status. Homeownership captures whether the victim (or the victim’s family) reported living in an owned home (1), or whether the victim reported living in a rented or otherwise subsidized home (0). Three binary variables measure levels of completed schooling (i.e., less than high school, high school, and college or more), and those who completed less than high school levels of education serve as the reference group.
In addition to accounting for victim traits that influence crime reporting, we also control for incident characteristics that have been shown to influence the likelihood of police notification (e.g., Baumer, 2002; Felson et al., 2002; Gottfredson & Hindelang, 1979; Skogan, 1976, 1984). We measure the severity of property crimes by estimating the natural logarithm of reported dollar amount lost or stolen as a result of victimization (financial loss). The severity of violent crimes is approximated with three binary variables used to distinguish incidents during which the offender presented or used a firearm (offender had gun), the offender presented or used some weapon other than a firearm (offender had other weapon), and the respondent experienced an injury requiring hospitalization as a result of her or his victimization (serious injury). Those incidents during which the respondent denied or was uncertain of whether or not the offender had a firearm or some other weapon, and those that resulted in minor or no injuries to the victim, serve as the reference categories.
Analytical Strategy
We employ multilevel logistic regression to estimate the effects of the changes in the rates of the noncitizen and foreign-born populations in an MSA on the individual-level indicator of whether victimizations were reported to the police. We estimate separate logistic models for the reporting of property and violent offenses. Given the multistage, stratified cluster sample design of the NCVS data, we apply the provided incident weights to reduce sampling bias.
We also account for potential issues of model misspecification. Data derived from the NCVS MSA file offer repeated observations within each metro area, requiring us to account for the clustered sampling design. Although observations may be independent across MSA clusters, the data within MSA clusters are not necessarily independent. Consequently, we specify that our logistic models permit intragroup correlation, which avoids inflated standard errors and produces unbiased coefficients (see Neuhaus & Kalbfleisch, 1998).
Findings
We begin by presenting descriptive statistics for our dependent and independent variables in Table 1. Victims of violent crimes were more likely to report their incidents to the police (48%) than those who experienced property crimes (39%). Violent victimization was more common among males (56%), non-Latino Blacks and Latinos (both 17%), and persons with high school levels of education (32%). Conversely, property crimes were less common among males (45%), but more common among persons with education levels of college or more (54%), married individuals (42%), and homeowners (61%).
Table 1.
Means and Standard Deviations Dependent and Independent Variables
| Property Crime | Violent Crime | |||
|---|---|---|---|---|
| (N= 10,021) | (N= 2,293) | |||
| Mean | SD | Mean | SD | |
| Individual level (N= 12,314) | ||||
| Dependent Variable | ||||
| Crime reported to the police | .39 | .49 | .48 | .50 |
| Victim Characteristics | ||||
| Male | .45 | .50 | .56 | .50 |
| Latino | .18 | .38 | .17 | .37 |
| Non-Latino Black | .15 | .36 | .17 | .38 |
| Non-Latino other | .05 | .21 | .05 | .22 |
| Age | 4.69 | 2.18 | 3.73 | 2.22 |
| Less than high school | .20 | .40 | .22 | .41 |
| High school | .24 | .42 | .32 | .47 |
| College or more | .54 | .50 | .45 | .50 |
| Married | .42 | .49 | .24 | .43 |
| Homeowner | .61 | .49 | .52 | .50 |
| Incident Characteristics | ||||
| Offender had gun | .09 | .28 | ||
| Offender had other weapon | .14 | .35 | ||
| Offender had no weapon | .78 | .42 | ||
| Serious injury | .06 | .24 | ||
| Financial loss | $320.53 | $15.49 | ||
| MSA level (N= 40) | ||||
| Contextual Characteristics | ||||
| % of the population noncitizen (1990) | 7.71 | 6.66 | 7.40 | 6.51 |
| % of the population noncitizen (2000) | 10.57 | 6.04 | 10.21 | 6.05 |
| % change in the population noncitizen | 2.87 | 2.20 | 2.82 | 2.14 |
| % of the population foreign-born (1990) | 12.33 | 9.39 | 11.96 | 9.31 |
| % of the population foreign-born (2000) | 17.35 | 10.17 | 16.84 | 10.23 |
| % change in the population foreign-born | 5.02 | 2.32 | 4.88 | 2.35 |
| % of the population Non-Latino Black | 13.79 | 8.42 | 14.26 | 8.30 |
| Disadvantage index | .16 | 1.06 | .21 | 1.08 |
In terms of incident characteristics, nearly one-quarter of all violent crimes involved the use or presence of either a firearm (9%) or some other weapon (14%) by the offender, but far fewer incidents (6%) involved a serious injury to the victim. Respondents reported an average loss of about $320.53 as a result of their property crime victimizations.
We also measure several macro-level conditions to account for the ecological differences among the MSAs. The primary focus of our analysis is on changes in the relative sizes of the noncitizen and foreign-born populations. In 1990, the average size of the noncitizen and foreign-born populations were about 8% and 12%, respectively. By 2000, these populations grew to make up approximately 11% and 17% of the population across the 40 MSAs.
Though the descriptive data in Table 1 indicates that immigrant populations increased over time across the 40 MSAs, we expect variation in the levels of change throughout the cities. According to such variation, we also anticipate levels of crime reporting to vary across the 40 MSAs. While experts suggest that immigration relates to the likelihood of crime reporting (e.g., Pogrebin & Poole, 1990), and prior work on crime reporting across MSAs shows significant variation in reporting across cities (e.g., Xie, 2014), we know little about the contextual characteristics related to police notification. We turn to Table 2 to investigate levels of variation in crime reporting as well as the differences in the sizes of the noncitizen and foreign-born populations across the 40 MSAs.
Table 2 displays the reporting rates for both property and violent crimes for all 40 MSAs. Descriptively, the data in Table 2 reveal substantial variation across metropolitan areas in the likelihood that victimization is reported to the police. On average, 39% of property crimes across the 40 MSAs were reported to the police. In comparison, some areas reported as high as 52% of property crimes (i.e., West Palm Beach-Boca Raton), while other cities reported as low as 31% (i.e., San Diego). Variation in levels of violent crime reporting was even greater across the 40 MSAs. Merely 21% of violence was reported in Orlando, while nearly three-quarters (72%) of residents notified the police of violent crimes in Cleveland. It is this substantial variation in reporting rates, particularly for violent crime, that we seek to explain in this study.
Also reported in Table 2 are the percentages of noncitizen and foreign-born residents in both 1990 and 2000 for the 40 MSAs. Areas with the highest rates of noncitizen and foreign-born residents include Miami, Los Angeles-Long Beach, and Anaheim-Santa Ana. Midwestern MSAs such as St. Louis, Pittsburgh, and Kansas City have the lowest shares of their populations made up by noncitizen and foreign-born residents.
All 40 MSAs experienced growth in either their noncitizen or foreign-born population rates from 1990 to 2000, and most cities saw increases in both groups. Though we hypothesize that immigration significantly relates to levels of crime reporting, the correlations between the rate of property crime reporting and changes in the percentages of the noncitizen and foreign-born populations are modest (−0.05 and-0.12, respectively). The correlations between these population changes and rates of violent crime reporting, however, are greater (−.024 and-0.21, respectively). Our ensuing analysis will further investigate whether metropolitan characteristics, especially changes in the rates of the population noncitizen and foreign-born, are significantly associated with the likelihood crimes are reported to the police.
We first present the results of our logistic regression analyses for the likelihood of property crime reporting. The first model in Table 3 focuses on the relationship between changes in the noncitizen population and reporting, while the second model estimates this association for changes in the relative size of the foreign-born population.
Table 3.
Results of Logistic Regression Models for Property Crime Reporting, 40 MSAs (2002–2004)
| Noncitizens | Foreign-born | |||||
|---|---|---|---|---|---|---|
| Coeff. | SE | OR | Coeff. | SE | OR | |
| Intercept | −2.411 | .127 *** | .090 | −2.390 | .124*** | .092 |
| Individual level (N= 12,427) | ||||||
| Victim Characteristics | ||||||
| Male | −.023 | .054 | .978 | −.022 | .054 | .978 |
| Latino | .073 | .101 | 1.076 | .075 | .101 | 1.078 |
| Non-Latino Black | .151 | .084† | 1.163 | .151 | .084 * | 1.163 |
| Non-Latino other | −.168 | .142 | .845 | −.162 | .143 † | .850 |
| Age | .040 | .013 ** | 1.041 | .040 | .013 ** | 1.041 |
| High school | .546 | .094 *** | 1.726 | .545 | .094 *** | 1.724 |
| College or more | .501 | .081 *** | 1.651 | .503 | .080 *** | 1.653 |
| Married | .136 | .060 * | 1.146 | .136 | .060 * | 1.146 |
| Homeowner | −.098 | .049 | .907 | −.100 | .050 | .905 |
| Incident Characteristics | ||||||
| Offender had gun | ||||||
| Offender had other weapon | ||||||
| Serious injury | ||||||
| Financial loss (natural logarithm) | .245 | .009*** | 1.278 | .245 | .009*** | 1.278 |
| MSA level (N = 40) | ||||||
| Contextual Characteristics | ||||||
| % of the population noncitizen (1990) | −.011 | .006† | .989 | |||
| Change in the % population noncitizen | −.008 | .014 | .992 | |||
| % of the population foreign-born (1990) | −.007 | .004† | .993 | |||
| Change in the % population foreign-born | −.009 | .013 | .991 | |||
| % of the population Non-Latino Black | .000 | .004 | 1.000 | .000 | .004 | 1.000 |
| Disadvantage index | −.028 | .039 | .973 | −.028 | .010 | .972 |
| Sample | 8,171 | 8,171 | ||||
| Size Pseudo R2 | .086 | .086 | ||||
| Chi-square | 1,621*** | 1,621*** | ||||
Note: SE refers to robust standard errors; OR refers to odds ratios.
p<.10
p<.05
p <.01
p <.001 (two-tailed tests).
Consistent with previous research (e.g., Baumer, 2002; Baumer & Lauritsen, 2010; Block, 1974), both models in Table 3 demonstrate that the police are more likely to be notified of property crime when the victim is Black, older, and married. The victim’s level of education and financial loss also positively correlate with property crime reporting.
Most importantly, results in Table 3 address our main research question of interest: do changes in the relative sizes of the noncitizen and foreign-born populations affect the likelihood of police notification? We find that neither changes (1990 to 2000) in the relative size of the noncitizen nor the foreign-born population significantly predict property crime reporting. However, the baseline (1990) rates of each group have a marginally significant association with the likelihood of police notification of property crime. A one percent increase in the rates of the noncitizen and foreign-born populations corresponds to a 1% decrease in the odds of property crime being reported to the police, on average. Such results support the views of legal officials, who generally perceive that immigration has little bearing on the reporting of property crimes. However, legal officials view immigration as far more impactful on the reporting of violence to the police (see Davis, Erez, & Avitabile, 2001). We turn to our analyses in Table 4 to address this assertion.
Table 4.
Results of Logistic Regression Models for Violent Crime Reporting, 40 MS As (2002–2004)
| Noncitizens | Foreign-born | |||||
|---|---|---|---|---|---|---|
| Coeff. | SE | OR | Coeff. | SE | OR | |
| Intercept | −.529 | .222 * | .589 | −.595 | .235 * | .551 |
| Individual level (N= 12,427) | ||||||
| Victim Characteristics | ||||||
| Male | −.395 | .135 ** | .673 | −.393 | .135 ** | .675 |
| Latino | .440 | .195 * | 1.552 | .417 | .193 * | 1.518 |
| Non-Latino Black | .399 | .152 ** | 1.491 | .394 | .151 ** | 1.483 |
| Non-Latino other | .244 | .190 | 1.277 | .234 | .190 | 1.264 |
| Age | .120 | .029 *** | 1.127 | .120 | .029 *** | 1.127 |
| High school | .115 | .141 | 1.122 | .117 | .142 | 1.124 |
| College or more | .167 | .114 | 1.182 | .169 | .113 | 1.184 |
| Married | .146 | .165 | 1.157 | .147 | .166 | 1.158 |
| Homeowner | −.064 | .136 | .938 | −.066 | .136 | .936 |
| Incident Characteristics | ||||||
| Offender had gun | 1.132 | .178 *** | 3.732 | 1.313 | .181 *** | 3.716 |
| Offender had other weapon | .455 | .173 ** | 1.577 | .456 | .173 ** | 1.578 |
| Serious injury | 2.024 | .326 *** | 7.569 | 2.028 | .325 *** | 7.598 |
| Financial loss (natural logarithm) | ||||||
| MSA level (N = 40) | ||||||
| Contextual Characteristics | ||||||
| % of the population noncitizen (1990) | −.030 | .011 ** | .971 | |||
| Change in the % population noncitizen | −.066 | .029 * | .936 | |||
| % of the population foreign-bom (1990) | −.009 | .008 | .991 | |||
| Change in the % population foreign-bom | −.050 | .030 † | .952 | |||
| % of the population Non-Latino Black | .003 | .008 | 1.003 | .004 | .008 | 1.004 |
| Disadvantage index | −.040 | .074 | .961 | −.055 | .076 | .947 |
| Sample Size | 2,251 | 2,251 | ||||
| Pseudo R2 | .088 | .087 | ||||
| Chi-square | 339*** | 341*** | ||||
Note: OR refers to odds ratios; SE refers to robust standard errors.
P<.10
p <.05
p<.01
P <.001 (two-tailed tests).
Table 4 reveals that both victim and incident characteristics operate in the expected direction and extent as predictors of the reporting of violence to the police (see Baumer, 2002; Baumer & Lauritsen, 2010; Laub, 1981; Rennison, 2003). In addition to uncovering these anticipated findings, Table 4 tests our central research question: is violent crime reporting to the police negatively influenced by changes in the relative sizes of the noncitizen and foreign-born populations? We find that the change in the proportion of noncitizen residents from 1990 to 2000 significantly influences violent crime reporting. A one percent increase in the noncitizen population decreases the odds of violent crime reporting by about 6%, on average. Metropolitan areas that experienced rapid influx by immigrants during the 1990s therefore appear to suffer substantial levels of underreporting of violent crime to the police relative to cities that did not experience such growth in the share of their noncitizen populations.
To further elucidate the relationship between immigration and crime reporting within a metropolitan area, we estimate the probabilities of police notification at varying levels of change in the rates of both the noncitizen and foreign-born populations while holding all control variables at their means (using the models in Tables 3 and 4, respectively). Figure 1 displays the estimated probabilities of police notification for property crime victimizations and Figure 2 displays estimates for violent victimizations. Consistent with Table 3, levels of property crime reporting remain relatively stable across varying levels of change in both immigrant group populations. By contrast, Figure 2 reveals that increases in the relative size of the immigrant population exhibits sizeable effects on violent crime reporting. Rates of violent crime reporting fall over 19% as one moves from areas that experienced little or no changes in the rate of their noncitizen residents to other areas that saw substantial increases in the percent of their populations made up by noncitizens. Places like Phoenix, Dallas, and Atlanta, for example, that experienced the largest growth in the portion of their residents made up by noncitizens from 1990 to 2000 (see Table 2), may therefore endure the greatest barriers to reporting crime when it comes to violence.
Figure 1.
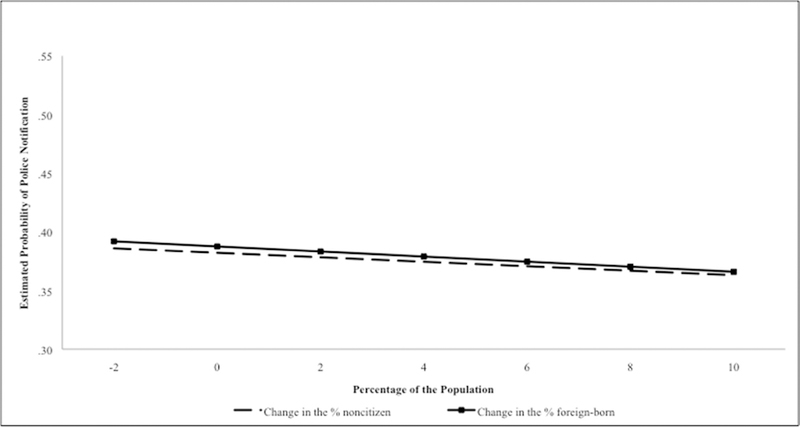
Estimated Probabilities of Police Notification of Property Crime by the Change in the % Noncitizen and Foreign-born Populations
Figure 2.
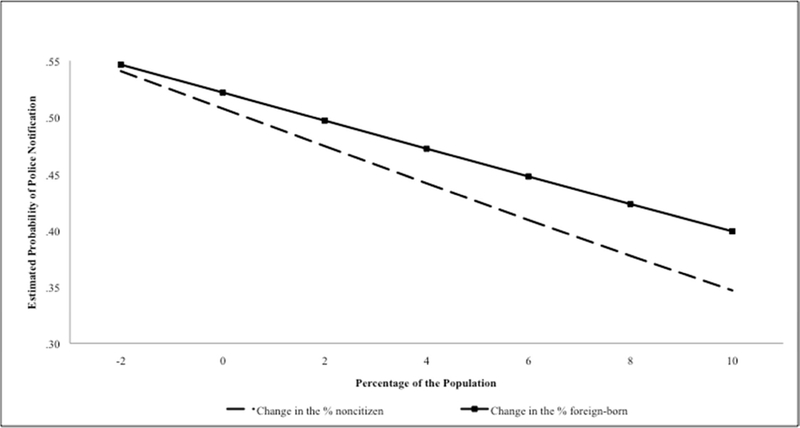
Estimated Pr4obabilities of Police Notification of Violent Crime by the Change in the % Noncitizen and Foreign-born Populations
Increases in the share of foreign-born residents exert similar effects on violent crime reporting. Among cities with stable rates in the foreign-born population, the probability that police are notified of violent crime is over 50%. In areas that experienced the most substantial increases in the rates of their foreign-born populations (i.e., San Jose, Fort Lauderdale, and Atlanta), however, the probability of violent crime reporting falls nearly 15 percent. Such results may occur because areas that experienced rapid increases in immigration may lack the services, cultural sensitivity, and overall infrastructure to accommodate the relationships between legal authorities and immigrant groups (i.e., noncitizen and foreign-born residents).
Discussion and Conclusion
Despite a great deal of theoretical and empirical attention dedicated to uncovering why most crimes remain unreported to the police, a consideration of the social contexts surrounding the reporting of crime has been relatively neglected in the research literature. However, there is reason to suggest that the level of immigration in a geographic area influences the extent to which crimes are reported to the police. Both qualitative and quantitative studies show that negative experiences with the law and legal authorities in their countries of origin partially influence immigrants’ perceptions of the American criminal justice system (e.g., Kirk et al., 2012; Menjívar & Bejarano, 2004; Tyler, Schulhofer, & Huq, 2010). Immigrants who experience harsh or oppressive legal systems may transfer their sentiments to officials in the U.S., regardless of whether they have any direct interaction with such authorities. Immigrants may also rationally decide not to report crime to the police because of their legal statuses considering the extent to which criminal and immigration policies have converged in recent years (see Coutin, 2011). For example, restrictive immigration policies have reemerged in recent decades, and especially in the wake of the 9/11 terrorist attacks. Moreover, immigration may relate to the underreporting of crime to the extent that cities with substantial growth in the relative size of immigrant groups may lack the infrastructure to accommodate and support immigrants’ unique needs.
While the total U.S. population grew about 13% between 1990 and 2000, the numbers of noncitizen and foreign-born residents each increased by nearly 60% during this period. Hence, the relative growth of immigrant populations outpaced increases in the overall population four times over. The relative rates of noncitizen and foreign-born populations in some metropolitan areas more than doubled in this decade (see Table 2). Scholars have speculated that increases in immigration should influence underreporting (e.g., Pogrebin & Poole, 1990), but, until now, no empirical study examined this hypothesis.
We investigated the relationship between changes in the relative sizes of the noncitizen and foreign-born populations and the likelihood of crime reporting by combining data from the 2002–2004 NCVS MSA file with socio-demographic estimates from the 1990 and 2000 decennial censuses. Our results substantiate the importance of immigrant concentration for understanding the likelihood that crimes are reported to the police. We find that increases in rates of both noncitizen and foreign-born residents are negatively related to the likelihood that the police are notified of crime within a metropolitan area. Growth in the relative size of the immigrant population exerts the strongest influence on the underreporting for violent crimes
In addition to filling a gap in the literature on the association between immigration and crime reporting, our results have important practical and policy implications. Investigating what predicts the underreporting of crime within local areas represents a critical area for research because the failure to report crime has enduring consequences for public safety. The police and courts remain unaware of and ostensibly powerless against most incidents that occur in their local jurisdictions as a result of low crime reporting. Residents in areas that experience low levels of crime reporting not only suffer grave safety consequences for uncontrolled crime, but also endure significant injustices as a result of unsupported victimizations and unpunished offenders who evade charges for their crimes. Or, as a police officer from a California metropolitan area puts it, “Crime multiples significantly if unreported and endangers everyone. Unresolved resentments grow in the community and can escalate” (Davis, Erez, & Avitabile, 2001, p. 188).
Our findings are not without limitations, however. Our data lack individual-level information on the nativity and citizenship status of NCVS respondents. Therefore, while we uncover a negative relationship between police notification rates and increases in immigration at aggregate levels, we do not know if it is immigrant residents themselves who are opting not to report victimizations. Rather, it could be that native-born citizens are likely to underreport victimizations in areas inhabited by many immigrants. Accordingly, future research must dedicate attention to the individual-level question of whether and why immigrants may be less likely than other groups to report victimizations to the police.
Our findings diverge to some extent by victimization type (i.e., property crime vs. violence). The reasons for this divergence deserve more research attention. Excerpts from qualitative interviews with legal officials suggest that immigrants face unique fears surrounding violence. For example, one police officer stated, “In some cultures, it brings greater shame on the family to report a crime such as rape or robbery to the police” (Davis, Erez, & Avitabile, 2001, p. 190). Other work finds that some cultural groups rely on interpersonal violence as an extra-legal method to resolve conflicts, rather than reporting incidents to the police (see Pogrebin & Poole, 1990). The inadequacy or corruption of criminal justice systems in the origin countries of immigrants may also influence whether immigrants in the United States will report victimizations to the police (e.g., Davis, Erez, & Avitabile, 1998; Schulhofer, & Huq, 2010; Tyler, Pogrebin & Poole, 1990). Given that our data lack information on the reasons why crimes remained unknown to the police, however, our explanation of the differences between underreporting of property and violent crimes as it relates to contextual measures of immigrant populations remains speculative.
Despite facing challenges and limitations, we nonetheless provide insight to our central research question: to what extent does the underreporting of crime to the police vary by characteristics of metropolitan areas, particularly changes in the relative sizes of the noncitizen and foreign-born populations? We uncovered a significant negative relationship between increases in the relative size of the immigrant population and the likelihood that police are notified of violent crimes.
Data
NCVS MSA
Our principal source of data is a special subset of the National Crime Victimization Survey (NCVS) produced by the Bureau of Justice Statistics (BJS) in conjunction with the Census Bureau. This dataset, the “National Crime Victimization Survey: Metropolitan Statistical Area Data, 1979–2004,” may be accessed through the Interuniversity Consortium for Political and Social Research (ICPSR) National Archive of Criminal Justice Data (NACJD) portal at: http://doi.org/10.3886/ICPSR04576.v1.
In the interest of providing the most current analysis possible of crime reporting trends by MSA, we draw upon the most recent years of data available from this dataset. We pool three years of data (2002–2004) in order to smooth year-to-year fluctuations in crime. The freely available data represent the information that has undergone a confidentiality review and has been altered to limit the risk of disclosure.
The NCVS MSA file provides information on persons aged 12 and over in “core” counties within the 40 largest MSAs as determined by the 1970 decennial census: http://icpsr.umich.edu/icpsrweb/NACJD/studies/4576/version/1.
Census
We also draw upon Census Bureau data for the purpose of measuring immigrant populations and other contextual characteristics.
Using a complete list of FIPS codes for the core counties that make up the 40 largest MSAs, we merge 1990 and 2000 census information to add socio-demographic information to our analyses. We transform the socio-demographic information from the 145 core counties to represent the 40 MSAs by performing a weighted average of the respective areas.
Lastly, we match the 1990 and 2000 decennial census data with the 2002-2004 NCVS MSA subset based on the MSA FIPS codes.
Acknowledgments
Funding
This material is based upon work supported by the National Science Foundation Graduate Research Fellowship Program under Grant No. [DGE-111007], as well as the Eunice Kennedy Shriver National Institute of Child Health and Human Development [T32 HD007081, R24 HD042849].
Footnotes
Declaration of Conflicting Interests
The authors declared no potential conflicts of interest with respect to the research, authorship, and/or publication of this article.
This measure includes the following types of victimizations: burglary, motor vehicle theft, and theft.
This measure includes the following types of victimizations: rape, sexual assault, robbery, aggravated assault, and simple assault.
As determined from the 1970 decennial census: http://www.icpsr.umich.edu/icpsr/NACJD/studies/4576/versionA
Contributor Information
Carmen M. Gutierrez, University of Texas at Austin, TX, USA
David S. Kirk, University of Oxford, Manor Road Building, Oxford, UK.
References
- Baumer EP (2002). Neighborhood disadvantage and police notification by victims of violence. Criminology, 40, 579–616. [Google Scholar]
- Baumer EP, & Lauritsen JL (2010). Reporting crime to the police, 1973–2005: A multivariate analysis of long-term trends in the national crime survey (NCS) and national crime victimization survey (NCVS). Criminology, 48, 131–185. [Google Scholar]
- Bennett RR, & Wiegand RB (1994). Observations on crime reporting in a developing nation. Criminology, 32, 135–148. [Google Scholar]
- Block R (1974). Why notify the police: The victim’s decision to notify the police of an assault. Criminology, 11, 555–569. [Google Scholar]
- Buikhuisen W (1975). Registered and non-registered crime. Den Hague, Netherlands: Research and Documentation Centre, Ministry of Justice. [Google Scholar]
- Coutin SB (2011). The rights of noncitizens in the United States. Annual Review of Law and Social Science, 7, 289–308. [Google Scholar]
- CQ Press. (2013). City Crime Rankings 2013. Available at: http://os.cqpress.com/citycrime/2012/CityCrime2013CityCrimeRankingsFactSheet.pdf
- Davis WE (1985). Language and the justice system: Problems and issues. Justice System Journal, 10, 353–364. [Google Scholar]
- Davis RC, Erez E, & Avitabile NE (1998). Immigrants and the criminal justice system: An exploratory study. Violence and Victims, 13, 21–30. [PubMed] [Google Scholar]
- Davis RC, Erez E, & Avitabile NE (2001). Access to justice for immigrants who are victimized: The perspectives of police and prosecutors. Criminal Justice Policy Review, 12, 183–196. [Google Scholar]
- Federal Bureau of Investigation. (2010). Crime in the United States, 2009. Washington, DC: U.S. Department of Justice; Available at: https://www2.fbi.gov/ucr/cius2009/documents/variablesaffectingcrime.pdf [Google Scholar]
- Felson RB, Messner SF, Hoskin AW, & Deane G (2002). Reasons for reporting and not reporting domestic violence to the police. Criminology, 40, 617–648. [Google Scholar]
- Fisher BS, Daigle LE, Cullen FT, & Turner MG (2003). Reporting sexual victimization to the police and others: Results from a national-level study of college women. Criminal Justice and Behavior, 30, 6–38. [Google Scholar]
- Gottfredson MR, & Hindelang MJ (1979). A study of the behavior of law. American Sociological Review, 44, 3–18. [Google Scholar]
- Goudriaan H, Wittebrood K, & Nieuwbeerta P (2006). Neighbourhood characteristics and reporting crime effects of social cohesion, confidence in police effectiveness, and socioeconomic disadvantage. British Journal of Criminology, 46, 719–742. [Google Scholar]
- Hart TC, & Rennison CM (2003). Reporting crime to the police, 1992–2000. Washington, DC: U.S. Department of Justice, Office of Justice Programs. [Google Scholar]
- Kirk DS, Papachristos AV, Fagan J, & Tyler TR (2012). The paradox of law enforcement in immigrant communities: Does tough immigration enforcement undermine public safety? The ANNALS of the American Academy of Political and Social Science, 641, 79–98. [Google Scholar]
- Langton L, Berzofsky M, Krebs C, & Smiley-McDonald H (2012). Victimizations not reported to the police, 2006–2010. Washington, DC: U.S. Department of Justice, Bureau of Justice Statistics. [Google Scholar]
- Laub JH (1981). Ecological considerations in victim reporting to the police. Journal of Criminal Justice, 9, 419–430. [Google Scholar]
- Meeker JW, & Dombrink J (1988). The undocumented and their legal needs. Humboldt Journal of Social Relations, 15, 105–132. [Google Scholar]
- Menjivar C, & Bejarano C (2004). Latino immigrants’ perceptions of crime and police authorities in the United States: A case study from the Phoenix metropolitan area. Ethnic and Racial Studies, 21, 120–148. [Google Scholar]
- Neuhaus JM, & Kalbfleisch JD (1998). Between-and within-cluster covariate effects in the analysis of clustered data. Biometrics, 54, 638–645. [PubMed] [Google Scholar]
- New York Times. (2014). Sir Robert Peel’s nine principles of policing. Available at: http://www.nytimes.com/2014/04/16/nyregion/sir-robert-peels-nine-principles-of-policing.html
- Passel JS, & Cohn D (2009). A portrait of unauthorized immigrants in the United States. Washington, DC: Pew Research Center, Pew Hispanic Center. [Google Scholar]
- Passel JS, & Cohn D (2012). U.S. foreign-born population: How much change from 2009 to 2010? Washington, DC: Pew Research Center, Pew Hispanic Center. [Google Scholar]
- Planty M (2014). Using NCVS for subnational estimates of victimization: A BJS update. Washington, DC: Justice Research and Statistics Association; Available at: http://www.jrsa.org/webinars/presentations/NCVSfinal.pdf [Google Scholar]
- Pogrebin MR, & Poole ED (1990). Culture conflict and crime in the Korean-American community. Criminal Justice Policy Review, 4, 69–78. [Google Scholar]
- Rand M, & Catalano S (2007). Criminal Victimization, 2006. Washington, DC: U.S. Department of Justice, Bureau of Justice Statistics. [Google Scholar]
- Sampson RJ, Raudenbush SW, & Earls F (1997). Neighborhoods and violent crime: A multilevel study of collective efficacy. Science, 277, 918–924. [DOI] [PubMed] [Google Scholar]
- Schwind HD (1984). Investigations of non-reported offenses In Block R (Ed.), Victimization andfear of crime: World perspectives, (pp. 65–75). Washington, DC: U.S. Department of Justice, National Institute of Justice. [Google Scholar]
- Skogan WG (1976). Citizen reporting of crime: some national panel data. Criminology, 13, 535–549. [Google Scholar]
- Skogan WG (1977). Dimensions of the dark figure of unreported crime. Crime &Delinquency, 23, 41–50. [Google Scholar]
- Skogan WG (1984). Reporting crimes to the police: The status of world research. Journal of Research in Crime & Delinquency, 21, 113–137. [Google Scholar]
- Truman J, & Langton L (2014). Criminal victimization, 2013. Washington, DC: U.S. Department of Justice, Bureau of Justice Statistics. [Google Scholar]
- Tyler TR, Schulhofer S, & Huq AZ (2010). Legitimacy and deterrence effects in counterterrorism policing: A study of Muslim Americans. Law & Society Review, 44, 365–402. [Google Scholar]
- U.S. Department of Justice, Bureau of Justice Statistics. (2007). NATIONAL CRIME VICTIMIZATION SURVEY: MSA DATA, 1979–2004 Conducted by U.S. Dept. of Commerce, Bureau of the Census. ICPSR04576-v1. Ann Arbor, MI: Inter-university Consortium for Political and Social Research [producer and distributor] 10.3886/ICPSR04576.v1 [DOI] [Google Scholar]
- Warner BD (1992). The reporting of crime: A missing link in conflict theory In Liska AE (Ed.), Social threat and social control (pp.71–87). Albany, NY: State University of New York Press. [Google Scholar]
- Xie M (2014). Area differences and time trends in crime reporting: Comparing New York with other metropolitan areas. Justice Quarterly, 31, 43–73. [Google Scholar]
References
- U.S. Census Bureau. (1990). County Quickfacts: All United States counties Retrieved August 30, 2014, from http://quickfacts.census.gov/.
- U.S. Census Bureau. (2000). County Quickfacts: All United States counties Retrieved August 30, 2014, from http://quickfacts.census.gov/.