

Abstract
Self-regulatory (SR) ability is an important resource for managing pain, but chronic pain patients experience chronic self-regulatory fatigue even when they are not in pain. Pressure pain thresholds (PPT) and pain inhibition are two mechanisms that differentiate people with and without chronic pain. It was hypothesized that trait SR ability would be associated with higher PPT and better pain inhibition, and that PPT and pain inhibition would be lower following high versus low SR fatigue. Three studies tested these hypotheses. Study 1 had 240 pain-free undergraduates complete measures of trait SR ability and PPT; 122 also provided data on pain inhibition. Study 2 had 38 of Study 1’s participants return for two additional sessions in which they underwent PPT testing conditions of high or low SR fatigue (within-person, counterbalanced). Study 3 repeated these procedures with pain inhibition as the outcome (n = 39). Results revealed that individual differences in SR ability were not associated with PPT or pain inhibition (all p’s < .05). Within people, neither PPT (F(1,36) = 1.57, p = .22) nor pain inhibition (F(1,37) = 1.79, p = .19) were significantly different under conditions of low versus high SR fatigue. Results do not support the hypotheses that PPT or pain inhibition associate with individual differences in trait SR ability or transient changes in state SR fatigue in the absence of the experience of pain. Instead, the SR deficits in chronic pain patients may arise from the experience of chronic pain.
1. Self-Regulatory Ability, Fatigue, and the Experience of Pain: Mechanistic Insights from Pain-Free Undergraduates
Pain demands attention and disrupts functioning across multiple domains (Boggero & Carlson, 2015; Eccleston & Crombez, 1999). Maintaining life activities in the face of pain thus requires overcoming the dominant response of attending to pain. The ability to self-regulate (SR), defined as the ability to alter dominant thoughts, actions, or behaviors, is therefore an important resource for managing pain (Solberg Nes, Roach, & Segerstrom, 2009). At the trait level, individual differences in SR ability predict adaptive health, occupational, and social outcomes via positive changes in behavior and affect, among other mechanisms (Baumeister & Tierney, 2012; de Ridder, Lensvelt-Mulders, Finkenauer, Stok, & Baumeister, 2012). At the state level, SR appears to be a fatigable resource, such that when two subsequent SR tasks are presented successively, performance on the second may be diminished by perceived or actual fatigue from effort exerted during the first (Baumeister, Tice, & Vohs, 2018; Hagger, Wood, Stiff, & Chatzisarantis, 2010; though see Hagger et al., 2016; Inzlicht & Schmeichel, 2012; and Inzlicht, Schmeichel & Macrae, 2014 for alternative explanations of trait self-regulatory capacity and Evans, Boggero, & Segerstrom, 2017, for factors that may influence the experience of self-regulatory fatigue).
Unfortunately, despite the importance of SR for managing pain, patients with chronic pain demonstrate SR fatigue (Solberg Nes et al., 2009). Women with chronic orofacial pain or fibromyalgia performed poorly at SR after experimentally manipulated high and low SR demand, whereas healthy controls only performed poorly after high SR demand (Solberg Nes, Carlson, Crofford, de Leeuw, & Segerstrom, 2010). In other words, for those with chronic pain, increasing fatigue did not further impair SR performance because they were already at low levels.
In a comparison of undergraduates scoring in the upper quartile of a daily pain measure and pain-free control participants, those in the daily pain group exhibited low SR ability under conditions of both high and low SR fatigue. Those in the control group only demonstrated poor SR performance in the high SR fatigue condition, replicating the findings in chronic pain populations (Hardy, 2013; Solberg Nes et al., 2010). The participants in the daily pain group had low levels of pain on the day of the study (M = 1.86 on a scale of 0–7), suggesting that those who have pain conditions may exhibit chronic SR fatigue even if they are not in pain.
At what point do the associations with pain and SR fatigue begin? Do those who may be more prone to pain (but have not developed pain) also demonstrate SR fatigue? The current studies aimed to assess the relationships between two physiological indices of pain proneness (pain thresholds and pain inhibition) and SR ability. Pain threshold and inhibition are impaired in chronic pain populations and have been etiologically linked to the development of chronic pain from acute pain (Millan, 2002; Yarnitsky, 2010).
Pain threshold refers to the amount of noxious stimulation required to notice pain. When pressure is gradually applied, it feels first like pressure and then like pain. The moment at which the sensation changes from pressure to pain is the pressure-pain threshold (PPT). Higher PPTs are indicative of lower sensitivity to pain, and chronic pain patients demonstrate lower PPTs than pain-free controls (Mikkelsson, Latikka, Kautiainen, Isomeri, & Isomäki, 1992; Schoenen, Bottin, Hardy, & Gerard, 1991).
Pain inhibition refers to the strength of the endogenous inhibitory system responsible for blocking ascending pain signals from reaching the brain (Pud, Granovsky, & Yarnitsky, 2009). Conditioned pain modulation (CPM), formerly known as diffuse-noxious inhibitory control, is a measure of pain inhibition. To assess CPM, pain thresholds on one body site are taken and then re-taken while a pain stimulus is administered at another body site. Because “pain inhibits pain,” thresholds taken during concurrent pain can be higher than those taken without; the difference between the two PPTs are reflective of inhibitory strength (Lewis, Rice, & McNair, 2012). CPM is not merely due to distraction (Moont et al., 2010), is clinically relevant for assessing pain conditions (Yarnitsky, 2010), and is a valid measure of supraspinally mediated pain inhibition which differentiates chronic pain patients and healthy controls (Lewis et al., 2012).
Three studies were conducted on pain-free undergraduates to test these associations between SR and pain proneness (PPT and pain inhibition). Study 1 tested the associations between potential indices of trait SR ability and pain proneness. Study 2 tested whether state SR fatigue lowered PPT. Study 3 tested whether state SR fatigue diminished pain inhibition. Learning the mechanisms by which SR influences pain can serve to curtail the cycle of SR fatigue and biopsychosocial dysfunction that characterizes the chronic pain experience (Boggero, Rojas-Ramirez, & Carlson, 2017; Solberg Nes et al., 2009).
2. Study 1: Individual Differences in Pain Thresholds, Pain Inhibition, and Self-Regulation
If SR is associated with lower PPT or pain inhibition in pain-free adults, it would suggest that SR deficits associated with chronic pain may have preceded the chronic pain condition and that common, stable traits account for pain-proneness and SR deficits.
No previous work has examined the association of trait SR with PPTs. However, neuroimaging evidence suggests that the dorsolateral prefrontal cortex underlies trait SR ability (Wagner & Heatherton, 2010), and stimulating it via transcranial direct current stimulation leads to increased pain thresholds in healthy volunteers (Boggio, Zagni, Lopes, & Fregni, 2008) and to reduction of both acute and chronic pain (Lefaucher, 2008; Rosen, Ramkumar, Nguyen, & Hoeft, 2009). Similarly, no previous work has examined trait SR and pain inhibition, but some studies have examined pain inhibition as a function of other psychological traits. In one study, dispositional optimism predicted higher CPM (i.e., more pain inhibition), but depression and pain catastrophizing - defined as an exaggerated negative mental set brought to bear during actual or anticipated painful experience (Sullivan et al., 2001) - did not (Goodin et al, 2013). In another, pain catastrophizing was associated with lower CPM (Goodin et al., 2009). A meta-analysis of 37 studies of CPM and psychological factors in healthy subjects and pain patients found no statistically significant relationships but noted a specific subgroup effect such that CPM was negatively correlated with anxiety in pressure-pain CPM tasks (as opposed to thermal-pain threshold CPM tasks; Nahman-Averbuch, Nir, Sprecher, & Yarnitsky, 2016). Taken together, there are several potential pathways by which SR might influence PPT and pain inhibition, but this is the first study to directly examine these relationships in healthy adults.
One challenge in testing these relationships is that there is no consensus on how to measure trait SR. Some self-report measures are well-validated for this purpose, but trait SR ability may also be measured by cognitive or physiological indexes (Evans, Boggero, & Segerstrom, 2016; Roth, Isquith, & Gioia, 2005; Segerstrom & Solberg Nes, 2007; Segerstrom, Boggero, & Evans, 2016; Tangney, Baumeister, & Boone, 2004). Executive functions are interrelated cognitive abilities including task-switching and working memory that allow people to plan and organize behavior. Task-switching and working memory have also been linked to adaptive pain outcomes (Berryman et al., 2013; Berryman et al., 2014; Boggero, Eisenlohr-Moul, & Segerstrom, 2016; Solberg Nes et al., 2009). Physiologically, resting heart rate variability is a measure of parasympathetic inhibition, reflects SR ability (Segerstrom & Solberg Nes, 2007), and serve as a resource for managing pain (Hassett et al., 2007; Koenig Jarczok, Ellis, Hillecke, & Thayer, 2014). Self-report, cognitive, and physiological indices of trait SR may thus each be associated with PPT or pain inhibition. A secondary and exploratory aim of Study 1 was to examine these domain-specific relationships.
It was hypothesized that higher trait SR would be associated with higher PPT and better pain inhibition. Post-hoc tests with self-report, cognitive, and physiological indices were exploratory.
2.1. Method
2.1.1. Participants
Two-hundred and forty undergraduates (51% female) agreed to participate in the study to fulfill a requirement for an introductory psychology course. Students read descriptions of studies and signed up on-line to participate for research credit (alternative methods for obtaining credit were provided). Eligibility criteria included: 18 years of age or older; no history of chronic pain disorders; no neurodegenerative, stroke, psychiatric, or neurological disorder; no current psychotropic, statin, blood pressure, or current pain medications (including over-the-counter pain medications in the past 24 hours); and no current pain (an answer of 0 on a 0–5 scale to the question of “What is your current, average level of daily pain?”). Participants were asked not to smoke or drink caffeine or alcohol for two hours prior to the experiment to ensure that pain outcomes were not influenced by these substances. If participants endorsed these behaviors, they were asked to reschedule their session. Sample A, collected in Fall 2012, consisted of n = 118 who provided PPT data only. Sample B, collected during Fall 2014 and Spring 2015, consisted of n = 122 who provided PPT and pain inhibition data. Thus, SR and PPT data were available for Samples A and B (N = 240), whereas pain inhibition data were only available for Sample B (see Figure 1 for a flowchart). Self-reported race of the full sample was 78.2% White, 11.4% African American, 4.8% Asian, 2.1% Hispanic, and 3.5% Other/mixed race. Mean age of the sample was 19.38 years (SD = 2.39, Range = 18–39).
Figure 1.
Flowchart of Participants and Tasks
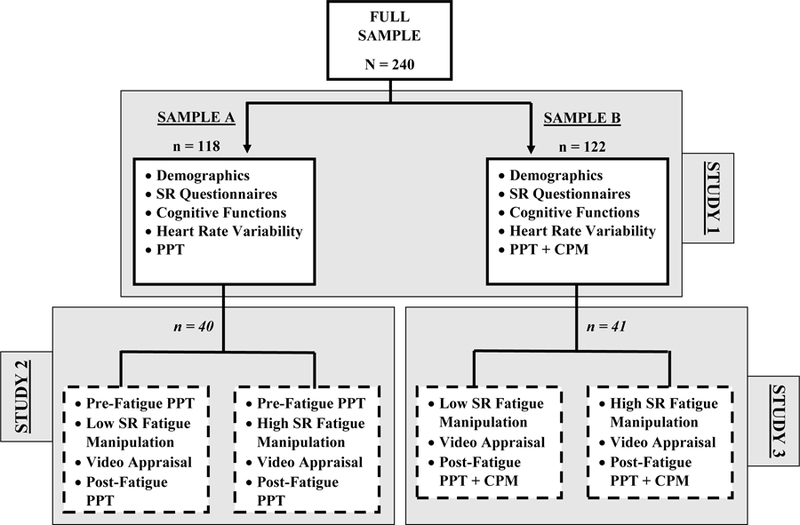
Note: N = Total sample size, n = sample size for those tasks. Italicized n for Studies 2 and 3 indicate that the sample was drawn from the Study 1 sample. Dashed boxes indicate that the sessions were administered within-subject, in counterbalanced order. SR = self-regulation; PPT = pressure pain threshold; CPM = conditioned pain modulation.
2.1.2. Procedures
Upon arriving at the lab, participants provided informed consent and were questioned by the experimenter to ensure that eligibility criteria were met. Participants were then connected to an electrocardiogram (ECG) to obtain a seven-minute baseline of heart rate variability (HRV). During this time, they completed self-report questionnaires. Following the baseline recording, blood pressure was recorded using a cuff on the nondominant arm. Next, PPT was assessed on three consecutive trials using a pressure algometer as described below. For those in sample B, pain inhibition was assessed following the initial PPT ratings using the CPM paradigm. After PPT or pain inhibition testing, participants completed task-switching and working memory tests. Finally, participants were detached from the HRV equipment, debriefed, and thanked for their participation. Experimenters were matched to the sex of the participant to diminish the effects of social desirability in pain reporting (Levine & Simone, 1991). All procedures were approved by the Institutional Review Board at the University of Kentucky.
2.1.3. Materials
Demographics.
Participants reported their age, sex, height, weight, and race. Height and weight were used to calculate body mass index (BMI).
Self-Regulation: Self-Report.
Self-Control Scale.
The Self-Control Scale Short Form (SCS) is composed of 13 items that measure trait SR (Tangney et al., 2004). Each item has 5 response options ranging from 1 “Not at all” to 5 “Very much.” A total score was computed by averaging across all 13 items; restraint and impulsivity subscale scores were also computed by averaging across 4 items for each subscale (Maloney, Grawitch, & Barber et al., 2012). The internal consistencies were α = .84 for the full scale, α = .68 for the restraint subscale, and α = .73 for the impulsivity subscale.
Behavior Rating Inventory of Executive Functions.
The Behavior Rating Inventory of Executive Functions- Adult Version (BRIEF) captures individuals’ views of their own SR abilities as they occur in everyday environments (Roth et al., 2005). Three subscales of the BRIEF were used. The Inhibit subscale assessed lack of behavioral inhibition (8 items), the Self-Monitor scale assessed lack of social inhibition (6 items), and the Emotion Regulation scale assessed lack of emotional inhibition (10 items). Participants rated how often each item had been a problem within the last month, with response options ranging from 1 “Never” to 3 “Often.” Scores were reverse coded so that higher scores indicated better SR. Internal consistencies were α = .72 for the Inhibit subscale, α = .73 for the Self-Monitor subscale, and α = .89 for the Emotion Regulation subscale.
Self-Regulation: Cognitive Functions.
Task-Switching.
Participants completed the Trail Making Tasks A and B. In Task A, participants drew lines connecting numbers in sequential order from smallest to largest while being timed. Faster completion reflects better psychomotor speed. In Task B, participants had the added challenge of alternating between numbers and letters. The difference in completion time between Task B and Task A is a valid measure of task-switching ability (Sanchez-Cubillo et al., 2009).
Working Memory.
The Digit Span portion of the Wechsler Adult Intelligence Scale, 4th Edition was used to assess working memory. This task had three components: Digit Span Forward (DSF), Digit Span Backwards (DSB) and Digit Span Sequencing (DSS). In DSF, the experimenter read a string of numbers and participants were asked to recite them in the same order. In DSB, participants were asked to recite the numbers beginning with last number and working backward to the first. In DSS, participants were asked to recite the numbers in order from smallest to largest. For each component, one point was awarded for each correct answer. When two mistakes were made on the same-length digit-string, the component was discontinued. Higher scores indicate better working memory.
Self-Regulation: Heart Rate Variability.
HRV was operationalized as log power in the high-frequency (0.15–0.40 Hz) spectrum of the interbeat interval series derived from the ECG. High-frequency HRV is the best indicator of parasympathetic vagal activity and has the most support as an index of self-regulatory ability (Laborde, Mosley, and Thayer, 2017; Segerstrom et al, 2016; Segerstrom & Solberg Nes, 2007; Solberg Nes et al., 2010); as such, it was the only HRV parameter examined. Participants sat quietly for seven minutes as they completed questionnaires. The first two minutes served as an acclimatization period, and data for that period were discarded. Data from the following five minutes were analyzed to provide baseline HRV. The ECG was sampled at 1000 samples/sec. To obtain the ECG, three Ag/AgCl electrodes with shielded leads were attached in Type II configuration. These leads were connected to an ECG150C Electrocardiogram Amplifier. Acqknowledge software (Biopac, Santa Barbara, CA) was used for data acquisition and storage. MindWare HRV software (MindWare, Cahana, OH) was used for data cleaning. Data were visually examined to ensure that beats were at the peak of the R wave. Erroneously placed beats (i.e., in other parts of the QRS complex) were deleted, and beats were added at R peaks that not initially detected. Movement artifacts (e.g., participant coughed or sneezed) were replaced by a beat at the midpoint of the two adjacent R peaks. Data were cleaned in 1-minute epochs and averaged across the 5 epochs. Blood pressure was collected using a cuff on the participant’s nondominant arm immediately following the HRV baseline.
Pressure Pain Threshold.
PPTs were measured via a pressure algometer with a rubber tip 1 cm in diameter. The algometer was placed on the intermediate phalange of the ring finger on the participant’s non-dominant hand, with pressure gradually increased by 30 kPA/sec (Staud et al., 2005). Participants were instructed to press a stop-button with their dominant hand at the moment when the sensation changed from pressure to pain. The algometer produced a reading of the amount of pressure being applied when the stop-button was pressed. To increase reliability, an average of three consecutive trials spaced 5 seconds apart were obtained. Internal consistency of the three trials was α = .94.
Pain Inhibition.
To assess pain inhibition, the CPM paradigm was used. PPTs were first collected as described above. Participants were then instructed to place their non-dominant bare foot in a circulating ice bath of 40° F. ice water. After 20 seconds, three consecutive PPT ratings spaced 5 seconds apart were again taken from the nondominant hand while the participant’s foot remained in the water. A CPM score was calculated by subtracting their first PPT score from their concurrent-pain PPT score. Higher scores indicated greater CPM (i.e., more effective pain inhibition). Internal consistency for the PPT while the foot was in the water was α = .95.
2.1.4. Data Analysis Plan
Prior to beginning data analysis, all variables were checked for missing data, normal distribution using a criterion of skew and kurtosis scores +/− 1, and outliers using a criterion of +/− 4 SD. Remedial actions were taken as described below. Bivariate correlations and descriptive statistics were obtained for all study variables. The aims of the study were to examine if SR variables were associated with PPT or pain inhibition. To test this aim, each SR measure was entered as a unitary predictor of PPT using linear regression. All models of PPT were run with and without BMI and sex entered as a covariate. Analysis were then repeated with CPM as the outcome. For all CPM models, BMI, sex, and exact water temperature were entered as covariates. Sex effects were examined because of well-established sex differences in PPT and pain inhibition (Chesterton, Barlas, Foster, & Baxter, 2003; Popescu, LeResche, Truelove, & Drangsholt, 2010). Additionally, all HRV models were run with and without systolic and diastolic blood pressure entered as covariates to control for potential confounding effects of HRV by blood pressure (Laborde et al., 2017).
2.2. Results
2.2.1. Missing Data and Remedial Actions
During the study, it was discovered that 18 people had used caffeine in the past two hours and four people had used tobacco in the past two hours, despite not reporting it at the beginning of the session. An additional 10 people revealed that they were in some pain. All analyses were run with and without these 30 people (two people endorsed more than one exclusion criterion). Removing these people did not substantively change any results; as such, reported models include data from all participants.
All variables were normally distributed except for task-switching, which was negatively skewed. Log transformation was used to correct the distributions. Task-switching was reverse-scored so that higher scores reflected better task-switching ability.
Three participants did not complete the SCS, leaving 237 cases available for analysis with that variable. Five participants did not complete the BRIEF, leaving 235 cases available. Ten participants did not complete the task-switching task due to experimenter error. An additional four people were removed because of stopwatch malfunction, leaving 227 cases available for analysis on task-switching. Five participants did not complete the working memory task due to shortage of time in the experimental session, leaving 235 cases available. HRV was not used for 11 people due to equipment error (i.e., electrodes became unstuck, computer malfunction) and one person’s value was windsorized at the −4 SD value. Three people refused to provide PPT, leaving 337 cases available for that variable. One person refused to put their foot in the cold water for the duration of the CPM task and data from an additional 2 people were windsorized at −4 SD from the mean, leaving 117 cases available for CPM.
2.2.2. Descriptive Statistics and Bivariate Correlations
Table 1 includes descriptive statistics and bivariate correlations among SR variables. Mean PPT was 268.20 kPA (SD = 91.90). Mean CPM was 35.02 kPA (SD = 52.32).
Table 1:
Descriptive Statistics and Bivariate Correlations
| 1. | 2. | 3. | 4. | 5. | 6. | 7. | 8. | 9. | 10. | 11. | |
|---|---|---|---|---|---|---|---|---|---|---|---|
| 1. Female Sex | 1 | ||||||||||
| 2. BMI | −0.11 | 1 | |||||||||
| 3. SCS Total | 0.01 | −0.09 | 1 | ||||||||
| 4. SCS- Imp | −0.15* | 0.11 | −0.86** | 1 | |||||||
| 5. SCS-Res | −0.11 | −0.09 | 0.80** | −0.54** | 1 | ||||||
| 6. BRIEF-Inh. | −0.02 | −0.11 | 0.61** | −0.57** | 0.44** | 1 | |||||
| 7. BRIEF-Emc. | −0.33** | −0.08 | 0.39** | −0.33** | 0.36** | 0.46** | 1 | ||||
| 8. BRIEF-Slf. | 0.02 | −0.15* | 0.49** | −0.52** | 0.30** | 0.64** | 0.39** | 1 | |||
| 9. Task-Switching (sec) | 0.05 | −0.03 | −0.04 | 0.06 | −0.06 | −0.07 | −0.04 | −0.09 | 1 | ||
| 10. Working Mem. | −0.16* | 0.03 | 0.04 | 0.01 | −0.02 | −0.01 | 0.04 | 0.02 | 0.16* | 1 | |
| 11. HRV (log HF power) | −0.15* | −0.05 | 0.05 | −0.05 | 0.06 | 0.14* | 0.11 | 0.04 | −0.04 | 0.02 | 1 |
| Possible range | 1–5 | 1–5 | 1–5 | 1–3 | 1–3 | 1–3 | 0–48 | ||||
| Mean | - | 23.95 | 3.43 | 2.48 | 3.18 | 2.28 | 2.47 | 2.44 | 31.55‡ | 28.19 | 6.25 |
| SD | - | 4.48 | 0.64 | 0.80 | 0.80 | 0.37 | 0.43 | 0.37 | 17.09‡ | 4.82 | 1.11 |
Note: = p <.05;
= p < .01.
Means and SD for the task-switching variable is from the untransformed B-A difference variable for ease of interpretation.
Abbreviations: BMI = Body mass index; BRIEF-Ecm = Emotional control subscale of the Behavior Rating Inventory of Executive Functioning; BRIEF-Inh = Inhibition subscale of the Behavior Rating Inventory of Executive Functioning; BRIEF-Slf = Self-monitoring subscale of the Behavior Rating Inventory of Executive Functioning; HRV = Heart rate variability; Mem = Memory; SCS = Self-control scale; SCS-Imp = Impulsivity subscale of the self-control scale; SCS-Res = Restraint subscale of the self-control scale.
2.2.3. Trait Self-Regulation Measures and Pressure Pain Thresholds
Independent linear regression models were run for each of the trait SR variables predicting PPT. Table 2 presents the results of models run with and without adjustment for sex and BMI. Trait SR measures were not significantly associated with PPT.
Table 2:
Univariate Analysis of Trait Self-Regulation Variables and Pressure Pain Thresholds
| DV: PPT, Without Covariates | DV: PPT, Controlling for Sex and BMI | ||||||
|---|---|---|---|---|---|---|---|
| Domain | Predictor | β | t | p | β | t | p |
| Self-Report | SCS Total | 0.04 | 0.66 | 0.51 | 0.05 | 0.80 | 0.43 |
| SCS-Imp | −0.03 | −0.47 | 0.64 | −0.03 | −0.45 | 0.67 | |
| SCS-Res | 0.07 | 1.06 | 0.29 | 0.10 | 1.46 | 0.15 | |
| BRIEF-Inh. | −0.09 | −1.29 | 0.20 | −0.08 | −1.18 | 0.24 | |
| BRIEF-Emc. | 0.03 | 0.47 | 0.64 | 0.01 | 0.17 | 0.87 | |
| BRIEF-Slf. | −0.06 | −0.93 | 0.35 | −0.06 | −0.91 | 0.37 | |
| Cognitive | Task-Switching (sec) | −0.01 | −0.15 | 0.88 | −0.03 | −0.40 | 0.69 |
| Working Mem. | 0.01 | 0.17 | 0.87 | <.001 | 0.01 | >0.99 | |
| Physiological | HRV‡ (log HF power) | −0.02 | −0.32 | 0.75 | −0.01 | −0.11 | 0.91 |
Note: HRV models were run with and without systolic and diastolic blood pressure entered as covariates; results were substantively similar and only unadjusted models are reported in the table.
Abbreviations: BMI = Body mass index; BRIEF-Ecm = Emotional control subscale of the Behavior Rating Inventory of Executive Functioning; BRIEF-Inh = Inhibition subscale of the Behavior Rating Inventory of Executive Functioning; BRIEF-Slf = Self-monitoring subscale of the Behavior Rating Inventory of Executive Functioning; DV = Dependent variable; HRV = Heart rate variability; Mem = Memory; PPT = Pressure pain threshold; SCS = Self-control scale; SCS-Imp = Impulsivity subscale of the self-control scale; SCS-Res = Restraint subscale of the self-control scale.
2.2.4. Trait Self-Regulation Measures and Pain Inhibition
Independent linear regression models were run for each of the trait SR variables predicting pain inhibition (CPM). Trait SR did not predict pain inhibition, even after adjusting for sex, BMI, and exact water temperature (Table 3).
Table 3:
Univariate Analysis of Trait Self-Regulation Variables and Conditioned Pain Modulation
| DV: CPM, Controlling for Water Temperature | DV: CPM, Controlling for Water Temperature, Sex, and BMI | ||||||
|---|---|---|---|---|---|---|---|
| Domain | Predictor | β | t | p | β | t | p |
| Self-Report | SCS Total | 0.06 | 0.60 | 0.55 | 0.05 | 0.52 | 0.61 |
| SCS-Imp | −0.09 | −0.90 | 0.37 | −0.08 | −0.77 | 0.44 | |
| SCS-Res | −0.10 | −1.02 | 0.31 | −0.10 | −0.95 | 0.35 | |
| BRIEF-Inh. | 0.04 | 0.36 | 0.72 | 0.04 | 0.43 | 0.67 | |
| BRIEF-Emc. | −0.05 | −0.45 | 0.67 | −0.002 | −0.02 | 0.99 | |
| BRIEF-Slf. | 0.002 | 0.02 | 0.98 | 0.02 | 0.20 | 0.84 | |
| Cognitive | Task-Switching (sec) | 0.04 | 0.40 | 0.69 | 0.09 | 0.85 | 0.40 |
| Working Mem. | 0.02 | −0.22 | 0.83 | −0.01 | −0.05 | 0.96 | |
| Physiological | HRV‡ (log HF power) | 0.01 | 0.11 | 0.91 | −0.03 | −0.27 | 0.79 |
Note: HRV models were run with and without systolic and diastolic blood pressure entered as covariates; results were substantively similar and are not included in the table.
Abbreviations: BMI = Body mass index; BRIEF-Ecm = Emotional control subscale of the Behavior Rating Inventory of Executive Functioning; BRIEF-Inh = Inhibition subscale of the Behavior Rating Inventory of Executive Functioning; BRIEF-Slf = Self-monitoring subscale of the Behavior Rating Inventory of Executive Functioning; CPM = Conditioned pain modulation (higher scores indicate more effective pain inhibition); DV = Dependent variable; HRV = Heart rate variability; Mem = Memory; SCS = Self-control scale; SCS-Imp = Impulsivity subscale of the self-control scale; SCS-Res = Restraint subscale of the self-control scale.
2.3. Discussion
The primary aim of the first study was to examine if trait SR was associated with PPT or pain inhibition in healthy, pain-free participants. Results from correlation and regression analyses failed to find any associations, regardless of how trait SR ability was operationalized. These results corroborate previous research that failed to find associations between trait psychological variables and PPT or pain inhibition (Geisser, Gaskin, Robinson, & Greene, 1993; Giesecke et al., 2005; Goodin et al., 2009; 2013; Lautenbacher et al., 1999; Nahman-Averbuch et al., 2016). Although trait SR may be an important consideration for how people manage functioning and maintain wellbeing in the face of pain (Boggero, Rojas, Carlson, & de Leeuw, 2016; Solberg Nes et al., 2009), it may not influence how sensitive people are to pain or how well they can inhibit it.
The lack of associations fails to support the idea of a “pain-prone” personality. Although chronic pain patients exhibit chronic SR fatigue, this effect does not generalize to pain-free but pain-prone populations. One possibility is that managing a chronic pain condition, that is, trying to maintain adequate levels of psychosocial functioning despite the pain, is taxing to SR ability. Over time, one would then expect to see these associations in chronic pain but not pain-free populations.
A secondary aim of the study was to examine the domain of SR that best predicted PPT or pain inhibition. First, it should be noted that self-report SR variables correlated in the expected directions with each other but were not meaningfully correlated with cognitive or physiological indices (Saunders, Milyavskaya, Etz, Randles, & Inzlicht, 2018). It may be that these are orthogonal components that are physiologically independently controlled but function together for a common purpose. Without corroboration between self-report, cognitive, and physiological indices of SR, it is difficult to know which – if any – are the best indicators of SR ability, and represents an important are for future theoretical and methodological inquiry. Although neither self-report, cognitive, or physiological indices significantly predicted PPT or pain inhibition, beta weights were slightly larger for self-report measures than for the other two domains. The Pain Catastrophizing Scale – a self-report measure of psychological responses to pain – often predicts pain sensitivity, disability, pain interference, and narcotic usage, among other pain outcomes, better than objective measures (see Quartana, Campbell, & Edwards, 2009 for a review).
Study 1 had several limitations. A select subset of measures were included in the battery; there are other self-report, EF, and physiological indices of trait SR that were not included, for example, cognitive inhibition tasks like the Stroop or go/no-go. Additionally, pain outcomes such as temporal summation could have also been included as dependent variables. A second limitation is that data were all cross-sectional. Cross-sectional data cannot answer how state SR fatigue changes people’s ability to sense or inhibit pain. To answer this question, a repeated-measure design is needed, where people provide PPT and CPM under conditions of low and high SR fatigue. Studies 2 and 3 provide that data.
3. Study 2: Influence of Self-Regulatory Fatigue on Pressure Pain Thresholds
Study 1 failed to link trait SR to pain proneness. The aim of Study 2 was to test whether under conditions of state SR fatigue, people report lower PPTs. No previous research has used a SR depletion manipulation to examine effects on PPTs.
Under conditions of high SR fatigue, people may be less able to tolerate pain. Participants were randomly assigned to a high-fatigue or a low-fatigue SR condition and underwent a cold-pressor task requiring them to submerge their hand in ice water and keep it there for as long as possible (Vohs, Baumeister, Schmeichel, Twenge, Nelson, & Tice, 2008). Participants in the high fatigue condition removed their hand from the water significantly sooner than participants in the low fatigue condition. However, it is unclear is these effects were due to changes in the perception of pain or to attempts to conserve SR resources. When participants were told they would need to engage in a third difficult task (as opposed to a third easy task), participants who expected the third task to be difficult removed their hand from the ice water sooner than the those who expected the third task to be easy, suggesting they were influenced by the expectation that enduring pain would tax their SR capability (Muraven, Shmueli, & Burkley, 2006). Thus, examining pain tolerance alone cannot speak to how participants actually experience pain; PPT measures are needed to answer that question.
Study 2 employed a repeated measures design to test whether participants’ PPT differed under conditions of low vs. high SR fatigue. It was hypothesized that under conditions of high SR fatigue, participants would be more sensitive to pain (i.e., have lower PPTs).
3.1. Method
3.1.1. Participants
The first 40 participants of Study 1’s Sample A (collected Fall 2012) were asked to return for two additional sessions to complete Study 2. The sample size was chosen based on previous research showing that 41 participants would be adequate to detect effect sizes of d = 0.55 or larger in PPT differences using a between-subject design (Riley et al., 1998); by using a within-subject design in which participants serve as their own controls, 40 was considered a conservative sample size. Eligibility criteria for Study 2 were the same as those for Study 1. Self-reported race of the Study 2’s sample was 75.0% White, 12.5% African American, and 12.5% Hispanic. Mean age of the sample was 19.65 years (SD = 3.06, Range = 18–36), and 52.5% of the sample was female.
3.1.2. Procedures
All participants gave informed consent prior to beginning the experiment. Experimenters were again matched to the sex of the participant for all sessions. The first session for Study 2 was conducted between one day and two weeks following the Study 1 session.
At the start of the session, participants provided a 7-min ECG baseline as described in Study 1 followed by three consecutive pre-fatigue fatigue PPT ratings. They were then randomly assigned to undergo either a high or low SR fatigue task. In the high-fatigue condition, participants watched a video of a woman’s face. During the video, words flashed on the bottom of a screen. Participants were instructed to ignore the words and remain focused on the woman’s face. In the low-fatigue condition, participants watched the same video but were not given specific instructions to ignore the words. This visual attention task has been widely used as a SR fatigue manipulation; because the dominant response is to shift attention to new stimuli in the visual field, and inhibiting that response draws on SR resources (Hagger et al., 2010). Participants were asked to rate the difficulty of the video task immediately following the completion of the video. Next, participants provided three consecutive PPT ratings 5 sec apart immediately following the fatigue task. The second session was identical to the first, with the exception that participants underwent the opposite fatigue manipulation as in the previous session. Participants completed other questionnaires and tasks that were not analyzed for the current study and have been reported in detail elsewhere (Boggero, 2013).
3.1.3. Materials
HRV.
Baseline HRV was collected, cleaned, and analyzed at both sessions as described in Study 1.
Task Appraisal.
Following the fatigue task, participants completed a seven-item questionnaire assessing the perceived difficulty of the task. Each item was rated on a seven-point scale ranging from 1 “Not at all” to 7 “Very much.” A score was obtained by averaging across all items. Internal consistency of the task appraisal questionnaire was α = .87 in the low fatigue condition and α = .89 in the high fatigue condition.
Pain Thresholds.
PPT was measured using a pressure algometer as described in Study 1. Participants provide three PPT ratings spaced 5 seconds apart at the start of each session and three post-fatigue ratings at the end of each session, after the fatigue manipulation. Averages of the three ratings were taken at each occasion. In the low SR condition, internal consistencies for ratings before and after the fatigue manipulation were α = .97 and α = .97, respectively. In the high SR condition, internal consistencies were α = .97 and α = .96, respectively. Within-session changes in pain thresholds were calculated by subtracting pre-fatigue PPT from PPT obtained immediately following the fatigue manipulation. Negative numbers indicate that people became less sensitive to pain after the fatigue manipulation, whereas positive numbers indicate that people became more sensitive to pain.
3.1.4. Data Analysis Plan
First, data were checked for missingness, distributions, and outliers as described in Study 1. A manipulation check used a paired-samples T-test to test if task-appraisal rating differed between the low and high SR fatigue conditions. Cohen’s D between the low and high fatigue condition was calculated using the means and sample size from both groups and the pooled standard deviation. To test whether SR fatigue influenced people’s PPTs, a repeated measure ANOVA was conducted with within-session PPT change as the repeated measure. Models were run with and without sex, BMI, and order (i.e., high SR fatigue in the first session and low SR fatigue in the second, or vice versa) entered as covariates. An exploratory analysis tested whether inhibitory SR ability, as indexed by the average baseline HRV across the three study sessions (Study 1 visit + 2 Study 2 visits; α = .74), interacted with fatigue condition to predict changes in PPT. If such an interaction were found it would suggest that those with greater SR ability may be more resistant to SR-fatigue-induced changes in PPT.
3.2. Results
3.2.1. Missing Data and Remedial Actions
Two participants completed only one of the two sessions for Study 2, leaving 38 cases available for analysis. Of those, seven participants endorsed violating one of the exclusion criteria prior to one of the two sessions (n = 1 for tobacco use, n = 1 for over the counter pain medication in the past 2 hours, n = 5 for having mild pain at the time of one of the sessions). All models were run with and without these seven participants, and there were no substantive differences in the results. Models below therefore include data from these participants. There were no outliers for the task-appraisal questionnaire. All variables were normally distributed.
3.2.2. Manipulation Check
The video task was rated as significantly more fatiguing in the high fatigue condition (M = 3.44, SD = 1.44) than the low fatigue condition (M = 3.10, SD = 1.34), suggesting that the SR manipulation worked as intended (F(1,36) = 4.47, p = 0.04, Cohen’s d = 0.24).
3.2.3. Changes in PPT following SR Fatigue
Within-session changes in PPT were small and similar in the low fatigue condition (M = −9.32, SD = 43.80) compared with the high fatigue condition (M = 2.49, SD = 31.33), F (1, 36) = 1.57, p = 0.22, Cohen’s d = 0.31, suggesting that the laboratory manipulation of SR fatigue did not make people more sensitive to pain. Similar results were obtained when sex, BMI, and order were entered as covariates in the model (F (1, 24) = 1.11, p = 0.30).
3.2.4. HRV Predicting changes in PPT following SR Fatigue
Baseline HRV did not interact with SR fatigue condition to predict changes in pain inhibition, F (1, 35) = 0.32, p = 0.58.
3.3. Discussion
Study 2 did not find evidence linking state SR and PPT. Results instead suggest that people are similarly sensitive to pain under conditions of high and low SR fatigue. It should be noted that the observed means were in the hypothesized directions; in the high fatigue condition, people were more sensitive to pain than in the low fatigue condition. It is unclear if a difference of approximately 12 kpas represents a clinically significant change in PPT between the conditions. One important consideration is that PPTs are not consistently associated with thermal pain thresholds, and there is debate regarding which are most clinically meaningful for predicting outcomes in chronic pain populations (Langemark, Jensen, Jensen, & Olesen, 1989; Riley et al., 1998). Future research should examine if SR fatigue is associated to people being more sensitive to thermal pain.
Even though Study 2 did not find support for SR fatigue changing people’s PPT, the relationship between SR fatigue and chronic pain could be due to SR fatigue negatively influencing people’s ability to inhibit pain. Study 3 sought to test this possibility.
4. Study 3: Influence of SR Fatigue on Pain Inhibition
Study 3 used a CPM paradigm to test whether state SR fatigue influenced pain inhibition. It was predicted that SR fatigue would diminish participants ability to effectively inhibit pain.
4.1. Method
4.1.1. Participants
The first 41 participants of Study 1’s Sample B (collected Spring 2015) were asked to return for two additional sessions to complete Study 3. Eligibility criteria for Study 3 were the same as those for Studies 1 and 2. Self-reported race of the Study 3’s sample was 65.9% White, 17.1% African American, 7.8% Asian, and 9.7% Other or not reported. Mean age of the sample was 19.47 years (SD = 3.48, Range = 18–39), and 43.9% of the sample was female.
4.1.2. Procedures
All participants gave informed consent prior to beginning the experiment. Experimenters were again matched to the sex of the participant for all sessions to diminish the effects of social desirability in pain reporting (Levine & Simone, 1991). The first session for Study 3 was conducted between one day and two weeks following the Study 1 session, based on the participant’s availability.
Prior to the session, participants were randomly assigned to undergo either a high- or low-fatiguing task using the video manipulation described in Study 2. They provided a 7-min ECG baseline as described in Study 1 and then watched the video. Immediately after the video, participants were asked to rate the difficulty of the video task as a manipulation check. Next, participants provided PPT ratings on three consecutive trials. They then provided three more PPT rating while their nondominant bare foot was in ice water. After these three ratings they were instructed to remove their foot from the water. The following session, occurring between 1 day to 2 weeks later, was identical with the exception that participants underwent the opposite fatigue manipulation as their previous session. Only tasks pertinent to the current study are described; for all tasks performed, see Boggero (2013).
4.1.3. Materials
HRV.
Baseline HRV was collected, cleaned, and analyzed at both sessions as described in Study 1.
Task Appraisal.
Task appraisal was assessed as in Study 2. Internal consistency of the task appraisal questionnaire was α = .88 in the low fatigue condition and α = .87 in the high fatigue condition.
Pain Inhibition.
Pain inhibition was assessed after the SR fatigue manipulation using the CPM paradigm as described in Study 1. In the low SR fatigue condition, internal consistencies for the three original PPT and pain-concurrent PPT were α = .94 and α = .94, respectively. In the high SR fatigue condition, internal consistencies for their original PPT and pain-concurrent PPT were α = .93 and α = .95.
4.1.4. Data Analysis Plan
First, data were checked for missingness, distributions, and outliers. A manipulation check used a paired-samples T-test to test if task-appraisal rating differed between the low and high SR fatigue conditions. Cohen’s D between the conditions was calculated using the means and sample size from both conditions and the pooled standard deviation. To test whether SR fatigue influenced people’s pain inhibition, a repeated measure ANOVA was conducted with CPM as the repeated measure. Models were run with and without sex, BMI, water temperature, and order as covariates. An exploratory analysis tested whether inhibitory SR ability, as indexed by the average baseline HRV across the three study sessions (Study 1 visit + 2 Study 3 visits; α = .64), interacted with fatigue condition to predict changes in pain inhibition. If such an interaction were found it would suggest that those with greater SR ability may be more resistant to SR-fatigue-induced changes in pain inhibition.
4.2. Results
4.2.1. Missing Data and Remedial Actions
Two participants completed only one of the two sessions for Study 3, leaving 39 cases available for analysis. Of those, nine participants endorsed violating one or more of the exclusion criteria prior to one of the two sessions (n = 2 for tobacco use, n = 1 for over the counter pain medication in the past 2 hours, n = 3 for having mild pain at the time of one of the sessions, n = 6 for caffeine in the past two hours). All models were run with and without these participants, and there were no substantive differences in the results. Models below therefore include data from these participants. There were no outliers for CPM or task-appraisal variables in either condition. All variables were normally distributed.
4.2.2. Manipulation Check
The video task was rated as more fatiguing in the high fatigue condition (M = 3.59, SD = 1.34) than the low fatigue condition (M = 3.13, SD = 1.45) with an effect size similar to that obtained in Study 2, although the difference was not statistically significant, F(1,37) = 3.50, p = 0.069, Cohen’s d = 0.33.
4.2.3. Changes in Pain Inhibition following Self-Regulatory Fatigue
CPM scores were similar in the low fatigue condition (M = 45.56, SD = 48.20) and in the high fatigue condition (M = 33.48, SD = 51.13), F (1, 37) = 1.79, p = 0.19, Cohen’s d = 0.24, suggesting that SR fatigue did not adversely affect people’s ability to inhibit pain. Results were similar when sex, BMI, water temperature, and order were entered as covariates (F (1, 29) = 0.42, p = 0.52).
3.2.4. HRV Predicting changes in Pain Inhibition following SR Fatigue
Baseline HRV did not interact with SR fatigue condition to predict changes in pain inhibition, F (1, 36) = 1.04, p = 0.58.
4.3. Discussion
Study 3 did not find support linking state SR fatigue and CPM. As in Study 2, the means were in the expected directions: CPM was less effective under conditions of high SR fatigue, although the difference was not statistically significant. Study 3 was the first to examine how pain inhibition changes under conditions of SR fatigue. Further, it is one of the few studies to examine how psychological factors relate to pain inhibition in healthy populations. The results from Study 3 provide compelling data that these relationships should continue to be explored in future research.
5. General Discussion
People with chronic pain exhibit SR fatigue under non-fatiguing conditions (Solberg Nes et al., 2010), even when they are not experiencing pain (Hardy, 2013). The goal of the current study was to examine when associations with pain and SR fatigue might begin. Specifically, the studies tested if those who may be more prone to pain conditions - that is, people who have lower PPTs or CPM - also demonstrate SR deficits. The current studies failed to support any associations linking PPT or CPM with state or trait SR ability. The largest correlation between PPT or pain inhibition and any SR measure was r = .10. Results for state SR ability lowering PPT or CPM were equivocal, as means were in the expected directions. Effect sizes were small in the metric of psychological research but typical of psychological correlates of CPM (Nahman-Averbuch et al., 2016). The effects did not reach statistical significance, and the clinical significance of this magnitude of change is unknown.
If indeed there are no relationships between trait or state SR and PPT or CPM, it suggests that the relationships observed in chronic pain populations are a function of pain chronicity. In other words, individual differences in SR ability do not account for diminished PPT or CPM, nor does SR fatigue alter PPT or CPM. Instead, diminished PPT or CPM may emerge from frequent SR demands occuring over longer periods of time. Specifically, living with a chronic pain condition requires more than merely managing pain - it requires maintaining social, occupational, and recreational functioning despite pain (Amtmann et al., 2010; Solberg Nes et al., 2007). Such persistence likely draws on regulatory resources (Boggero et al., 2016; Boggero et al., 2017). Thus, the chronic SR fatigue observed in chronic pain may not be due to pain in and of itself, but rather to the cumulative effects of persisting in the face of pain, explaining why effects are seen in chronic pain but not in pain-free samples. To definitively test this hypothesis, longitudinal data on pain, SR, and pain-related interference are needed.
To date, the literature on SR and pain has largely examined how pain taxes SR resources, or, in the case of the current studies, how SR fatigue influences pain proneness. Yet, the relationships between SR and chronic pain could also result from diminished SR recovery after exertion. Our unpublished data suggests that SR abilities largely recover after 15 minutes in healthy undergraduate populations. No study to our knowledge has examined SR recovery profiles in people with chronic pain. Pain is known to result from the dysregulation of various homeostatic physiological systems (Chen, Nackley, Miller, Diatchenko, & Maixner, 2013). It therefore makes sense that the homeostatic mechanism that restores SR ability after exertion may be dysregulated as a result of being in chronic pain. If this were the case, it would suggest that the chronic SR fatigue observed in chronic pain is the result of multiple pathways: first, high SR effort in trying to maintain functioning, but second, a diminished ability to recovery after SR fatigue. This view is entirely speculative but should be further investigated.
The current study failed to find any associations between baseline HRV and PPT or pain inhibition; it also failed to find any protective effects of high baseline HRV against SR-fatigue-induced changes in PPT or pain inhibition. These results are surprising given that others have demonstrated HRV serves as an important resource for managing pain (Boggero & Segerstrom, in press; Carlson, Bertrand, Ehrlich, Maxwell, & Burton, 2001; Evans, Eisenlohr‐Moul, Button, Baer, & Segerstrom, 2014) and regulating emotions (Geisler, Vennewald, Kubiak, & Weber, 2010; Thayer and Lane, 2000). One possibility is a restriction of HRV range due to the sample, although relationships have been found in other young, healthy samples. Another possibility is that HRV may be less tied to how people perceive pain but more tied to how they cope with it behaviorally and psychologically. Future work should explicitly test these and other possibilities for how HRV may or may not serve as a resource for managing pain.
Results from the current studies highlight important areas for future work. Studies 2 and 3 found large variance in PPT and CPM following SR fatigue, suggesting potential moderation. It may be that SR fatigue influences how some people but not others experience and inhibit pain. None of the Study 1 SR variables served as significant moderators of the Study 2 or 3 results (results not shown), but other potential moderators likely exist. One possibility is that differences in the catechol-O-methyltransferase gene moderate this response, as this gene has been implicated in responses to certain pain medications, among other pain outcomes (Tchivileva et al., 2010). Personality characteristics like neuroticism or pain catastrophizing may also be associated with effects of SR on pain outcomes (Goubert, Crombez, & Van Damme, 2004). Interestingly, sex did not moderate any of the relationships, despite being implicated as an important covariate when assessing PPT and CPM. In order to truly understand the complex nature of these relationships, a biopsychosocial model with interactions between biological, psychological, and social factors could be tested.
Findings from the current studies should be interpreted with several limitations in mind. In Studies 2 and 3, adherence to the SR fatigue task could not be estimated. Nevertheless, the manipulation checks and the directions of the means suggested that the video worked as intended. An open question is whether the strength of the SR fatigue manipulation influences pain outcomes. It may be that a more extreme fatigue manipulation would have produced the hypothesized results.
Another important limitation of Studies 2 and 3 is that there was the potential for cohort effects. Participants were not randomly assigned into either Study 2 or Study 3 (see Figure 1). Although participants who did Study 1 only did not differ from those who also did Study 2 or 3 on any SR or pain variable (results not shown), it is possible that the samples differed in unmeasured personality variables (Aviv, Zelenski, Rallo, & Larsen, 2002). In the future, random assignment can be used to assign people to the studies.
A third limitation pertains to the generalizability of results. The current studies only included healthy, pain-free undergraduates. Results can therefore not be generalized to older samples or to populations with chronic pain. Although people with chronic pain exhibited chronic SR fatigue (Solberg Nes et al., 2009), no study to date has tested how inductions of SR fatigue influence pain thresholds or inhibition in this population. Further, the current study only assessed pressure-pain thresholds in the presence and absence of temperature pain. Pressure-pain thresholds are only moderately correlated to thermal pain thresholds and rely on different physiological mechanisms (Lautenbacher Kunz, Strate, Nielsen, & Arendt-Nielsen, 2005), and pain inhibition responses using different CPM paradigms are uncorrelated (Lewis et al., 2012; Nahman-Averbuch et al., 2013). Future work should aim to replicate this study with different samples, and with different measures of pain thresholds and inhibition.
Finally, the current studies used HRV extracted from the last 5 min of a 7 min baseline recording to assess trait SR ability. The purpose of the autonomic nervous system is to adapt peripheral physiology to changing environmental and internal demands, and about 40% of the variance of a single HRV measurement can be explained by effects of the situation and person–situation interaction (Bertsch, Hagemann, Naumann, Schächinger, Schulz, 2012). However, that leaves substantial trait variance, and in Studies 3 and 4, use of the average of 2 measurements would have isolated that variance further. Future work should aim to test whether longer or repeated HRV recordings are associated with PPT or pain inhibition.
Despite these limitations, the studies had considerable strengths. Allowing only healthy, pain-free undergraduates to participate provided high internal validity for testing the hypotheses. The within-subject design of Studies 2 and 3 allowed people to serve as their own controls - a feature that is particularly important when studying inherently subjective pain outcomes. Perhaps the most important strength, however, is that the studies cumulatively suggest that chronic experience of pain leads to SR fatigue. If future work can elucidate what part of pain chronicity underlies this relationship, important targets for interventions can be uncovered.
Acknowledgments
This work was supported by the National Institute on Aging of the National Institutes of Health (grant numbers F31AG048692, K02-AG033629).
Footnotes
The Authors declare that there is no conflict of interest.
References
- Amtmann D, Cook KF, Jensen MP, Chen WH, Choi S, Revicki D, ... & Lai JS (2010). Development of a PROMIS item bank to measure pain interference. Pain, 150(1), 173–182. 10.1016/j.pain.2010.04.025 [DOI] [PMC free article] [PubMed] [Google Scholar]
- Aviv AL, Zelenski JM, Rallo L, & Larsen RJ (2002). Who comes when: Personality differences in early and later participation in a university subject pool. Personality and Individual Differences, 33(3), 487–496. 10.1016/S0191-8869(01)00199-4 [DOI] [Google Scholar]
- Baumeister RF, Tice DM, & Vohs KD (2018). The strength model of self-regulation: Conclusions from the second decade of willpower research. Perspectives on Psychological Science, 13(2), 141–145. Doi: 1o0i.1or1g7/170/.1177475/617941561971761767914669 [DOI] [PubMed] [Google Scholar]
- Baumeister RF, & Tierney J (2012). Willpower: Rediscovering the greatest human strength Penguin. [Google Scholar]
- Berryman C, Stanton TR, Bowering KJ, Tabor A, McFarlane A, & Moseley GL (2013). Evidence for working memory deficits in chronic pain: a systematic review and meta-analysis. Pain, 154(8), 1181–1196. 10.1016/j.pain.2013.03.002 [DOI] [PubMed] [Google Scholar]
- Berryman C, Stanton TR, Bowering KJ, Tabor A, McFarlane A, & Moseley GL (2014). Do people with chronic pain have impaired executive function? A meta-analytical review. Clinical Psychology Review, 34(7), 563–579. 10.1016/j.cpr.2014.08.003 [DOI] [PubMed] [Google Scholar]
- Bertsch K, Hagemann D, Naumann E, Schächinger H, & Schulz A (2012). Stability of heart rate variability indices reflecting parasympathetic activity. Psychophysiology, 49(5), 672–682. 10.1111/j.1469-8986.2011.01341.x [DOI] [PubMed] [Google Scholar]
- Boggero IA (2013). Relationships among pain threshold, self-regulation, executive functioning, and autonomic activity: A general inhibitory system perspective
- Boggero IA, Eisenlohr-Moul TA, & Segerstrom SC (2016). Task-switching ability protects against the adverse effects of pain on health: A longitudinal study of older adults. British Journal of Health Psychology, 21, 434–450. 10.1111/bjhp.12178 [DOI] [PMC free article] [PubMed] [Google Scholar]
- Boggero IA, Rojas Ramirez MV, & Carlson CR (2017). All fatigue is not created equal: The association of fatigue and its subtypes on pain interference in orofacial pain. The Clinical Journal of Pain, 33(3), 231–237. 10.1097/AJP.0000000000000391 [DOI] [PMC free article] [PubMed] [Google Scholar]
- Boggero IA, Rojas MV, Carlson CR, & de Leeuw R (2016). Satisfaction with life in orofacial pain disorders: Associations and theoretical implications. Journal of Oral & Facial Pain and Headache, 30(2), 99–106. 10.11607/ofph.1526. [DOI] [PMC free article] [PubMed] [Google Scholar]
- Boggero IA, & Segerstrom SC (in press). Maintenance of positive affect following acute pain in younger and older adults. Journal of Behavioral Medicine. [DOI] [PMC free article] [PubMed]
- Boggio PS, Zaghi S, Lopes M, & Fregni F (2008). Modulatory effects of anodal transcranial direct current stimulation on perception and pain thresholds in healthy volunteers. European Journal of Neurology, 15, 1124–1130. 10.1111/j.1468-1331.2008.02270.x [DOI] [PubMed] [Google Scholar]
- Carlson CR, Bertrand PM, Ehrlich AD, Maxwell AW, & Burton RG (2001). Physical self-regulation training for the management of temporomandibular disorders. Journal of Orofacial Pain, 15 (1), 47–55. [PubMed] [Google Scholar]
- Chen H, Nackley A, Miller V, Diatchenko L, & Maixner W (2013). Multisystem dysregulation in painful temporomandibular disorders. The Journal of Pain, 14(9), 983–996. 10.1016/j.jpain.2013.03.011 [DOI] [PMC free article] [PubMed] [Google Scholar]
- Chesterton LS, Barlas P, Foster NE, Baxter GD, & Wright CC (2003). Gender differences in pressure pain threshold in healthy humans. Pain, 101(3), 259–266. [DOI] [PubMed] [Google Scholar]
- de Ridder DT, Lensvelt-Mulders G, Finkenauer C, Stok FM, & Baumeister RF (2012). Taking stock of self-control: A meta-analysis of how trait self-control relates to a wide range of behaviors. Personality and Social Psychology Review, 16(1), 76–99. 10.1177/1088868311418749 [DOI] [PubMed] [Google Scholar]
- Eccleston C, & Crombez G (1999). Pain demands attention: A cognitive–affective model of the interruptive function of pain. Psychological Bulletin, 125(3), 356–366. [DOI] [PubMed] [Google Scholar]
- Evans DR, Boggero IA, & Segerstrom SC (2016). Explaining self-regulatory fatigue and ‘ego depletion’: Lessons from physical fatigue. Personality and Social Psychology Review, 20(4), 291–310. 10.1177/1088868315597841 [DOI] [PMC free article] [PubMed] [Google Scholar]
- Evans DR, Eisenlohr‐Moul TA, Button DF, Baer RA, & Segerstrom SC (2014). Self‐regulatory deficits associated with unpracticed mindfulness strategies for coping with acute pain. Journal of Applied Social Psychology, 44(1), 23–30. 10.1111/jasp.12196 [DOI] [PMC free article] [PubMed] [Google Scholar]
- Geisler FC, Vennewald N, Kubiak T, & Weber H (2010). The impact of heart rate variability on subjective well-being is mediated by emotion regulation. Personality and Individual Differences, 49 (7), 723–728. 10.1016/j.paid.2010.06.015 [DOI] [Google Scholar]
- Geisser ME, Gaskin ME, Robinson ME, & Greene AF (1993). The relationship of depression and somatic focus to experimental and clinical pain in chronic pain patients. Psychology and Health, 8(6), 405–415. 10.1080/08870449308400445 [DOI] [Google Scholar]
- Giesecke T, Gracely RH, Williams DA, Geisser ME, Petzke FW, & Clauw DJ (2005). The relationship between depression, clinical pain, and experimental pain in a chronic pain cohort. Arthritis & Rheumatism, 52(5), 1577–1584. 10.1002/art.21008 [DOI] [PubMed] [Google Scholar]
- Goodin BR, McGuire L, Allshouse M, Stapleton L, Haythornthwaite, … Edwards RR (2009). Associations between catastrophizing and endogenous pain-inhibitory processes: Sex differences. Journal of Pain, 10, 180–190. 10.1016/j.jpain.2008.08.012 [DOI] [PubMed] [Google Scholar]
- Goodin BR, Kronfli T, King CD, Glover TL, Sibille K, & Fillingim RB (2013). Testing the relation between dispositional optimism and conditioned pain modulation: does ethnicity matter? Journal of Behavioral Medicine, 36(2), 165–174. 10.1007/s10865-012-9411-7 [DOI] [PMC free article] [PubMed] [Google Scholar]
- Goubert L, Crombez G, & Van Damme S (2004). The role of neuroticism, pain catastrophizing and pain-related fear in vigilance to pain: a structural equations approach. Pain, 107(3), 234–241. [DOI] [PubMed] [Google Scholar]
- Hagger MS, Wood C, Stiff C, & Chatzisarantis NL (2010). Ego depletion and the strength model of self-control: a meta-analysis. Psychological Bulletin, 136, 495–525. 10.1037/a0019486 [DOI] [PubMed] [Google Scholar]
- Hagger MS, Chatzisarantis NL, Alberts H, Anggono CO, Batailler C, Birt AR, ... & Calvillo DP (2016). A multilab preregistered replication of the ego-depletion effect. Perspectives on Psychological Science, 11(4), 546–573. 10.1177/1745691616652873 [DOI] [PubMed] [Google Scholar]
- Hassett AL, Radvanski DC, Vaschillo EG, Vaschillo B, Sigal LH, Karavidas MK, ... & Lehrer PM (2007). A pilot study of the efficacy of heart rate variability (HRV) biofeedback in patients with fibromyalgia. Applied Psychophysiology and Biofeedback, 32(1), 1–10. 10.1007/s10484-006-9028-0 [DOI] [PubMed] [Google Scholar]
- Inzlicht M, & Schmeichel BJ (2012). What is ego depletion? Toward a mechanistic revision of the resource model of self-control. Perspectives on Psychological Science, 7(5), 450–463. 10.1177/1745691612454134 [DOI] [PubMed] [Google Scholar]
- Inzlicht M, Schmeichel BJ, & Macrae CN (2014). Why self-control seems (but may not be) limited. Trends in Cognitive Sciences, 18(3), 127–133. 10.1016/j.tics.2013.12.009 [DOI] [PubMed] [Google Scholar]
- Koenig J, Jarczok MN, Ellis RJ, Hillecke TK, & Thayer JF (2014). Heart rate variability and experimentally induced pain in healthy adults: A systematic review. European Journal of Pain, 18(3), 301–314. 10.1002/j.1532-2149.2013.00379.x [DOI] [PubMed] [Google Scholar]
- Laborde S, Mosley E, & Thayer JF (2017). Heart rate variability and cardiac vagal tone in psychophysiological research–recommendations for experiment planning, data analysis, and data reporting. Frontiers in Psychology, 8, 213–231. 10.3389/fpsyg.2017.00213 [DOI] [PMC free article] [PubMed] [Google Scholar]
- Langemark M, Jensen K, Jensen TS, & Olesen J (1989). Pressure pain thresholds and thermal nociceptive thresholds in chronic tension-type headache. Pain, 38(2), 203–210. [DOI] [PubMed] [Google Scholar]
- Lautenbacher S, Kunz M, Strate P, Nielsen J, & Arendt-Nielsen L (2005). Age effects on pain thresholds, temporal summation and spatial summation of heat and pressure pain. Pain, 115(3), 410–418. 10.1016/j.pain.2005.03.025 [DOI] [PubMed] [Google Scholar]
- Lautenbacher S, Spernal J, Schreiber W, & Krieg JC (1999). Relationship between clinical pain complaints and pain sensitivity in patients with depression and panic disorder. Psychosomatic Medicine, 61(6), 822–827. [DOI] [PubMed] [Google Scholar]
- Lewis GN, Rice DA, & McNair PJ (2012). Conditioned pain modulation in populations with chronic pain: a systematic review and meta-analysis. The Journal of Pain, 13(10), 936–944. 10.1016/j.jpain.2012.07.005 [DOI] [PubMed] [Google Scholar]
- Maloney PW, Grawitch MJ, & Barber LK (2012). The multi-factor structure of the Brief Self-Control Scale: Discriminant validity of restraint and impulsivity. Journal of Research in Personality, 46(1), 111–115. 10.1016/j.jrp.2011.10.001 [DOI] [Google Scholar]
- Mikkelsson M, Latikka P, Kautiainen H, Isomeri R, & Isomäki H (1992). Muscle and bone pressure pain threshold and pain tolerance in fibromyalgia patients and controls. Archives of Physical Medicine and Rehabilitation, 73(9), 814–818. [PubMed] [Google Scholar]
- Millan MJ (2002). Descending control of pain. Progress in Neurobiology, 66(6), 355–474. [DOI] [PubMed] [Google Scholar]
- Moont R, Pud D, Sprecher E, Sharvit G, Yarnitsky D (2010) “Pain inhibits pain” mechanisms: Is pain modulation simply due to distraction? Pain, 150, 113–120. 10.1016/j.pain.2010.04.009 [DOI] [PubMed] [Google Scholar]
- Nahman-Averbuch H, Nir RR, Sprecher E, & Yarnitsky D (2016). Psychological factors and conditioned pain modulation: A meta-analysis. The Clinical Journal of Pain, 32(6), 541–554. 10.1097/AJP.0000000000000296 [DOI] [PubMed] [Google Scholar]
- Nahman-Averbuch H, Yarnitsky D, Granovsky Y, Gerber E, Dagul P, & Granot M (2013). The role of stimulation parameters on the conditioned pain modulation response. Scandinavian Journal of Pain, 4(1), 10–14. 10.1016/j.sjpain.2012.08.001 [DOI] [PubMed] [Google Scholar]
- Pud D, Granovsky Y, & Yarnitsky D (2009). The methodology of experimentally induced diffuse noxious inhibitory control (DNIC)-like effect in humans. Pain, 144, 16–19. 10.1016/j.pain.2009.02.015 [DOI] [PubMed] [Google Scholar]
- Quartana PJ, Campbell CM, & Edwards RR (2009). Pain catastrophizing: a critical review. Expert Review of Neurotherapeutics, 9(5), 745–758. 10.1586/ern.09.34 [DOI] [PMC free article] [PubMed] [Google Scholar]
- Riley JL III, Robinson ME, Wise EA, Myers CD, & Fillingim RB (1998). Sex differences in the perception of noxious experimental stimuli: A meta-analysis. Pain, 74(2), 181–187. [DOI] [PubMed] [Google Scholar]
- Roth RM, Isquith PK, & Gioia GA (2005). Behavior Rating Inventory of Executive Function- Adult Version Lutz, FL: Psychological Assessment Resources. [Google Scholar]
- Sanchez-Cubillo I, Perianez JA, Adrover-Roig D, Rodriguez-Sanchez JM, Rios-Lago M, Tirapu J, & Barcelo F (2009). Construct validity of the Trail Making Test: role of task-switching, working memory, inhibition/interference control, and visuomotor abilities. Journal of the International Neuropsychological Society, 15(3), 438–450. 10.1017/S1355617709090626 [DOI] [PubMed] [Google Scholar]
- Saunders B, Milyavskaya M, Etz A, Randles D, & Inzlicht M (2018, September 25). Reported self-control is not meaningfully associated with inhibition-related executive function: A Bayesian analysis 10.31234/osf.io/bxfsu [DOI] [Google Scholar]
- Schoenen J, Bottin D, Hardy F, & Gerard P (1991). Cephalic and extracephalic pressure pain thresholds in chronic tension-type headache. Pain, 47, 145–149. [DOI] [PubMed] [Google Scholar]
- Segerstrom SC, & Solberg Nes L (2007). Heart rate variability reflects self-regulatory strength, effort, and fatigue. Psychological Science, 18, 275–281. 10.1111/j.1467-9280.2007.01888.x [DOI] [PubMed] [Google Scholar]
- Segerstrom SC, Boggero IA, & Evans DR (2016). Pause and plan: The physiology of self-regulation. In Vohs KD and Baumeister RF (Eds.), Handbook of self-regulation: Theory and application, 3rd ed(131–145). New York: Guilford. [Google Scholar]
- Solberg Nes L, Carlson CR, Crofford LJ, De Leeuw R, & Segerstrom SC (2010). Self-regulatory deficits in fibromyalgia and temporomandibular disorders. Pain, 151(1), 37–44. 10.1016/j.pain.2010.05.009 [DOI] [PubMed] [Google Scholar]
- Solberg Nes LS, Roach AR, & Segerstrom SC (2009). Executive functions, self-regulation, and chronic pain: a review. Annals of Behavioral Medicine, 37(2), 173–183. 10.1007/s12160-009-9096-5 [DOI] [PubMed] [Google Scholar]
- Staud R, Robinson ME, & Price DD (2005). Isometric exercise has opposite effects on central pain mechanisms in fibromyalgia patients compared to normal controls. Pain, 118, 176–184. 10.1016/j.pain.2005.08.007 [DOI] [PubMed] [Google Scholar]
- Sullivan MJL, Thorn B, Keefe FJ, Martin M, Bradley LA, Lefebvre JC (2001). Theoretical perspectives on the relation between catastrophizing and pain. Clinical Journal of Pain, 17, 52–64. [DOI] [PubMed] [Google Scholar]
- Thayer JF, & Lane RD (2000). A model of neurovisceral integration in emotion regulation and dysregulation. Journal of Affective Disorders, 61 (3), 201–216. [DOI] [PubMed] [Google Scholar]
- Tangney J, Baumeister RF, & Boone AL (2004). High self-control predicts good adjustment, less pathology, better grades, and interpersonal success. Journal of Personality, 72, 271–324. [DOI] [PubMed] [Google Scholar]
- Tchivileva IE, Lim PF, Smith SB, Slade GD, Diatchenko L, McLean SA, & Maixner W (2010). Effect of catechol-O-methyltransferase polymorphism on response to propranolol therapy in chronic musculoskeletal pain: A randomized, double–blind, placebo-controlled, crossover pilot study. Pharmacogenetics and Genomics, 20(4), 239–248. 10.1097/FPC.0b013e328337f9ab [DOI] [PMC free article] [PubMed] [Google Scholar]
- Wagner DD, & Heatherton TF (2010) Giving in to temptation: The emerging cognitive neuroscience of self-regulatory failure. In: Vohs KD, Baumeister RF, editors. Handbook of self-regulation: research, theory, and applications New York: Guilford Press. [Google Scholar]
- Yarnitsky D (2010). Conditioned pain modulation (the diffuse noxious inhibitory control-like effect): Its relevance for acute and chronic pain states. Current Opinion in Anesthesiology, 23(5), 611–615. 10.1097/ACO.0b013e32833c348b [DOI] [PubMed] [Google Scholar]