Abstract
Locomotor activity is affected by a range of factors in addition to experimental treatment, including the breeding environment. Appropriate convalescence and acclimation are important for animal experiments, because environmental changes and physical burden can result from surgery, transportation, and cage exchange. However, the duration that locomotor activity is affected by these factors is currently unclear, because it has traditionally been difficult to measure locomotor activity in multiple group-housed animals in any location other than the analysis room. In the present study, we analyzed the locomotor activity of group-housed rats using a nano tag® after surgery, transportation, and cage exchange. The nano tag®, a new device for analyzing activity, can measure locomotor activity in laboratory animals with no limitation on the number of animals in same cage. Any type of cage can be used for analysis, at any time of day, and in any location. Nano tags® were subcutaneously implanted in male rats (F344/NSlc, 6 weeks of age) and locomotor activity was continuously measured after surgery, transportation, and cage exchange. Significant activity changes were observed in rats after transportation and cage exchange, 9 days and 3 h after the event, respectively. The results suggest that continuous measurement of locomotor activity with nano tags® can be used to monitor changes in activity induced by environmental changes, and will be helpful for designing animal experiments analyzing locomotor activity.
Keywords: acclimation, convalescence, locomotor activity, nano tag
Introduction
Locomotor activity has traditionally been analyzed as an indicator of the effect or function of drugs, genes, and disease models. For example, methamphetamine, a psychostimulant, induces hyperactivity in mice [9] and rats [3]. In addition, the animal model of catalepsy, an activity disorder characterized by a trancelike state and constantly maintained immobility, has been widely used for pharmacological test of centrally-acting drugs [11, 16, 18]. Transgenic mice with chronic forebrain expression of a dominant negative mutant of DNA polymerase gamma 1 (Polg1) were found to exhibit lethargic behavioral changes, providing an animal model of depression [10]. Neuropeptide pituitary adenylate cyclase-activating polypeptide (Pacap) gene deleted mice were reported to exhibit abnormal hyperactive and jumping behaviors [5] that were reduced by group breeding [8]. Thus, analysis of locomotor activity has contributed to progress in the life sciences, as well as drug discovery and development.
Recent studies suggested that some factors related to the breeding environment (e.g., room light, feed, and shipping) affected the experimental measurement of locomotor activity. For example, intermittent long-wavelength red light from light-emitting diodes increased the period of daily locomotor activity in mice [7]. A ketogenic diet was found to disrupt the circadian clock and activity rhythms in mice [17]. In addition, a high fat diet was found to increase locomotor activity in rats that were administered cocaine [1], suggesting that feed composition affected the results. Two groups of rats that differed in shipping status (shipped from a commercial breeder at weaning or bred in-house) exhibited differences in locomotor activity and catalepsy test responses to the pharmaceutical action of haloperidol [21]. Thus, care should be taken to provide an appropriate breeding environment in experiments of locomotor activity.
Surgery, transportation, and cage exchange are factors that can result in environmental change and/or physical burden. It has traditionally been considered that animals should be left undisturbed in their home cage for several days to several weeks to recover and acclimatize after surgery and shipping. However, the length of time that locomotor activity is affected by surgery, shipping, and cage exchange is currently unclear. Specialized devices in the analysis room are required for many common experimental methods (e.g., the running-wheel activity test [6, 15], the home-cage activity test [13], and the open-field test [4, 12, 14]) for measurement of locomotor activity. Because of the particular features of these devices, it has traditionally been difficult to measure locomotor activity in multiple group-housed animals in any location other than the analysis room.
The nano tag® is a novel device for measuring locomotor activity in experimental animals. Because this device is implanted subcutaneously and records data independently, measurement of locomotor activity does not require specialized cages or devices. This means that activity data can be collected from multiple animals at same time in the same cage, without constraining the testing location (http://www.sleepsign.com/nanotag/index.html). In addition, the nano tag® enables the simultaneous measurement of the locomotor activity of all animals raised in the same home cage (group breeding), without specialized devices. In the present study, we evaluated the influence of shipping, operation, and cage exchange on the locomotor activity of group-housed rats using nano tags®.
Materials and Methods
Animals
Nano tag® (ACOS, Nagano, Japan) implantation and breeding in the convalescence period were performed in Japan SLC (Shizuoka, Japan). After the convalescence period (18 days after the operation), animals were enclosed in a transportation box with bedding, feed, and agar jelly, and were transported to Shinshu University (Nagano, Japan) in an air conditioned van (transport distance: around 200 km; temperature in the transport van: 18–20°C). Jolting during transportation is a non-specific signal not derived from locomotor activity, and was measured with a nano tag® attached to the box. A period of 24 h elapsed from packaging the animals (in Japan SLC) to arriving at a breeding room (at Shinshu University). After the acclimation period (22 days after arrival), data were collected and analyzed at Shinshu University. At Japan SLC and Shinshu University, animals were housed two per cage at 24 ± 2°C with 40% to 60% humidity and a 12-h light (7:00 to 19:00)/ 12-h dark (19:00 to 7:00) cycle, and were housed three per cage at 23 ± 3°C with 45% to 70% humidity and a 12-h light (9:00 to 21:00)/ 12-h dark (21:00 to 9:00) cycle, respectively. Animals had free access to tap water and standard chow (Japan SLC: Labo MR Stock; Nosan Corporation, Kanagawa, Japan/ Shinshu University: FR2; Funabashi Farm, Chiba, Japan). Measurement of body weight and cage exchange were performed once a week. The time-course of the experiment is shown in Supplementary Fig. 1.
This study was carried out in accordance with the Regulations for Animal Experimentation of Shinshu University and Japan SLC. In accordance with national regulations and guidelines, all experimental procedures were reviewed by the Committee for Animal Experiments and finally approved by the President of Shinshu University (Approval Number 280037) and the President of Japan SLC (Approval Number 16146), respectively.
Nano tag® implantation
In measurement with the nano tag® device, activity is defined as cross count data, providing a count of the number of times the XYZ acceleration vector synthesized waveform crosses the threshold levels from bottom to top per recording interval (http://www.sleepsign.com/nanotag/spec.html).
Nano tag® implantation was carried out at Japan SLC. Six male rats (F344/NSlc, 6 weeks of age) underwent implantation. The rats were anesthetized with 1.5% to 2% isoflurane. The back skin was then incised (1.5 cm), a nano tag® was implanted subcutaneously, and the skin was sutured with a 4-0 silk suture. After the operation, 100 mg/kg ampicillin sodium (VICCILLIN; Meiji Seika, Tokyo, Japan) and 0.01 mg/kg buprenorphine hydrochloride (Lepetan; Otsuka Pharmaceutical, Tokyo, Japan) were injected subcutaneously. The rats were placed on a 37°C hotplate until waking. At Japan SLC and Shinshu University, the nano tag® implanted rats were housed two per cage (total three cages) and three per cage (total two cages), respectively. The weight and size of the nano tag® are shown in Supplementary Fig. 2.
Data collection
The data were collected 41 days after nano tag® implantation. Because data were recorded while the nano tag® was implanted, we used near field communication for data collection. The data were collected from nano tag®-implanted rats noninvasively using a FeliCa reader (PaSoRi RC-S380; SONY, Tokyo, Japan). By subtracting the jolting of the transportation box from the data, we obtained a measure of locomotor activity during transit. Nanotag/Viewer software (KISSEI COMTEC, Nagano, Japan) was used for the device settings and data output.
Statistical analysis
Data were reported as the mean ± SD. Statistical comparisons between groups were carried out using Stat Mate statistical software (ATMS, Tokyo, Japan) or SPSS (IBM Corp., Armonk, NY). Data were analyzed using the Student’s t-test (for comparison of two groups with equal variance), Welch’s t-test (for comparison of two groups with different variances), or one-way analysis of variance (ANOVA) followed by the Tukey-Kramer test (for comparison between all means) or the Dunnett’s test (for comparison between every mean and a control mean). In all analyses, P<0.05 was taken to indicate statistical significance.
Results
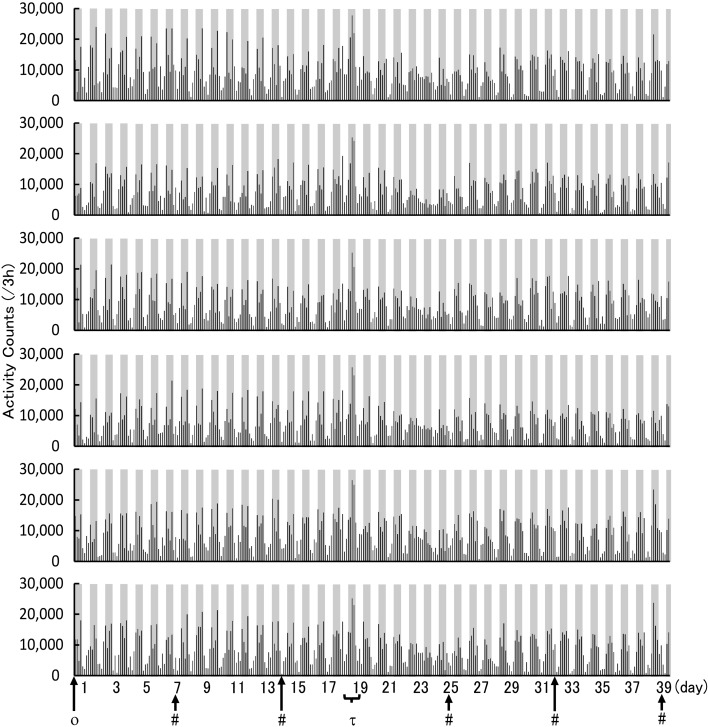
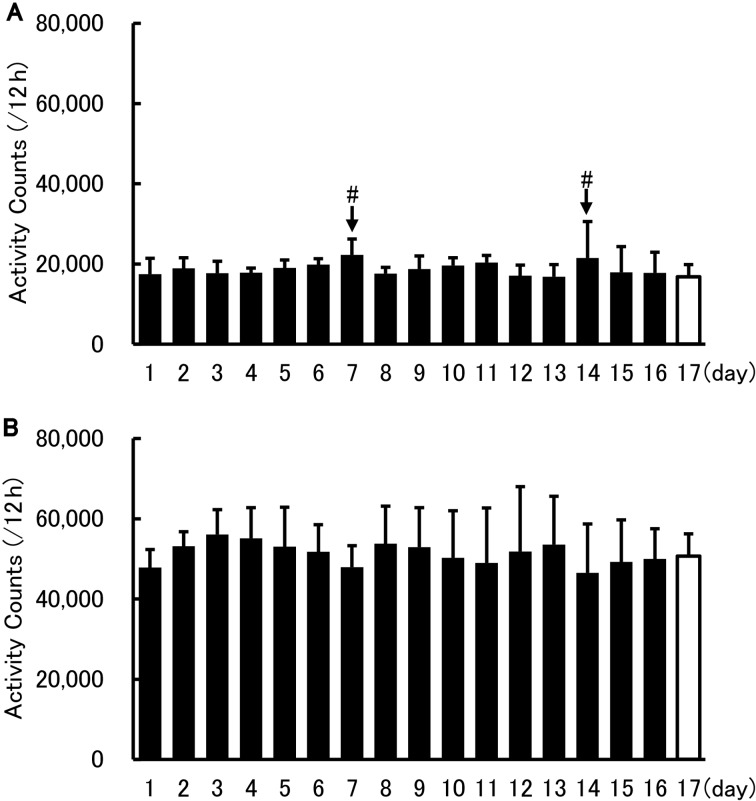
The analysis of locomotor activity began the day after nano tag® implantation. The results revealed no significant change in locomotor activity between 17 days after the operation (1 day before the transportation, light phase: 16,853 ± 2,434 count/12 h; dark phase: 50,669 ± 6,344 count/12 h) and the other days before transportation. On day 7 (light phase: 22,301 ± 6,578 count/12 h; dark phase: 47,906 ± 5,608 count/12 h) and 14 (light phase: 21,514 ± 2,910 count/12 h; dark phase: 46,529 ± 3,704 count/12 h), cage exchange and body weight measurement were performed at approximately 9:00 or 10:00 a.m. (Figs. 1 and 2).
Fig. 1.
Continuous activity counts for each rat during the convalescence and acclimation periods. Locomotor activity every 3 h. Dark-filled and non-filled areas in the graphs indicate the dark and light phases, respectively. The cross axle indicates the day after the operation. Each point is shown as ο: operation; #: cage exchange; τ: transportation.
Fig. 2.
Activity counts during the light and dark phases after surgery. Locomotor activity during light (A) and dark (B) phases (means + SD). The cross axle indicates the day after the operation. The day of cage exchange is shown as #. Dunnett’s test was performed between the data shown in the white (day 17) and black (other days) columns, revealing no significant difference. Each point n=6.
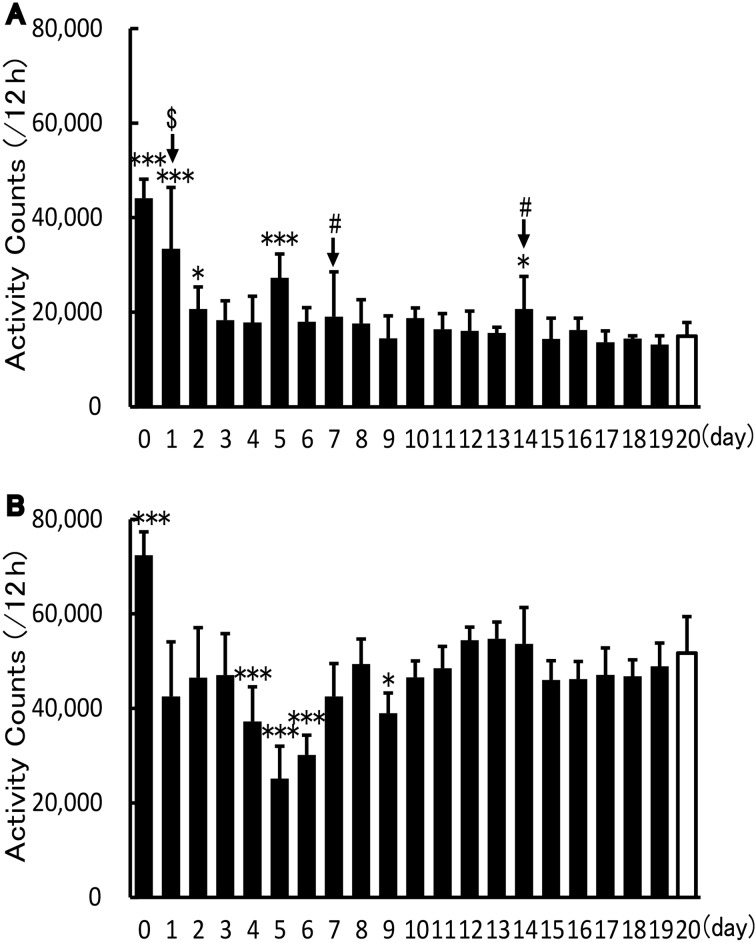
When rats were in the transportation box, locomotor activity was significantly increased during both the light (44,096 ± 4,120 count/12 h) and dark (72,426 ± 5,250 count/12 h) phases, compared with 20 days after shipping (the day at which the most time had passed since transportation and cage exchange; light phase: 14,935 ± 4,605 count/12 h; dark phase: 51,735 ± 13,791 count/12 h). On the day of arrival at the breeding room, locomotor activity was increased only during the light phase (33,383 ± 2,894 count/12 h). Increased and decreased locomotor activity were observed during the light phase on days 2, 5, and 14 (20,570 ± 2,614 count/12 h; 27,309 ± 4,944 count/12 h; and 20,687 ± 2,302 count/12 h, respectively) and during the dark phase on days 4, 5, 6, and 9 (37,250 ± 4,085 count/12 h; 25,145 ± 6,484 count/12 h; 30,128 ± 1,756 count/12 h; 38,963 ± 4,933 count/12 h, respectively) after arrival, respectively. On days 7 (light phase: 19,014 ± 2,892 count/12 h; dark phase: 42,549 ± 4,242 count/12 h) and 14 (light phase: 20,687 ± 2,302 count/12 h; dark phase: 53,673 ± 4,950 count/12 h), cage exchange and body weight measurement were performed at around 10:00 a.m. (Figs. 1 and 3). On day 7 and day 14, locomotor activity during the light phase (12 h each) was changed 1.3 (non-significant) and 1.4 (significant) times compared with day 20, respectively (Fig. 3).
Fig. 3.
Activity counts during light and dark phases after transportation. Locomotor activity during light (A) and dark (B) phases (means + SD). The cross axle indicates the day after the transportation. The day of arrival at the breeding room and cage exchange are shown as $ and #, respectively. *P<0.05; ***P<0.001, compared with the white column (day 20); Dunnett’s test. Each point n=6.
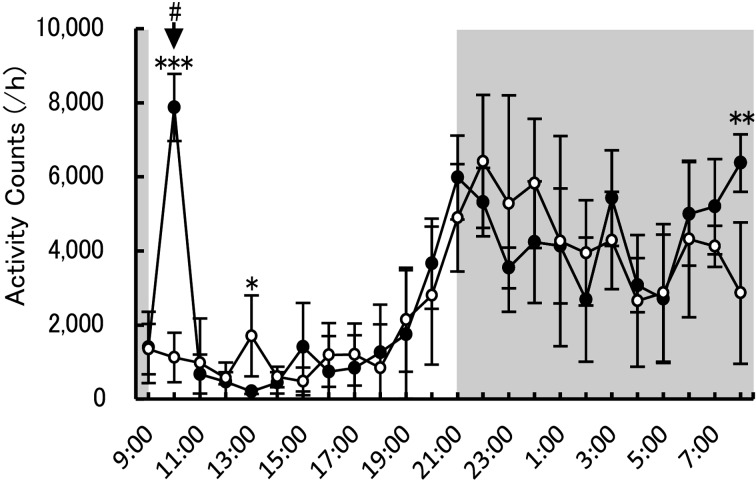
Cage exchange and body weight measurement were performed at 10:17 to 10:25 a.m., revealing that locomotor activity was significantly changed at 0, 3, and 22 h after cage exchange (7,875 ± 910 count/h; 205 ± 72 count/h; 6,375 ± 777 count/h, respectively) compared with each time point on the eve of the next cage exchange (10:00, 13:00, and 8:00 on day 6 after the cage exchange: 1,120 ± 666 count/h; 1,704 ± 1,096 count/h; 2,865 ± 1,908 count/h, respectively) (Fig. 4).
Fig. 4.
Locomotor activity after cage exchange. Activity counts every 1 h after cage exchange (means ± SD). Black and white circles show locomotor activity on the day of cage exchange and 6 days after the event (the eve of next cage exchange), respectively. Dark-filled and non-filled areas in the graphs indicate the dark and light phases, respectively. The time of cage exchange is shown as #. *P<0.05; **P<0.01, compared between the same times on each day: Welch’s t-test. ***P<0.001, compared between the same time on each day: Student’s t-test. Each group n=6. P-values of F-test of equality of variances are indicated on Supplementary Table 2.
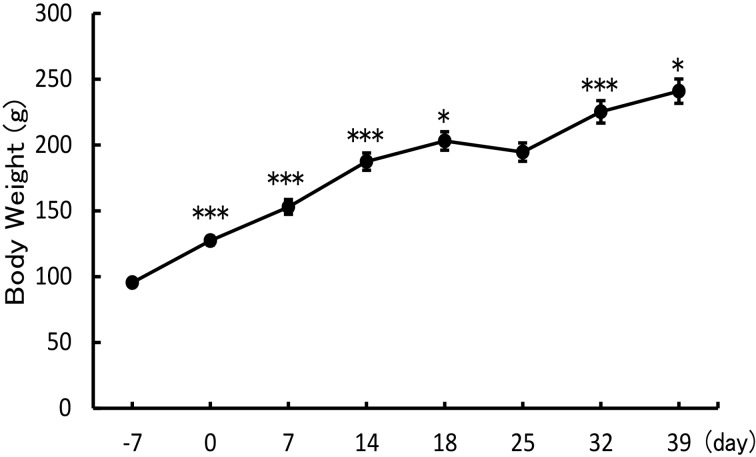
The body weight of the rats significantly increased at 0, 7, 14, 18, 32, and 39 days after the operation (127.4 ± 3.22 g; 153.0 ± 5.7 g; 187.5 ± 6.6 g; 203.1 ± 7.0 g; 225.3 ± 8.6 g; 241.0 ± 9.3 g, respectively) compared with each of the preceding measurements. Body weight 7 days before the operation was 95.4 ± 1.2 g. In contrast, body weight did not increase 1 week after shipping (194.6 ± 7.0 g) (Fig. 5). Each statistical P-values (Tukey-Kramer test) are indicated on Supplementary Table 1.
Fig. 5.
Growth curve of rats after the operation. Body weight measurements during the experiment (means ± SD). The day that nano tag® was implanted is indicated as day 0. *P<0.05; ***P<0.001, compared with each preceding measurement: Tukey-Kramer test. Each point n=6.
Discussion
Appropriate convalescence and acclimation are essential for accurate animal experiments. In the present study, we analyzed locomotor activity of group-housed rats using nano tags®, a novel device. The nano tag® can simultaneously measure locomotor activity in all animals in the same cage. Furthermore, this device contains an internal battery and memory storage, and does not require other specialized devices (e.g., external power supply, infra-red sensor, camera, running-wheel, receiver for telemetry) to measure locomotor activity and record the data. These features enable activity data to be collected from any number of animals at any time, in any location. In many cases, purchased rats were transported using the same transportation box, then they kept in group-breeding situation. We propose that the nano tag® is useful for understanding the activity of rats which are performed surgery (after waking), are transported, and are kept in a general breeding environment.
In addition, the nano tag® can record its own temperature (Supplementary Fig. 3). However, the temperature of subcutaneous device may be affected by the temperature in the home cage. For accurate body temperature measurement, intraperitoneal implantation may be more suitable than subcutaneous implantation.
Following the operation to implant the device, optimized postoperative care is important for accurate measurement [19]. In the current study, after nano tag® implantation surgery, locomotor activity was unchanged in rats. Nano tag® may provide data that is one of the important index that can be evidence of experiment design.
In the present study, the locomotor activity of rats was significantly increased in transit during both the light and dark phases. Packing into the transportation box and jolting during transit may have stimulated rats. Locomotor activity changes were observed until 9 days after the shipping. Increased locomotor activity during the light phase on the day of cage exchange was likely to be caused by the maintenance. It is known that some factors related to the breeding environment (e.g., feed, bedding, cage material, cage size, and/or breeding rack) often differ between facilities.
Body weight gain was suppressed 1 week after transportation in nano tag®-implanted rats. In contrast, nano tag® non-implanted rats did not show suppression of body weight gain after transit or after changing feed (Labo MR Stock to FR2) (Supplementary Fig. 4 and Supplementary Table 1). The nano tag® implanted and non-implanted rats were obtained on different period. Some kind of factors (e.g., difference of jolting, transportation time, road condition during transportation, and some other factors) might affect body weight gain.
Cage exchange is important for appropriate animal experimentation. In the present study, we expected that cage exchange would also influence locomotor activity, which was measured after the maintenance. Locomotor activity was increased immediately after cage exchange, but returned to a normal level in a relatively short time. Subsequently, locomotor activity was no different from 4 to 21 h after cage exchange. At 6 days after cage exchange (the eve of the next cage exchange), a temporary increased in locomotor activity was observed at 13:00 (1,704 ± 1,096 count/h) compared with that at 12:00 (561 ± 162 count/h; P<0.05, Tukey-Kramer test) and 14:00 (596 ± 276 count/h; P<0.05, Tukey-Kramer test) in the same day. The cause of this temporary increase was not able to be identified, because some factors (e.g., feeding behavior, a person entering or exiting the breeding room, and/or outdoor noise) may have affected locomotor activity.
On the day of arrival to the breeding room, locomotor activity in the light phase (12 h each) was increased to 2.2 times of that 20 days after the transit (the day at which the most time had passed since transportation and cage exchange: control). In contrast, on the days of cage exchange, locomotor activity in the light phase (12 h each) increased to 1.3 to 1.4 times that in the control (day 20). These findings suggest that cage exchange had less influence on locomotor activity than transportation. In previous studies, acclimation periods for analysis of locomotor activity measurement varied from 2 days to 2 weeks [1, 17, 21]. These results and those of previous reports suggest that the optimal acclimation period differs between different breeding environments (e.g., house-bred [non-transported] or purchased [transported] animals).
It has been previously reported that animals subjected to environmental changes exhibit changes in physiology, including body weight, plasma hormonal levels, heart rate, and blood pressure changes [2, 20]. In the current study, we examined the influence of surgery, transportation, and cage exchange on locomotor activity using continuous measurement with a nano tag® device. The results revealed that these factors impacted on the experimental results. Therefore, our findings support the notion that implementing appropriate convalescence and acclimation periods is necessary for accurate animal experiments. The current results may be helpful for informing the design of appropriate animal experiments for locomotor activity analysis.
Supplementary Material
Acknowledgments
There was no funding from sources outside of Shinshu University. We are grateful to all staff of the Research Center for Supports to Advanced Science, Shinshu University, for assistance with our experiments. We thank Mr. Benjamin Knight, MSc., from Edanz Group (www.edanzediting.com/ac) for editing a draft of this manuscript.
References
- 1.Baladi M.G., Horton R.E., Owens W.A., Daws L.C., France C.P.2015. Eating high fat chow decreases dopamine clearance in adolescent and adult male rats but selectively enhances the locomotor stimulating effects of cocaine in adolescents. Int. J. Neuropsychopharmacol. 18: pyv024. doi: 10.1093/ijnp/pyv024 [DOI] [PMC free article] [PubMed] [Google Scholar]
- 2.Capdevila S., Giral M., Ruiz de la Torre J.L., Russell R.J., Kramer K.2007. Acclimatization of rats after ground transportation to a new animal facility. Lab. Anim. 41: 255–261. doi: 10.1258/002367707780378096 [DOI] [PubMed] [Google Scholar]
- 3.Feier G., Valvassori S.S., Varela R.B., Resende W.R., Bavaresco D.V., Morais M.O., Scaini G., Andersen M.L., Streck E.L., Quevedo J.2013. Lithium and valproate modulate energy metabolism in an animal model of mania induced by methamphetamine. Pharmacol. Biochem. Behav. 103: 589–596. doi: 10.1016/j.pbb.2012.09.010 [DOI] [PubMed] [Google Scholar]
- 4.Guzzetti S., Calzari L., Buccarello L., Cesari V., Toschi I., Cattaldo S., Mauro A., Pregnolato F., Mazzola S.M., Russo S.2018. Taurine Administration Recovers Motor and Learning Deficits in an Angelman Syndrome Mouse Model. Int. J. Mol. Sci. 19: 1088. doi: 10.3390/ijms19041088 [DOI] [PMC free article] [PubMed] [Google Scholar]
- 5.Hashimoto H., Shintani N., Tanaka K., Mori W., Hirose M., Matsuda T., Sakaue M., Miyazaki J., Niwa H., Tashiro F., Yamamoto K., Koga K., Tomimoto S., Kunugi A., Suetake S., Baba A.2001. Altered psychomotor behaviors in mice lacking pituitary adenylate cyclase-activating polypeptide (PACAP). Proc. Natl. Acad. Sci. USA 98: 13355–13360. doi: 10.1073/pnas.231094498 [DOI] [PMC free article] [PubMed] [Google Scholar]
- 6.Haskell-Luevano C., Schaub J.W., Andreasen A., Haskell K.R., Moore M.C., Koerper L.M., Rouzaud F., Baker H.V., Millard W.J., Walter G., Litherland S.A., Xiang Z.2009. Voluntary exercise prevents the obese and diabetic metabolic syndrome of the melanocortin-4 receptor knockout mouse. FASEB J. 23: 642–655. doi: 10.1096/fj.08-109686 [DOI] [PMC free article] [PubMed] [Google Scholar]
- 7.Hofstetter J.R., Hofstetter A.R., Hughes A.M., Mayeda A.R.2005. Intermittent long-wavelength red light increases the period of daily locomotor activity in mice. J. Circadian Rhythms 3: 8. doi: 10.1186/1740-3391-3-8 [DOI] [PMC free article] [PubMed] [Google Scholar]
- 8.Ishihama T., Ago Y., Shintani N., Hashimoto H., Baba A., Takuma K., Matsuda T.2010. Environmental factors during early developmental period influence psychobehavioral abnormalities in adult PACAP-deficient mice. Behav. Brain Res. 209: 274–280. doi: 10.1016/j.bbr.2010.02.009 [DOI] [PubMed] [Google Scholar]
- 9.Itoh Y., Nishibori M., Oishi R., Saeki K.1984. Neuronal histamine inhibits methamphetamine-induced locomotor hyperactivity in mice. Neurosci. Lett. 48: 305–309. doi: 10.1016/0304-3940(84)90055-7 [DOI] [PubMed] [Google Scholar]
- 10.Kasahara T., Takata A., Kato T.M., Kubota-Sakashita M., Sawada T., Kakita A., Mizukami H., Kaneda D., Ozawa K., Kato T.2016. Depression-like episodes in mice harboring mtDNA deletions in paraventricular thalamus. Mol. Psychiatry 21: 39–48. doi: 10.1038/mp.2015.156 [DOI] [PMC free article] [PubMed] [Google Scholar]
- 11.Kikuchi T., Tottori K., Uwahodo Y., Hirose T., Miwa T., Oshiro Y., Morita S.1995. 7-(4-[4-(2,3-Dichlorophenyl)-1-piperazinyl]butyloxy)-3,4-dihydro-2(1H)-quinolinone (OPC-14597), a new putative antipsychotic drug with both presynaptic dopamine autoreceptor agonistic activity and postsynaptic D2 receptor antagonistic activity. J. Pharmacol. Exp. Ther. 274: 329–336. [PubMed] [Google Scholar]
- 12.Lee H., Kim H.K., Kwon J.T., Kim Y.O., Seo J., Lee S., Cho I.H., Kim H.J.2018. Effects of Tianeptine on Adult Rats Following Prenatal Stress. Clin. Psychopharmacol. Neurosci. 16: 197–208. doi: 10.9758/cpn.2018.16.2.197 [DOI] [PMC free article] [PubMed] [Google Scholar]
- 13.Manfré G., Clemensson E.K.H., Kyriakou E.I., Clemensson L.E., van der Harst J.E., Homberg J.R., Nguyen H.P.2017. The BACHD Rat Model of Huntington Disease Shows Specific Deficits in a Test Battery of Motor Function. Front. Behav. Neurosci. 11: 218. doi: 10.3389/fnbeh.2017.00218 [DOI] [PMC free article] [PubMed] [Google Scholar]
- 14.Masini D., Bonito-Oliva A., Bertho M., Fisone G.2018. Inhibition of mTORC1 Signaling Reverts Cognitive and Affective Deficits in a Mouse Model of Parkinson’s Disease. Front. Neurol. 9: 208. doi: 10.3389/fneur.2018.00208 [DOI] [PMC free article] [PubMed] [Google Scholar]
- 15.Novak C.M., Burghardt P.R., Levine J.A.2012. The use of a running wheel to measure activity in rodents: relationship to energy balance, general activity, and reward. Neurosci. Biobehav. Rev. 36: 1001–1014. doi: 10.1016/j.neubiorev.2011.12.012 [DOI] [PMC free article] [PubMed] [Google Scholar]
- 16.Ohno Y., Shimizu S., Imaki J., Ishihara S., Sofue N., Sasa M., Kawai Y.2008. Anticataleptic 8-OH-DPAT preferentially counteracts with haloperidol-induced Fos expression in the dorsolateral striatum and the core region of the nucleus accumbens. Neuropharmacology 55: 717–723. doi: 10.1016/j.neuropharm.2008.06.005 [DOI] [PubMed] [Google Scholar]
- 17.Oishi K., Uchida D., Ohkura N., Doi R., Ishida N., Kadota K., Horie S.2009. Ketogenic diet disrupts the circadian clock and increases hypofibrinolytic risk by inducing expression of plasminogen activator inhibitor-1. Arterioscler. Thromb. Vasc. Biol. 29: 1571–1577. doi: 10.1161/ATVBAHA.109.190140 [DOI] [PubMed] [Google Scholar]
- 18.Sanberg P.R., Bunsey M.D., Giordano M., Norman A.B.1988. The catalepsy test: its ups and downs. Behav. Neurosci. 102: 748–759. doi: 10.1037/0735-7044.102.5.748 [DOI] [PubMed] [Google Scholar]
- 19.Schuler B., Rettich A., Vogel J., Gassmann M., Arras M.2009. Optimized surgical techniques and postoperative care improve survival rates and permit accurate telemetric recording in exercising mice. BMC Vet. Res. 5: 28. doi: 10.1186/1746-6148-5-28 [DOI] [PMC free article] [PubMed] [Google Scholar]
- 20.Swallow J., Anderson D., Buckwell A.C., Harris T., Hawkins P., Kirkwood J., Lomas M., Meacham S., Peters A., Prescott M., Owen S., Quest R., Sutcliffe R., Thompson K., Transport Working Group, Laboratory Animal Science Association (LASA)2005. Guidance on the transport of laboratory animals. Lab. Anim. 39: 1–39. doi: 10.1258/0023677052886493 [DOI] [PMC free article] [PubMed] [Google Scholar]
- 21.Wiley J.L., Evans R.L.2009. To breed or not to breed? Empirical evaluation of drug effects in adolescent rats. Int. J. Dev. Neurosci. 27: 9–20. doi: 10.1016/j.ijdevneu.2008.11.002 [DOI] [PMC free article] [PubMed] [Google Scholar]
Associated Data
This section collects any data citations, data availability statements, or supplementary materials included in this article.


