

Summary
Mesenchymal stromal cells (MSCs) are used in many clinical applications. However, ex vivo expansion is required to reach clinically relevant cell numbers, which might lead to selection of clones with different characteristics. To follow clonal selection, we transduced MSC progenitors in umbilical cord pieces (UCPs) with vectors encoding fluorescent proteins and genetic barcodes. After marked MSC cultures grew out from UCPs, we investigated the influence of cytokines on MSC functionality. Specific cytokine conditions selected for clones from common progenitors. MSC secretome analyses revealed differences dependent on the culture conditions used. Clones expanded in human serum containing culture medium secreted a plethora of growth factors. When expanded in the same medium containing TGF-β, MSCs secreted negligible amounts of cytokines but at the same time led to an increased human chimerism after hematopoietic stem cell transplantation into immunodeficient mice. Our results suggest a major influence of cytokine additives on MSC functionality.
Keywords: MSC, cytokines, expansion media, secretome, umbilical cord, genetic barcodes, clonal tracking, HSC, hematopoietic stem cells, engraftment, TGFB1
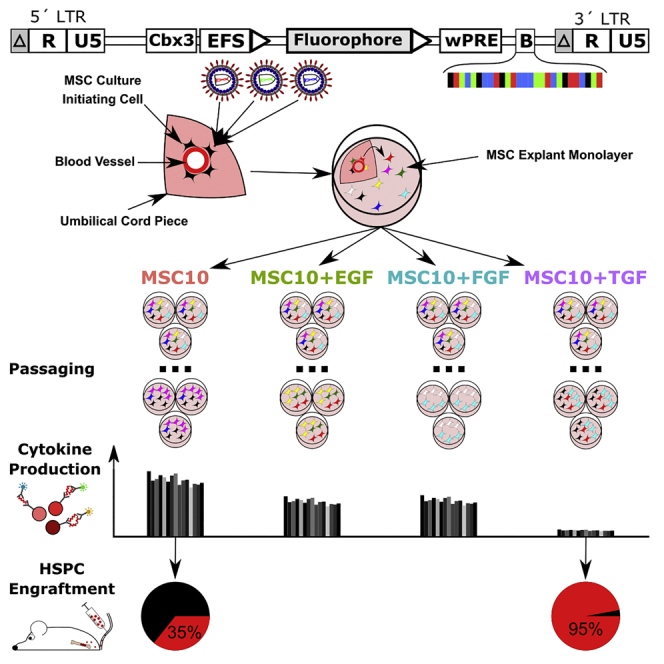
Graphical Abstract
Highlights
-
•
Cytokine supplementation selects for common MSC culture-initiating cells
-
•
TGFB1 markedly decreases the cytokine production of MSCs
-
•
Medium of TGF-β-selected MSC supports HSC engraftment
Rothe and colleagues transduced mesenchymal stromal cell initiating cells (MSC-I) in the umbilical cord pieces with lentiviral barcode vectors and observed a cytokine-dependent selection of MSC clones with common MSC-I. TGFB1 drastically decreased the cytokine production of selected MSCs, whereas the conditioned medium from these cultures enhanced the engraftment of human hematopoietic stem cells.
Introduction
Mesenchymal stromal cells (MSCs) reside in a perivascular niche and can be isolated from many vascularized tissue sources (Crisan et al., 2008, Zhao et al., 2016). In contrast to other cell types, for example, hematopoietic stem cells (HSCs), MSCs can be easily expanded ex vivo to achieve clinically relevant cell numbers (Gottipamula et al., 2013, Zhao et al., 2015). In cell therapy, intravenously injected MSCs preferentially migrate to sites of inflammation, where they can reside for several weeks and secrete a plethora of immunomodulatory factors (von Bahr et al., 2012, Kean et al., 2013). These functional aspects have made MSCs the focus of cell therapy to treat many disease entities in hundreds of clinical trials (Monsarrat et al., 2016). Despite the safe use of MSCs, reported efficiencies in preclinical and clinical studies are diverse even within a certain disease phenotype, such as graft versus host disease in HSC therapy (De Luca et al., 2017, Rizk et al., 2016). MSC cultures were shown to undergo clonal selection during the expansion phase, and selected clones possessed different capabilities (Selich et al., 2016). MSC clones with a desired therapeutic phenotype might be absent in some tissue sources or be selected against over time in the various cultivation conditions, which might partially explain contradictory results in the literature.
Here, we analyzed the influence of some commonly used cytokines in MSC expansion, such as epidermal growth factor (EGF), basic fibroblast growth factor 2 (FGF2), and transforming growth factor β1 (TGFB1), on the clonal composition and functionality of cytokine-selected MSCs. MSC-initiating cells were transduced in whole umbilical cord pieces (UCPs) with integrating lentiviral barcode vectors. These vectors code for mCherry (red), Venus (green), and Cerulean (blue) to facilitate a complex color composition upon triple transduction and a first insight into clonal development by flow cytometry (Cornils et al., 2014, Selich et al., 2016). To allow high-resolution tracking of clonal development via high-throughput sequencing, the vectors were engineered to contain a genetic barcode region with 15 fluorescent protein-specific and 16 random nucleotides. To explore the possibility that MSC functionality can be directed by the culture medium constituents, parallel cultures of genetically labeled MSCs were kept in media supplemented only with 10% human serum or additionally containing EGF, FGF2, or TGFB1. Flow cytometric and deep sequencing analyses revealed a cytokine-dependent selection of clones from common culture-initiating cells. The secretome analyses of the selected cultures demonstrated a remarkably reduced production and increased uptake of cytokines by TGFB1-selected cells (TSCs). In contrast to MSCs selected in our basic medium, conditioned medium from TSCs was not able to support the cytotoxic activity of a natural killer cell line (NK92) or the proliferation of T cells in a mixed lymphocyte reaction (MLR) in vitro. Since results for MSCs supporting HSC engraftment are still contradictory, we tested conditioned media from MSCs selected in our basic medium (rich in MSC-produced cytokines) versus conditioned medium from TSCs (almost no MSC-produced cytokines) (Beksac and Yurdakul, 2016, De Luca et al., 2017). Surprisingly, TSC-conditioned (TSCc) media increased human chimerism after HSC transplantation in a murine model system. Our results shed light on basic MSC biology and highlight the need to carefully select the expansion media according to the desired therapeutic effect of MSCs.
Results
EGF, FGF2, and TGFB1 Modulate the Growth Kinetics of MSCs
The umbilical cord (UC) contains a presumed perivascular niche of MSC culture-initiating cells (Crisan et al., 2008, Guimarães-Camboa and Evans, 2017, Selich et al., 2016). Immediately after MSC explant, monolayers (MSC-EM) grew out from the UCPs, samples were distributed among media containing 10% human serum (MSC10) with or without additional cytokines. During passaging, the same amount of cells was seeded for subsequent passages for all conditions and passages. We supplemented MSC10 with 10 ng/mL EGF, FGF, or TGFB1. These cytokines are often used in MSC media and are described to increase proliferation of MSC in vitro (Rodrigues et al., 2010). Compared with the MSC proliferation rate during the first four passages in MSC10, addition of FGF2 or EGF to the MSC10 medium led to increased MSC proliferation, while TGFB1 addition resulted in decreased MSC proliferation (Figure 1). The growth of the cultures started to converge after the fourth passage and reached similar proliferation levels at passage 8. These results were highly reproducible among different donors (n = 6), even though the net growth rates varied strongly (Figure S1). All cells retained the classical MSC markers CD73, CD90, and CD105 throughout the different cultivation settings (data not shown).
Figure 1.

Growth Characteristics of MSC Cultures in Different Media
MSCs were initiated by a UCP and distributed among αMEM + 10% human AB serum (MSC10) or, in addition, 10 ng/mL EGF (MSC10 + EGF), FGF2 (MSC10 + FGF), or TGFB1 (MSC10 + TGF). Cultures were passaged twice a week. The upper panel shows the cell division factor (geometric mean) for each passage. The lower panel shows the cumulative expansion factor. A detailed analysis of individual cultures (n = 14) is depicted in Figure S1. The data represent means and the error bars show the SD.
Cytokine-Dependent Selection of Clones from Common MSC Culture-Initiating Cells
To analyze the influence of cytokines on the clonal composition of MSC-EM, we cultivated whole UCPs for 18 h in medium containing integrating lentiviral vectors coding for mCherry (red), Venus (green), or Cerulean (blue) to enable clonal tracking by flow cytometry. In addition, the vectors harbor a genetic barcode region with 16 random nucleotides to facilitate clonal tracking at higher resolution by high-throughput sequencing. Triplicate MSC-EM cultures were separated and kept in MSC10, MSC10 + EGF, MSC10 + FGF, or MSC10 + TGF and passaged beyond the initial growth lag phase. For Figure 2, UCPs were transduced with the mCherry and Venus, and the initiated MSC-EM with the Cerulean variant (Figure S2A). As we are only interested in the progenitor-dependent selection, only mCherry and Venus are depicted (Figure 2). Interestingly, the color composition resulting from common culture-initiating cells was similar within medium triplicates and different among the different medium compositions used (Figure 2). These results were reproducible for different donors (Figure S3 [transduction scheme Figure S2B] and Figure S4 [transduction scheme Figure S2C]). We increased the depth of our analysis by high-throughput sequencing of the genetic barcode region within the lentiviral vectors. The diversity of our barcode libraries is typically more than 5 × 10⁴ different barcodes for each color, thus it is very unlikely to select identical barcodes by chance. The read count of barcodes was used as a surrogate marker for clonal abundance. In agreement with the flow cytometric observation (same analysis as Figure 2, but on barcode level), sequencing data also suggested that clonal composition of replicates cultured in the same medium was similar. Some of the most abundant clones were shared among the different medium conditions (Figure 3B). To analyze the clonal diversity of MSC-EM independently from common culture-initiating cells, we transduced the MSC-EM after initiation with a third barcode vector, and then cultured the cells in the different media (transduction scheme Figure S2B, but only barcodes from the MSC-EM transduction were analyzed). The Shannon variability analysis is a mathematical method to represent the variability of a system in one number (high number = high variability) (Spellerberg and Fedor, 2003). Deep sequencing and Shannon variability analysis revealed an early loss of clones cultured in TGFB1-supplemented medium (Figure 3C). Barcode diversity in the other medium conditions remained stable over seven passages.
Figure 2.

Cytokine-Dependent Selection for Clones with Common Progenitors
MSC progenitors were marked with lentiviral vectors coding for Venus or mCherry in the perivascular niche. An exemplary marked culture grew out and was distributed among MEM α + 10% human AB serum (MSC10) or, in addition, 10 ng/mL EGF (MSC10 + EGF), FGF2 (MSC10 + FGF), or TGFB1 (MSC10 + TGF) in triplicate. Cells were selected for several weeks and the color composition deriving from marked progenitors was analyzed by flow cytometry.
Figure 3.

High-Resolution Clonal Assessment of Selected Clones by Deep Sequencing of the Viral Barcode Region
MSC progenitors were first marked in the perivascular niche of the UCP and a second time after the outgrowth by different barcode variants. An exemplary culture was distributed among MEM α + 10% human AB serum (MSC10) or, in addition, 10 ng/mL EGF (MSC10 + EGF), FGF2 (MSC10 + FGF), or TGFB1 (MSC10 + TGF) in triplicate, and passaged twice a week.
(A) Principal-component analysis of the first barcode-marking in the UC after several weeks of selection. Closer proximity of data points represent higher similarity of barcodes.
(B) To show that some clones are shared among different conditions, we depicted the 15 most abundant barcodes in all samples. Numbers in the areas mark unique barcode IDs.
(C) Shannon diversity analysis of the barcode-marking after initiation and hence independent from common progenitors in the UC. The data represent means and the error bars show the SD (n = 3).
TGFB1 Reduces the Cytokine Production of MSC-EMs
Secreted factors are suggested to be one important mode of action for therapeutic use of MSCs (Wang et al., 2018), therefore we analyzed whether altered growth rates and differences in culture-initiating cells might affect the functionality of MSC-EMs. Secretomes of MSC-EM were quantified with the Bio-Plex Pro Human Cytokine 27-plex Assay at three different time points: early after initiation (passage 2), after the growth lag phase (passage 6) and once the growth rates reached similar levels (passage 8). As a control, cytokine levels in medium without cells were measured to determine the MSC-induced net change of cytokines in the different cell culture supernatants. The complete set of 27 investigated cytokines is depicted in Figure S5. We analyzed all combinations of media and passage numbers for each cytokine and found nearly 800 significant differences among the conditions (Table S1). The cytokines that were most deregulated included interleukin-6 (IL-6), CXCL8, CCL5, and PDGF-BB, and those with prominent immune modulatory effects included CCL2, IFNG, TNFA, and IL-10 are depicted in Figure 4. The changes in cytokine levels could be roughly divided into two groups, those which were either increased (e.g., IL-6, CXCL8, CCL2, IFNG, and TNFA) or decreased (e.g., CCL5, PDGF-BB, and IL-10) by MSCs. MSC10-selected cells (M10SC) showed the highest cytokine production with a peak at passage 6. In contrast, TSCs produced only minimal amounts of cytokines and exhibited the highest consumption of cytokines early after initiation compared with the other medium conditions as shown by the bars below the dashed red line (zero change).
Figure 4.

The Cytokine Content in the Supernatant of TGFB1-Selected MSCs Is Remarkably Reduced Compared with the Other Cultivation Conditions
MSC cultures induced by the UC were kept in four different medium conditions: MEM α + 10% human AB serum (MSC10) or, in addition, containing 10 ng/mL EGF (MSC10 + EGF), FGF2 (MSC10 + FGF), or TGFB1 (MSC10 + TGF). MSC cultures were passaged twice a week. Supernatants were analyzed by Bio-Plex Pro Human Cytokine 27-plex. For Exemplary eight cytokines are depicted. Control samples were cultivated without cells. Cytokine levels measured in the control media were subtracted from the different MSC culture conditions, which resulted in the net production or reduction of cytokines by the cells. The cytokines quantified are given at the top of the graphs. To adjust to the different proliferation rates in the different media, cytokine amounts were divided by the area under the growth curve. The cytokine ranges were IL-6 (26 to 10,544 pg/mL), CXCL8 (5 to 10,087 pg/mL), CCL5 (−1,751 to 46 pg/mL), PDGF-BB (−853 to −36 pg/mL), CCL2 (−15 to 1,352 pg/mL), IFNG (−20 to 103 pg/mL), TNFA (−18 to 119 pg/mL), and IL-10 (−3 to 1 pg/mL). The data represent means and the error bars show the SD; n = 9 (separately cultivated medium triplicates from three donors).
Altered MSC Secretomes Affect Activities of Other Cell Types
To study the effect of an altered secretome on other cell types, we used MSC-EM cultivated in MSC10 (top cytokine producer) or TSCs (minimal cytokine producer). After selection in the respective medium, cells were washed in PBS and cultured in MSC10 medium for 24 h. These conditioned media were used to cultivate the acute megakaryoblastic leukemia cell line MO7 (Avanzi et al., 1988). MO7 cells did not grow in MSC10 (used as negative control), but proliferated in the presence of 10 ng/mL CSF2 (Drexler et al., 1997) (positive control). Interestingly, MO7 cells were able to grow in MSC10-conditioned medium (MSC10c). In contrast to MSC10c, MO7 growth in TSCc medium was not different from the negative control (Figure 5A).
Figure 5.

The Supernatant of TGFB1-Selected MSCs Showed a Reduced Interference with Other Cell Types Compared with MSCs Selected in Human Serum Supplemented Media
MSCs were selected in MSC10 (MEM α + 10% human serum) or MSC10 with additional 10 ng/mL TGFB1. Culture medium was removed, cells were washed with PBS and cultured in MSC10 for 24 h to generate conditioned medium.
(A) Growth of MO7 cells normalized to the negative control. Negative, MSC10; positive, MSC10 + 10 ng/mL CSF2; n = 9 (3 independent experiments in triplicates).
(B) Growth of NK92 cells normalized to the negative control. Negative, MSC10; positive, MSC10 + 400 IU/mL IL-2; n = 12 (4 independent experiments in triplicates).
(C) Growth of K562 cells normalized to the negative control. Negative, MSC10; positive, MSC10 + 400 IU/mL IL-2; n = 9 (3 independent experiments in triplicates).
(D) Remaining K562 after the addition of the same number of cytotoxic NK92 and 48 h of cultivation. First normalized to the cell number of K562 cells without NK92 and then normalized among the experiments to the negative control. Negative, MSC10; positive, MSC10 + 400 IU/mL IL-2; n = 9 (3 independent experiments in triplicates); MSC10c, conditioned medium by MSC10-selected MSCs; TSCc, conditioned medium by MSC10 + TGFB1-selected MSCs.
(E) PBMCs of HLA-mismatched donors were stained either with CFSE or eFlour670, mixed in a ratio of 1:1, cultivated for 1 week and analyzed by flow cytometry for CFSE and eFlour670-negative cells in CD3+ fraction.
All groups were statistically analyzed, but due to space constrains, only the significant value is depicted. n = 3 (technical triplicates); ns, not significant; ∗p < 0.05, ∗∗p < 0.01, ∗∗∗p < 0.001. The data represent means and the error bars show the SD.
As levels of immunomodulatory cytokines were found to be differentially regulated in MSC cultures depending upon the media used, we hypothesized that different MSC cultivation conditions could be exploited to control immune cell functions. To explore this idea, we tested effects of supernatants from MSC cultures on the killing efficiency of the clinically used natural killer cell line NK92 against the chronic myelogenous cell line K562 (Gong et al., 1994, Lozzio and Lozzio, 1973, Tang et al., 2018). As expected, NK92 could not grow in MSC10 (negative control) as they require IL-2 (400 IU/mL, positive control) for proliferation (Gong et al., 1994). Neither MSC10c nor TSCc media supported NK92 growth. Proliferation of the K562 target cells was slightly reduced upon addition of IL-2 to the MSC10 medium. K562 showed increased proliferation in MSC10c (similar to the basal MSC10 medium) and decreased cell growth in TSCc (similar to the IL-2 condition). Further, we tested the cytotoxicity of NK92 versus K562 in MSC10 (negative control), MSC10 + IL-2 (400 IU/mL) (positive control), MSC10c, and TSCc. NK92 and K562 were mixed in a ratio of 1:1, resuspended in the respective media and incubated for 48 h. As expected, NK92 killed K562 more efficiently in the positive control medium compared with the negative control medium. NK92 cytotoxicity in MSC10c was similar to the positive control, whereas NK92 cells in TSCc medium exhibited a reduced cytotoxicity against K562. A similar tendency was observed in an MLR assay. Peripheral blood mononuclear cells (PBMC) of two histocompatibility leukocyte antigen (HLA)-mismatched donors were mixed in a ratio of 1:1, which led to activation and proliferation of preferentially T cells. The growth of T cells in the MLR can be highly increased by the addition of IL-2 and inhibited by further supplementation of IL-10. In comparison with the inhibitory IL-10 conditions, basal medium alone allowed for a moderate growth of T cells. MSC10-conditioned medium increased this effect, whereas TGFB1-conditioned medium decreased T cell proliferation.
Conditioned Medium from TGFB1-Selected Cells Supports Human Hematopoietic Chimerism in a Murine Transplantation Model
Beside the effects of MSC10c on the proliferation and killing activity of certain hematopoietic cell lines, we tested the consequences of different MSC culture conditions on HSC transplantation efficiency. Human CD34+ cord blood cells were cultivated overnight in three different conditions: a control medium (StemSpan + KITLG [100 ng/mL]), MSC10c or TSCc (passage 7). We observed no significant expansion of the HSCs during cultivation (Figure 6A). CD34+ HSCs and progenitor cells (2–4 × 10⁴ cells in 150 μL medium) were then transplanted into non-irradiated NBSGW mice via tail vein injection (McIntosh et al., 2015). After 12 weeks, mice were sacrificed, and the chimerism of human CD45+ cells in bone marrow and peripheral blood was analyzed by flow cytometry. Compared with MSC10c, we observed a significantly higher human chimerism in the peripheral blood and bone marrow of mice transplanted with HSCs pre-cultured in TSCc medium (Figure 6B). When compared with results of the original publication of the NBSGW mouse model, the pre-culture conditions used in our studies did not lead to lineage bias regarding hCD3, hCD19, and hCD33 phenotype in peripheral blood and bone marrow (Figure S6) (McIntosh et al., 2015). To separately study the effects of conditioned medium on CD34+ cells during pre-conditioning and transplantation, we injected freshly thawed cells in conditioned media with no prior cultivation and could not observe differences between the treatments (Figure 6C). We concluded that the pre-conditioning was the main reason for differences in human chimerism. To rule out a loss of stemness of human CB CD34+ cells due to increased differentiation in the cytokine-rich MSC10 medium, we performed hematopoietic colony-forming assays to assess the potential of HSPC to form colonies of the myeloid lineage. One hundred pre-conditioned HSCs were seeded in MethoCult 4034 Optimum and cultured for 16 days, before colonies of the type granulocyte-erythrocyte-monocyte-megakaryocyte (GEMM), GM, or Burst-forming unit-erythroid (BFU-E) were counted. However, we observed no significant differences in the number of colonies between the two conditioned media. Interestingly, the colonies formed by the TSCc pre-conditioned cells were larger and contained higher cell numbers (Figure 6D). As prostaglandin E2 (PGE2) is a well-known enhancer of HSC engraftment and mediator in MSC-derived immune modulation, we hypothesized that higher levels of PGE2 in TSCc might have caused the increase in engraftment by elevating the homing potential (Cutler et al., 2013, Uccelli et al., 2008). However, in line with the other secretome analysis, PGE2 was mainly produced by M10SC but not by TSCs, and is most probably not the explanation for a better engraftment of TSCc-treated HSCs (Figure S7).
Figure 6.

Conditioned Medium from TGFB1-Selected MSCs Provided Superior Support of Human Chimersim
MSCs were selected in MSC10 (MEM α + 10% human serum) or MSC10 with, in addition, 10 ng/mL TGFB1, washed with PBS, and cultured in fresh MSC10 for 24 h to produce conditioned medium. The supernatants and a control medium (StemSpan + KITLG 100 ng/mL) were used to cultivate human CD34+ cord blood cells overnight and to transplant the HSCs via tail vein injection into NBSGW mice. Mice were sacrificed and analyzed 12 weeks after transplantation.
(A) Proliferation of hematopoietic cells after 24 h of cultivation in the different media. Cell numbers are shown relative to condition MSC10.
(B) CD34+ cells were incubated in conditioned or control medium for 18 h and injected in the same medium used for cultivation. The figure shows percentage of human chimerism (CD45+ cells in all CD45+ cells) in the peripheral blood (PB) and bone marrow (BM) of transplanted NBSGW mice. Mouse cohorts 1, 2, and 3 are represented by different shapes.
(C) Human cord blood CD34+ cells were thawed and transplanted in 150 μL conditioned medium. Depicted is the human chimerism (CD45+ cells in all CD45+ cells) in the BM of transplanted NBSGW mice.
(D) One hundred CD34+ cells were seeded in MethoCult 4034 Optimum after cultivation for 18 h in conditioned medium. Colonies and cells were counted 16 days after seeding.
MSC10c, conditioned medium by MSC10-selected MSCs; TSCc, conditioned medium by MSC10 + TGFB1-selected MSCs; GEMM, granulocyte, erythrocyte, monocyte, megakaryocyte; GM, granulocyte, macrophage; BFU-E, Burst-forming unit erythrocyte; ns, not significant; ∗p < 0.05, ∗∗p < 0.01, ∗∗∗p < 0.001 calculated with ANOVA and Tukey post hoc test. The data represent means and the error bars show the SD.
Discussion
In cell therapy clinical trials, MSCs are one of the most often applied cell types (Monsarrat et al., 2016, Wei et al., 2013). The MSCs employed in trials are generated from various tissue sources, expanded in diverse culture conditions, and used in many different disease backgrounds. The therapeutic effects vary among patients and there is insufficient knowledge about the in vivo mode of action elicited by MSCs. Paracrine effects of cytokines produced by the MSCs are believed to be instrumental in modulating immune reactions in the recipients (Galipeau et al., 2015). Apart from the complex disease microenvironment, which might affect the functionality of applied MSCs, the isolation and cultivation processes might also have a tremendous impact on the characteristics of the cell product. In this study, we showed a cytokine and common progenitor-dependent selection of MSC clones. In addition, we observed that TGF-β-selected cells exhibited a notable decrease of cytokine production, lower cell proliferation kinetics, but a beneficial effect on human chimerism after HSC transplantation in mice.
Previously, we reported about the transduction of MSC progenitors in human UCP with lentiviral barcode vectors and how to assess and follow the clonal repertoire during MSC expansion (Selich et al., 2016). Here, we used this powerful technology to analyze the influence of cytokines on the fitness of clones with common progenitors in a bulk culture. Supplementation of our standard culture medium containing 10% human serum with EGF, FGF2, or TGFB1 led to distinct changes in MSC functionality. EGF and FGF2 initially increased and TGFB1 decreased the growth rate of MSC-EM compared with our standard medium. The differences in growth rates were most prominent in early passages and converged to similar levels after several weeks. A possible explanation would be the adaptation and selection of individual clones to the different medium conditions, which would affect the overall proliferation rate of the bulk culture. Our previous study and others have proposed that the niche of MSC is located around the perivascular region in the UC, so that it is possible to transduce MSC culture-initiating or progenitors cells and follow the progeny during ex vivo expansion (Crisan et al., 2008, Selich et al., 2016). Hence, MSC progenitors in the UC were marked with vectors coding for different fluorescent proteins and a genetic barcode, distributed the same marked MSC-EM among the different media, waited for the recovery of the growth rates, and analyzed the cultures in different resolution levels. Flow cytometry and deep sequencing analysis of the barcoded vectors revealed a cytokine-dependent selection of clones from common culture-initiating cells. Jung and colleagues showed the influence of different medium components on the number of colony-forming unit fibroblasts (CFU-F), but concentrated more on a maximum yield of cells in combination with expansion and not on the basic biology of MSCs (Jung et al., 2010). The different numbers of CFU-F and the observed synergistic or inhibitory effect of some cytokine combinations might be the result of distinct growth kinetics from certain MSC culture-initiating cells.
For clinical use of MSCs, it is important to understand whether different culture-initiating cells and the selected clones might have distinct characteristics. The main therapeutic mechanism of MSCs is the secretion of factors and the communication with other cell types (Monsarrat et al., 2016). Our analyses of the MSC secretome after cultivation in different media during the early expansion phase, after initial clonal selection and a later expansion of the reduced clonal repertoire demonstrated the generation of two main groups based on cytokine production or depletion. FGF2 and EGF, which are often used in MSC expansion media, did not show a strong effect on the secreted factors. Strikingly, MSCs in TGFB1 produced minimal amounts of cytokines and, in addition, strongly reduced the levels of other cytokines, suggesting TGFB1 to be a strong regulator of the MSC secretome. Whether the reduction of cytokine concentrations was a result of active consumption by MSCs or a passive degradation process remains to be determined. Our study only quantified secreted cytokines included in the 27-plex. Analysis of other important factors, such as IDO1, should be accomplished in future studies. Of clinical interest, our data demonstrate that the MSC secretome, which can be partially controlled by cell culture conditions, can affect functional properties of other cell types. For example, two leukemia cell lines exhibited maintained or improved proliferation in the cytokine-rich MSC10c medium as compared with the cytokine reduced medium of TSCs. While many different cytokines promote the growth of MO7 and K562 cells, NK92 cells are highly depend upon IL-2, which was not produced by MSCs in either condition (Drexler et al., 1997, Gong et al., 1994, Lozzio and Lozzio, 1973). MSC culture media also influenced the cytotoxic function of NK92 cells, as NK92 cultured in MSC10c showed a similar killing efficiency compared with the positive control, while TSCc reduced the killing efficiency to levels of the negative control. At passages 6 and 8 in the secretome analysis, IL-2 was produced at very low amounts from MSC10 cultivated cells, but not after TSC treatment. Even when NK92 are deprived from IL-2 for 24 h, Park and colleagues showed that IL-15 stimulated the cells and led to specific killing of K562 cells. In contrast to TSC conditions, MSC10 cultured cells produce IL-15 and might thereby support the cytotoxic capacity of NK92 (Park et al., 2011). Similar effects were observed in an MLR assay, where MSC10c was slightly more and TSCc less stimulatory compared with the basal medium. However, the MLR data do not suggest the secretion of a potent immune inhibitory effector under TGFB1 selection. In light of the secretome analysis, we conclude TSCc medium contains overall lower amounts of immunomodulatory cytokines. These data support the possibility to use MSC culture conditions to regulate immune cell functions. In addition, we tested the influence of different conditioned media on the human chimerism in immunodeficient mice, after transplantion of human HSCs. We observed significantly higher rates of hCD45+ cells in animals transplanted with cells conditioned in TSCc compared with MSC10c. The transplantation of freshly thawed HSCs in the conditioned media alone did not lead to an increase in human chimerism. Because conditioned medium from MSC10-selected MSCs contains markedly more cytokines than TSCs, these cytokines could either promote HSC differentiation and reduce the stemness of the cells or negatively affect HSC engraftment. The colony-forming assay is a method to access the lineage potential of hematopoietic cells for myeloid populations. We observed no significant changes in the amount or type of colonies between HSC conditioned in TSCc or MSCc. However, the colonies from TSC pre-conditioned cells were bigger as indicated by the cells numbers. This could be explained by a higher expansion potential of the cells in TSCc and partially explain the observation in the mice. However, whether the precondition increased the proliferation of human cells in the immunodeficient mice or whether the engraftment of HSCs was affected cannot be answered with certainty and is beyond the scope of this paper.
In summary, we showed that clonal selection of MSCs is controllable by the choice of cytokine supplementation and that some cytokines extensively alter MSC function. In particular, FGF2 and EGF increased the expansion potential of MSCs and led to clonal selection from common culture-initiating cells, but did not drastically change the MSC secretome. In contrast, TGF-β signaling enabled the growth of only a few MSC clones and greatly reduced the secretion of cytokines. Most commercially available MSC expansion media for clinical application are optimized for maximum MSC yield after early passages. Since high TGFB1 concentrations markedly reduce the MSC yield, it is possible that—also depending on the application—scientists and companies might decide against media containing this growth factor. However, TGFB1-containing MSC medium may have beneficial effects for some applications, such as HSC engraftment studies. Our results suggest that MSC expansion media should be chosen on the basis of the desired experimental or therapeutic purpose.
Experimental Procedures
UC and MSC Culture
Human UCs were obtained from term deliveries (38–40 weeks) after written informed consent, as approved by Hannover Medical School ethics committee. UCPs were cultivated in MSC15 (MEM α, GlutaMAX Supplement, no nucleosides [Thermo Fisher Scientific], 15% hAB serum [C.C.Pro GmbH], 1% penicillin/streptomycin [PAN-Biotech]). Outgrown MSC monolayers were cultured in MSC10 (MEM α, 10% hAB serum, 1% penicillin/streptomycin) or additionally supplemented with 10 ng/mL hTGFB1 (PeproTech), hFGF2 (PeproTech), or EGF (PeproTech). Cells were passaged twice a week by washing cells with PBS (PAN-Biotech) and detachment with 1× trypsin (PAN-Biotech). The trypsin reaction was stopped with supernatant of each culture (which was set aside before washing) at twice the volume of trypsin. Cells were counted, harvested by centrifugation (400 × g), resuspended in fresh medium and seeded (2.5 × 10⁴ cells/12-well [SARSTEDT], corresponding to 6.85 × 10³ cells/cm2). To calculate the cell division factor (Figure 1), the number of cells harvested at the splitting time point was divided by the number of cells seeded at the previous time point. As we passaged the cells twice a week, either 3 or 4 days were in between each splitting time point. Hence, we calculated the cell division factor per 24 h. For example, a cell division factor of 3 means that after 24 h there were three times more cells than seeded at the previous split.
Cytokine Analysis
Cell supernatant from the different culture conditions was collected before the normal passaging procedure. To account for lot to lot differences of the human AB serum in our secretome analysis, we cultivated MSC10 medium without cells as a control and subtracted the values obtained from this negative control from all other measured values obtained for conditioned media. Conditioned and control media were analyzed in Bio-Plex Pro Human Cytokine 27-plex Assay (Bio-Rad). The PGE2 content was analyzed by ELISA according to the manufacturer's protocol (Invitrogen, KHL1701).
Cell Lines
K562 was purchased from the German Collection of Microorganisms and Cell Cultures (DSMZ) and maintained in MEM α, 10% hAB serum, and 1 mM sodium pyruvate (PAN-Biotech). NK92 was purchased from ATCC and maintained in MEM α, 10% hAB serum, 1 mM sodium pyruvate, and 400 IU/mL IL-2 (Novartis). MO7 was purchased from DSMZ and maintained in MEM α, 10% hAB serum, and 10 ng/mL CSF2 (PeproTech).
Leukemic Cell Growth and NK92 Cytotoxicity Assays
MSC10- or TGFB1-selected cells were cultivated until 80% confluence in a 6-well culture dish (SARSTEDT), medium was removed, cells were washed twice with 2 mL PBS and cultivated in 1.5 mL MSC10 for 24 h (conditioned media, passages 5–8). MO7 were starved for 3 days without additional CSF2 in the medium. Equal amount of cells were distributed in triplicates among MSC10 (negative control), MSC10 + 10 ng/mL CSF2 (positive control), and both conditioned media. Cells were counted after 2 days. K562 and NK92 were equally distributed in triplicates among MSC10 (negative control), MSC10 + 400 IU/mL hIL-2 (positive control), and both conditioned media. Cells were counted after 2 days. NK92 and K562 were mixed in a ratio of 1:1 for the NK92 cytotoxicity assay and distributed in triplicates among MSC10 (negative control), MSC10 + 400 IU/mL hIL-2 (positive control), and both conditioned media. K562 were counted after being 2 days on an orbital shaker at 100 rpm.
MLR Assay
PBMCs from HLA-mismatched donors were isolated with Biocoll (Merck) according to the manufacturer's protocol and stored in liquid nitrogen (−170°C). After thawing, one donor was stained with eFlour670 and the other with CFSE (Invitrogen), mixed (5 × 10⁵:5 × 10⁵) and cultivated in 750 μL of MSC10, MSC10 + IL-2 (Novartis) (400 IU/mL), MSC10 + IL-2 (400 IU/mL) + hIL-10 (PeproTech) (500 IU/mL), MSC10c, and TSCc in 24-well plates (SARSTEDT). All media used in MLR reactions contained 20 mM HEPES (PAN-Biotech) and 50 μM mercaptoethanol (Sigma). After 4 days, medium was replaced. Cells were analyzed after 7 days by flow cytometry. To specifically analyze T cell proliferation, cells were stained with anti-hCD3-eFluor450 (eBioscience, catalog no. 48-0037-42). Proliferating T cells were quantified by the expression of CD3 and loss of e650 and CFSE. Statistical significance was calculated with Kruskal-Wallis and Dunn's multiple comparison test.
HSC Transplantation and Colony-Forming Assay
Human cord blood was obtained from term deliveries (38–40 weeks) after written informed consent, as approved by Hannover Medical School ethics committee. Human CD34+ cells were isolated with Biocoll (Merck) and human CD34 MicroBead Kit (Miltenyi) according to the manufacturer's protocol. MSC-EMs were selected in either MSC10 or MSC10 + TGFB1. Selected cultures were washed with PBS and cultivated in MSC10 medium for 24 h to generate conditioned medium MSC10c (after MSC10 selection) or TSCc (after MSC10 + TGFB1 selection), which was stored frozen at −20°C until further use (passages 5–8). Human CD34+ cells were thawed and cultured for 18 h in either one of the conditioned media or StemSpan (STEMCELL Technologies) supplemented with 100 ng/mL KITLG (PeproTech) for 18 h. Cells were harvested by centrifugation (300 × g, 5 min) and resuspended in the respective media used for cultivation. We injected 2–4.5 × 10⁴ cells/150 μL into the tail vein of non-irradiated NBSGW mice (McIntosh et al., 2015). An aliquot of hCD34+ from the same donor was freshly thawed on the day of transplantation and injected with identical cell numbers in 150 μL of conditioned medium. Mice were sacrificed 12 weeks later and analyzed. Bone marrow and peripheral blood were stained with DAPI (Sigma-Aldrich), hCD45-FITC (BioLegend, catalog no. 304006), mCD45-PerCP-Cy5.5 (Thermo Fisher Scientific, catalog no. 45-0452-82), hCD3-APC (BioLegend, catalog no. 317318), hCD19-PE (Thermo Fisher Scientific, catalog no. 12-0198-42), hCD33-BV605 (BioLegend, catalog no. 366612), and the corresponding isotype controls. We seeded 100 CD34+ cells after cultivation in MSC10c or TSCc (18 h) for hematopoietic colony-forming assays (MethoCult H4034 Optimum, STEMCELL). Colonies (GEMM, GM, and BFU-E) and cells were counted 16 days after seeding.
Virus Production and Transduction
The lentiviral barcode vectors were described previously (Cornils et al., 2014, Selich et al., 2016). We replaced the spleen focus-forming virus promoter by the chromatin-opening element (CBX3) in combination with the elongation factor 1α promoter to reduce the chance of insertion mutagenesis and the silencing of the gene expression (Cornils et al., 2014, Hoffmann et al., 2017). Viral supernatants were produced in a four-plasmid split packaging system as described previously and stored at −80°C until use (Schambach et al., 2006, Voelkel et al., 2012). UCs were cut into small pieces (1 cm), washed with PBS, cultivated for 4 h in MSC10, washed again several times with PBS, cultivated for an additional 20 h, and washed with PBS to remove glycol precipitates, which block the access of the virus to the UCP. The UCPs were transduced in a final volume of 500 μL MSC10 virus mix supplemented with 4 μg/mL protamine sulfate (Sigma-Aldrich) for 16 h in a 24-well plate format (SARSTEDT). UCPs were transferred to a 12-well plate (SARSTEDT) and cultivated as described above to induce MSC cultures. To transduce the MSC culture independent from the progenitors in the UCP, we waited until approximately 105 MSCs grew out. The UC and old media were removed from the well, cells were washed with PBS, and transduced in a final volume of 500 μL MSC10 virus mix (4 μg/mL protamine sulfate). After 16 h, MSC10 virus mix was removed, cells were detached and distributed among the medium replicates.
Flow Cytometry
To determine the expression of transgenes, MSC-EMs were analyzed with a BD LSR II flow cytometer (BD Biosciences) and the FlowJo 7.6.5 software (FlowJo). For Cerulean, a 404-nm laser and 450/50 filter was used; for Venus, a 488-nm laser and 525/50 filter with 505LP was used; and, for mCherry, a 523-nm laser and 610/20 filter with 600LP was used. For DAPI, a 404-nm laser and 450/50 filter was used; for FITC, a 488-nm laser and 525/50 filter with 505LP was used; for PerCP-Cy5.5, a 488-nm laser and 685/35 filter with 675LP was used; for APC, a 639-nm laser and 670/14 filter was used; for PE, a 523-nm laser and 575/26 filter was used; and for BV650, a 404-nm laser and 585/42 filter with 575LP was used.
Deep Sequencing Preparation
The DNA was isolated with QIAamp DNA Blood Mini Kit (QIAGEN). The amplicon preparation was performed as described previously (Selich et al., 2016). In short, the barcodes were amplified in a nested PCR. To distinguish different samples in a single deep sequencing run, one of the outer PCR primers contained a sample-specific tag. The pooled samples were sequenced via the Ion Torrent Personal Genome Machine system (Thermo Fisher Scientific).
Data Processing and Statistics
Deep sequencing results were screened for sample-specific tags of the primer to assign the sequences to the different samples with a custom Perl 5 script (https://www.perl.org). In a second step, the sequences were screened for the barcode flanking parts “TACCATCTAGA” and “CTCGAGACT” embedding a region between 42 and 52 base pairs to remove unspecific amplicons and to allow a certain error rate. The last step of preprocessing was performed with a custom R (https://www.R-project.org/) script. The barcodes contain 16 random nucleotides, which leads to 416 different barcodes. The probability of two independent barcodes to differ in a certain number of nucleotides depends on the amount of barcodes found, and is resembled by a binomial distribution. Sequencing errors show usually smaller differences to the original sequence than real independent barcodes. A cutoff was chosen dependent on the binomial distribution to allow 1% falsely clustered barcodes. Stepwise, the most abundant and unclustered barcode was compared with all other unclustered barcodes, all barcodes below the cutoff were rated as sequencing errors and added to the currently most abundant barcode. Principal-component analysis was performed with basic R commands and the Shannon diversity index with the package vegan (Oksanen et al., 2017). All graphs, except in Figure 5, were made with the R package ggplot2 (Wickham, 2009) and statistics calculated with basic R commands. Significance was tested with Kruskal-Wallis, Wilcoxon-Mann-Whitney U test, and p values adjusted with Bonferroni except for Figure 5. Figure 5 was generated with GraphPad Prism 6 (GraphPad Software), value passed D'Agostino's K-squared normality test and significance was controlled with one-way ANOVA and Tukey multiple comparison test post hoc test.
Author Contributions
Conceptualization: A. Selich, A. Schambach, M.R.; Methodology: A. Selich, T.-C.H., C.S.F., C.v.K., A. Schambach, M.R.; Software: A. Selich, M.R.; Validation: A. Selich, M.R.; Formal Analysis: A. Selich, C.S.F., M.R.; Investigation: A. Selich, T.-C.H., M.M., C.S.F., A. Schambach, M.R.; Resources: A. Selich, T.-C.H., M.M., C.S.F., C.v.K., A. Schambach, M.R.; Data Curation: A. Selich, M.R.; Writing – Original Draft: A. Selich, A. Schambach, M.R.; Writing – Review & Editing: A. Selich, T.-C.H., M.M., C.S.F., C.v.K., A. Schambach, M.R.; Visualization: A. Selich, A. Schambach, M.R.; Supervision: , A. Schambach, M.R.; Project Administration: A. Selich, M.M., C.S.F., C.v.K., A. Schambach, M.R.; Funding Acquisition: , A. Schambach, M.R.
Acknowledgments
We thank the group of Ulrich Lehmann from the Institute of the Molecular Pathology at the Hannover Medical School, especially Stephan Bartels and Elisa Schipper, for their excellent support with Ion Torrent sequencing, the Core Facility Immunmonitoring, especially Jana Keil and Kerstin Daemen, for their support with the secretome analysis, Marion Haidukiewicz for helping with the umbilical cord preparation, and Jannik Daudert (Institute for Experimental Hematology, Hannover Medical School) for helpful discussions on the barcode clustering script. This work was supported by the Deutsche Forschungsgemeinschaft (DFG grant RO 5102/1-1), Cluster of Excellence REBIRTH (Exc 62/1), and SFB 738.
Published: July 11, 2019
Footnotes
Supplemental Information can be found online at https://doi.org/10.1016/j.stemcr.2019.06.001.
Supplemental Information
We analyzed the secretome of differentially cultivated MSCs by a Bio-Plex Pro Human Cytokine 27-plex, and the most interesting proteins are depicted in Figure 4. The complete set is provided in Figure S5. As 27 different proteins for 4 medium conditions and three different passages were analyzed, the statistical result is too complex for the main part, but provided in the supplementary material.
References
- Avanzi G.C., Lista P., Giovinazzo B., Miniero R., Saglio G., Benetton G., Coda R., Cattoretti G., Pegoraro L. Selective growth response to IL-3 of a human leukaemic cell line with megakaryoblastic features. Br. J. Haematol. 1988;69:359–366. doi: 10.1111/j.1365-2141.1988.tb02374.x. [DOI] [PubMed] [Google Scholar]
- von Bahr L., Batsis I., Moll G., Hägg M., Szakos A., Sundberg B., Uzunel M., Ringden O., Le Blanc K. Analysis of tissues following mesenchymal stromal cell therapy in humans indicates limited long-term engraftment and no ectopic tissue formation. Stem Cells. 2012;30:1575–1578. doi: 10.1002/stem.1118. [DOI] [PubMed] [Google Scholar]
- Beksac M., Yurdakul P. How to improve cord blood engraftment? Front. Med. 2016;3:7. doi: 10.3389/fmed.2016.00007. [DOI] [PMC free article] [PubMed] [Google Scholar]
- Cornils K., Thielecke L., Hüser S., Forgber M., Thomaschewski M., Kleist N., Hussein K., Riecken K., Volz T., Gerdes S. Multiplexing clonality: combining RGB marking and genetic barcoding. Nucleic Acids Res. 2014;42:e56. doi: 10.1093/nar/gku081. [DOI] [PMC free article] [PubMed] [Google Scholar]
- Crisan M., Yap S., Casteilla L., Chen C.W., Corselli M., Park T.S., Andriolo G., Sun B., Zheng B., Zhang L., Norotte C. A perivascular origin for mesenchymal stem cells in multiple human organs. Cell Stem Cell. 2008;3:301–313. doi: 10.1016/j.stem.2008.07.003. [DOI] [PubMed] [Google Scholar]
- Cutler C., Multani P., Robbins D., Kim H.T., Le T., Hoggatt J., Pelus L.M., Desponts C., Chen Y.B., Rezner B. Prostaglandin-modulated umbilical cord blood hematopoietic stem cell transplantation. Blood. 2013;122:3074–3081. doi: 10.1182/blood-2013-05-503177. [DOI] [PMC free article] [PubMed] [Google Scholar]
- Drexler H.G., Zaborski M., Quentmeier H. Cytokine response profiles of human myeloid factor-dependent leukemia cell lines. Leukemia. 1997;11:701–708. doi: 10.1038/sj.leu.2400633. [DOI] [PubMed] [Google Scholar]
- Galipeau J., Krampera M., Barrett J., Dazzi F., Deans R.J., DeBruijn J., Dominici M., Fibbe W.E., Gee A.P., Gimble J.M. International society for cellular therapy perspective on immune functional assays for mesenchymal stromal cells as potency release criterion for advanced phase clinical trials. Cytotherapy. 2015;18:151–159. doi: 10.1016/j.jcyt.2015.11.008. [DOI] [PMC free article] [PubMed] [Google Scholar]
- Gong J.H., Maki G., Klingemann H.G. Characterization of a human cell line (NK-92) with phenotypical and functional characteristics of activated natural killer cells. Leukemia. 1994;8:652–658. [PubMed] [Google Scholar]
- Gottipamula S., Muttigi M.S., Kolkundkar U., N Seetharam R. Serum-free media for the production of human mesenchymal stromal cells: a review. Cell Prolif. 2013;46:608–627. doi: 10.1111/cpr.12063. [DOI] [PMC free article] [PubMed] [Google Scholar]
- Guimarães-Camboa N., Evans S.M. Are perivascular adipocyte progenitors mural cells or adventitial fibroblasts? Cell Stem Cell. 2017;20:587–589. doi: 10.1016/j.stem.2017.04.010. [DOI] [PMC free article] [PubMed] [Google Scholar]
- Hoffmann D., Schott J.W., Geis F.K., Lange L., Müller F.J., Lenz D., Zychlinski D., Steinemann D., Morgan M., Moritz T., Schambach A. Detailed comparison of retroviral vectors and promoter configurations for stable and high transgene expression in human induced pluripotent stem cells. Gene Ther. 2017;24:298–307. doi: 10.1038/gt.2017.20. [DOI] [PubMed] [Google Scholar]
- Jung S., Sen A., Rosenberg L., Behie L.A. Identification of growth and attachment factors for the serum-free isolation and expansion of human mesenchymal stromal cells. Cytotherapy. 2010;12:637–657. doi: 10.3109/14653249.2010.495113. [DOI] [PubMed] [Google Scholar]
- Kean T.J., Lin P., Caplan A.I., Dennis J.E. MSCs: delivery routes and engraftment, cell-targeting strategies, and immune modulation. Stem Cells Int. 2013;2013:732742. doi: 10.1155/2013/732742. [DOI] [PMC free article] [PubMed] [Google Scholar]
- Lozzio C.B., Lozzio B.B. Cytotoxicity of a factor isolated from human spleen 2. J. Natl. Cancer Inst. 1973;50:535–538. doi: 10.1093/jnci/50.2.535. [DOI] [PubMed] [Google Scholar]
- De Luca L., Trino S., Laurenzana I., Lamorte D., Caivano A., Del Vecchio L., Musto P. Mesenchymal stem cell derived extracellular vesicles: a role in hematopoietic transplantation? Int. J. Mol. Sci. 2017;18 doi: 10.3390/ijms18051022. [DOI] [PMC free article] [PubMed] [Google Scholar]
- McIntosh B.E., Brown M.E., Duffin B.M., Maufort J.P., Vereide D.T., Slukvin I.I., Thomson J.A. Nonirradiated NOD,B6.SCID Il2rγ-/- Kit(W41/W41) (NBSGW) mice support multilineage engraftment of human hematopoietic cells. Stem Cell Reports. 2015;4:171–180. doi: 10.1016/j.stemcr.2014.12.005. [DOI] [PMC free article] [PubMed] [Google Scholar]
- Monsarrat P., Vergnes J.N., Planat-Bénard V., Ravaud P., Kémoun P., Sensebé L., Casteilla L. An innovative, comprehensive mapping and multiscale analysis of registered trials for stem cell-based regenerative medicine. Stem Cells Transl. Med. 2016;5:826–835. doi: 10.5966/sctm.2015-0329. [DOI] [PMC free article] [PubMed] [Google Scholar]
- Oksanen J., Blanchet G., Friendly M., Kindt R., Legendre P., McGlinn D., Minchin P.R., O'Hara R.B., Simpson G.L., Solymos P. Community ecology package. 2017. https://github.com/vegandevs/vegan/issues
- Park J.Y., Lee S.H., Yoon S.R., Park Y.J., Jung H., Kim T.D., Choi I. IL-15-induced IL-10 increases the cytolytic activity of human natural killer cells. Mol. Cells. 2011;32:265–272. doi: 10.1007/s10059-011-1057-8. [DOI] [PMC free article] [PubMed] [Google Scholar]
- Rizk M., Monaghan M., Shorr R., Kekre N., Bredeson C.N., Allan D.S. Heterogeneity in studies of mesenchymal stromal cells to treat or prevent GVHD: a scoping review of the evidence. Biol. Blood Marrow Transplant. 2016;22:1416–1423. doi: 10.1016/j.bbmt.2016.04.010. [DOI] [PubMed] [Google Scholar]
- Rodrigues M., Griffith L.G., Wells A. Growth factor regulation of proliferation and survival of multipotential stromal cells. Stem Cell Res. Ther. 2010;1:32. doi: 10.1186/scrt32. [DOI] [PMC free article] [PubMed] [Google Scholar]
- Schambach A., Bohne J., Chandra S., Will E., Margison G.P., Williams D.A., Baum C. Equal potency of gammaretroviral and lentiviral SIN vectors for expression of O6-methylguanine-DNA methyltransferase in hematopoietic cells. molecular therapy. J. Am. Soc. Gene Ther. 2006;13:391–400. doi: 10.1016/j.ymthe.2005.08.012. [DOI] [PubMed] [Google Scholar]
- Selich A., Daudert J., Hass R., Philipp F., von Kaisenberg C., Paul G., Cornils K., Fehse B., Rittinghausen S., Schambach A., Rothe M. Massive clonal selection and transiently contributing clones during expansion of mesenchymal stem cell cultures revealed by lentiviral RGB-barcode technology. Stem Cells Transl. Med. 2016;5:591–601. doi: 10.5966/sctm.2015-0176. [DOI] [PMC free article] [PubMed] [Google Scholar]
- Spellerberg I.F., Fedor P.J. A tribute to Claude Shannon (1916-2001) and a plea for more rigorous use of species richness, species diversity and the ‘Shannon-Wiener’ index. Glob. Ecol. Biogeogr. 2003;12:177–179. [Google Scholar]
- Tang X., Yang L., Li Z., Nalin A.P., Dai H., Xu T., Yin J., You F., Zhu M., Shen W. First-in-man clinical trial of CAR NK-92 cells: safety test of CD33-CAR NK-92 cells in patients with relapsed and refractory acute myeloid leukemia. Am. J. Cancer Res. 2018;8:1083–1089. [PMC free article] [PubMed] [Google Scholar]
- Uccelli A., Moretta L., Pistoia V. Mesenchymal stem cells in health and disease. Nat. Rev. Immunol. 2008;8:726–736. doi: 10.1038/nri2395. [DOI] [PubMed] [Google Scholar]
- Voelkel C., Galla M., Dannhauser P.N., Maetzig T., Sodeik B., Schambach A., Baum C. Pseudotype-independent nonspecific uptake of gammaretroviral and lentiviral particles in human cells. Hum. Gene Ther. 2012;23:274–286. doi: 10.1089/hum.2011.011. [DOI] [PubMed] [Google Scholar]
- Wang M., Yuan Q., Xie L. Mesenchymal stem cell-based immunomodulation: properties and clinical application. Stem Cells Int. 2018;2018:3057624. doi: 10.1155/2018/3057624. [DOI] [PMC free article] [PubMed] [Google Scholar]
- Wei X., Yang X., Han Z.P., Qu F.F., Shao L., Shi Y.F. Mesenchymal stem cells: a new trend for cell therapy. Acta Pharmacol. Sin. 2013;34:747–754. doi: 10.1038/aps.2013.50. [DOI] [PMC free article] [PubMed] [Google Scholar]
- Wickham H. Springer; 2009. 35 Ggplot2-Elegant Graphics for Data Analysis.http://had.co.nz/ggplot2/book [Google Scholar]
- Zhao G., Liu F., Lan S., Li P., Wang L., Kou J., Qi X., Fan R., Hao D., Wu C. Large-scale expansion of Wharton’s Jelly-derived mesenchymal stem cells on gelatin microbeads, with retention of self-renewal and multipotency characteristics and the capacity for enhancing skin wound healing. Stem Cells Res. Ther. 2015;6:38. doi: 10.1186/s13287-015-0031-3. [DOI] [PMC free article] [PubMed] [Google Scholar]
- Zhao Q., Ren H., Han Z. Mesenchymal stem cells: immunomodulatory capability and clinical potential in immune diseases. J. Cell Immunother. 2016;2:3–20. [Google Scholar]
Associated Data
This section collects any data citations, data availability statements, or supplementary materials included in this article.
Supplementary Materials
We analyzed the secretome of differentially cultivated MSCs by a Bio-Plex Pro Human Cytokine 27-plex, and the most interesting proteins are depicted in Figure 4. The complete set is provided in Figure S5. As 27 different proteins for 4 medium conditions and three different passages were analyzed, the statistical result is too complex for the main part, but provided in the supplementary material.