

Summary
Objective
This prospective study explores whether dieting attempts and previous changes in weight predict changes in body mass index (BMI) and waist circumference (WC).
Methods
The study was based on the representative Finnish Health 2000 Survey and on its follow‐up examination 11 years later. The sample included 2,785 participants, aged 30–69. BMI and WC were determined at health examinations. Information on dieting attempts and previous changes in weight was collected using a questionnaire including questions on whether participant had tried to lose weight (no/yes), gained weight (no/yes) or lost weight (no/yes) during the previous year.
Results
At baseline, 32.8% were dieters. Of these, 28.4% had lost weight during the previous year. Dieters had higher BMI and WC than non‐dieters. During the follow‐up, the measures increased more in dieters and in persons with previous weight loss. The mean BMI changes in non‐dieters versus dieters were 0.74 (standard deviation [SD] 2.13) kg/m2 and 1.06 (SD 2.77) kg/m2 (P = 0.002), respectively. The corresponding numbers for those with no previous weight change versus those who had lost weight were 0.65 (SD 2.07) kg/m2 and 1.52 (SD 2.61) kg/m2. The increases in BMI and WC were most notable in dieters with initially normal weight.
Conclusions
The increases in BMI and WC were greater in dieters than in non‐dieters, suggesting dieting attempts to be non‐functional in the long term in the general population.
Keywords: Dieting attempts, follow‐up, obesity, weight change
Introduction
The prevalence of dieting is high worldwide, with approximately 40% of general adult populations having tried to lose weight at some point during the last 5 years 1. Dieting is supposed to lead to weight loss, which among individuals with initial obesity or overweight, thus, has several health benefits 2, 3, 4. Previous studies on dieting and subsequent changes in weight, however, have yielded inconsistent results 5, 6, 7, 8, 9, 10, 11, 12, 13, 14, 15, 16, 17, 18, 19. Several weight loss clinical trials have shown that weight loss can be achieved and, with adherence to a regimen, also maintained for a certain period of time 5, 6. By contrast, the majority of longitudinal observational population studies have shown subsequent weight gain among self‐report dieters 7, 8, 9, 10, 11, 12, 13, 14, 15, 16, 17, although some of the findings have been divergent with dieting predicting both weight loss and weight gain 18, 19. Findings on factors modifying the prediction of dieting attempts on later weight gain have been scarce and partly inconsistent, with young female 7 and male 10 dieters and middle‐aged female 10 dieters being at higher risk. Moreover, having normal weight 10, 13 or more frequent intentional weight loss episodes 13, 15 seem to predict greater risk to gain more weight, whereas dietary restraint among dieters may help to attenuate later weight gain 14. In addition to dieting, it has also been demonstrated that recent weight changes predict subsequent weight gain 20, but the evidence on the effect of weight cycling on later weight gain 21, somatic health 21 and psychological factors 22 remains sparse. In persons with obesity, weight cycling is associated with decreased perception of health and well‐being, although it does not seem to have adverse effects on mood and general psychological functioning 22.
Variety in the definition of dieting and unsatisfactory consideration of confounding and effect‐modifying factors may have affected the results of previous studies addressing dieting and subsequent changes in weight. Most of the longitudinal studies have been carried out in non‐representative samples or with relatively short follow‐up times (most ranging from 1 to 6 years, with a few exceptions up to 15 years), thus giving an unsatisfactory view of weight changes because of self‐report dieting 23.
The aim of this study was to examine in a representative population sample the prediction of self‐report dieting attempts and previous changes in weight on subsequent changes in body mass index (BMI) and waist circumference (WC) during a long, 11‐year follow‐up. Special emphasis was put on control for a comprehensive set of potential confounding factors and consideration of potential effect modification by baseline BMI and a wide set of sociodemographic, lifestyle, psychological and health‐related factors. Based on previous findings from observational studies, it was hypothesized that dieting attempts independently of potential confounding factors would predict subsequent weight gain.
Methods
Study population
The data are based on the Health 2000 24 and 2011 25 Surveys. The Health 2000 Survey, conducted in 2000–2001, was a national health examination survey producing comprehensive information on health, well‐being and functional capacity with interviews, questionnaires and a health examination. The health examination covered anthropometric measurements, bioimpedance measurements, clinical examination and measurements, oral examination and drawing of blood samples. The survey was based on a two‐stage stratified cluster sampling design. The nationally representative sample consisting of individuals aged 30 years and over living in mainland Finland included 8,028 individuals. Of the original sample, 7,419 (92% of the sample) participated in some part of the survey, and 6,771 (84% of the sample) participated in a health examination. The Health 2011 Survey, carried out in 2011–2012, was a follow‐up study of the Health 2000 Survey. A total of 6,222 individuals who had been included in the Health 2000 Survey, were still alive, living in Finland, had contact details available and who had not refused to participate in further surveys were invited to participate. Of the invited sample, 4,006 participated in a health examination (64% of the sample).
Health 2000 and 2011 Surveys were conducted according to the guidelines laid down in the Declaration of Helsinki, and all procedures involving human subjects were approved by the Ethics Committee of the Hospital District of Helsinki and Uusimaa. Written informed consent was obtained from all subjects.
The data used in the present study covered 2,785 individuals (1,268 men and 1,517 women), aged 30–69 years at baseline, who were not pregnant at either measurement point, with reliable information available on BMI and WC at both measurement points and with previous dieting and weight change information available at baseline.
Measures
Data on dieting attempts, weight loss and weight gain during the previous year were collected at baseline using a self‐administered questionnaire. Subjects were asked whether they had tried to lose weight during the previous year (no/yes) and, accordingly, divided into ‘non‐dieters’ and ‘dieters’. The subjects were also asked whether they had gained weight (no/yes) and whether they had lost weight (no/yes) during the previous year. According to these questions, a four‐class variable including the categories ‘no’, ‘lost’, ‘gained’ and ‘weight fluctuation’ was created. Weight fluctuation was defined as having both lost and gained weight during the previous year. Further questions concerning amounts of gained (range 1–25 kg, mean 3.97 [standard deviation, SD 2.49] kg) and lost weight (range 1–38 kg, mean 5.11 [SD 4.00] kg) during the previous year (kg) were omitted because of small numbers of individuals and potentially low reliability of the variables.
Information on BMI and WC was collected at health examinations at both measurement points. Weight (kg) was measured with eight‐polar bioimpedance devices (in Health 2000: InBody 3.0, Biospace, Seoul, South Korea; in Health 2011: Seca mBCA Model 5154 with Software Seca analytics 115, Seca, Hamburg, Germany). The results were recorded with a precision rate of 0.1 kg. The participants' height (cm) was measured using a wall‐mounted stadiometer with the participant standing without shoes against the measurement scale, and it was recorded in the Health 2000 with a precision rate of 0.5 cm and in the Health 2011 with a precision rate of 0.1 cm. WC (cm) was measured using a regular, flexible tailor's measuring tape in standing position on the bare skin from the midpoint between the lowest rib bones and a high point of the iliac crest, and it was recorded in the Health 2000 with a precision rate of 0.5 cm and in the Health 2011 with a precision rate of 0.1 cm. The BMI was calculated as weight (kg) divided by the square of height (m2). Obesity was defined as BMI ≥ 30 kg/m2, overweight as BMI ≥ 25 kg/m2 but <30 kg/m2, normal weight as BMI < 25 kg/m2 and abdominal obesity as WC ≥ 88 cm for women and ≥102 cm for men 26. The change in BMI and WC during the follow‐up was calculated as (measure in 2011) − (measure in 2000).
Data on age, sex and geographical area were derived from national registers. Age was used as a continuous variable and as divided into four 10‐year categories. Geographical area was divided into five university hospital regions: Helsinki, Turku, Tampere, Kuopio and Oulu. Data on marital status, education, smoking, cancer diagnosis and self‐rated health were collected via interviews. Marital status was divided into four categories: married or cohabiting, divorced or separated, widowed and single. Education was divided into three categories: low (did not graduate from upper secondary school or vocational school), intermediate (graduated from upper secondary school or vocational school) and high (graduated from university or vocational high school). Smoking was divided into never smokers, former smokers and current smokers. Cancer diagnosis was divided into never having had cancer and having had cancer. Self‐rated health was divided into two categories: good or quite good perceived health and average, quite poor or poor perceived health. Data on leisure‐time physical activity and alcohol consumption were measured using self‐administered questionnaires. Leisure‐time physical activity was divided into three categories: those who were not physically active (‘low physical activity’), those who regularly engaged in light physical activity like walking or cycling (‘moderate physical activity’) and those who reported exercising for 3 h or more per week or training for competitive sports (‘regular physical training’). Alcohol consumption (g/week) was used as a continuous variable and as divided into non‐users, moderate users (1–199 for men or 1–99 for women) and heavy users (200 or over for men or 100 or over for women).
Diet was assessed using a validated self‐administered food frequency questionnaire designed to assess food intake during the previous year 27, 28. Average daily consumption of each food group and the supply of nutrients and energy intake (kcal/day) were calculated using the National Finnish Food Composition Database (Fineli®) and in‐house software (Finessi) 29. The Alternate Healthy Eating Index (AHEI) 30 was selected as a measure of diet quality. In this study, the index was composed to imitate the original AHEI as closely as possible while taking into account the special characteristics of the Finnish dietary culture 31. Energy intake and the AHEI were used as a continuous variable and as divided into sex‐specific quintiles.
Sense of coherence (SOC) was assessed using Antonovsky's SOC‐13 scale 32. The mean from the questions was calculated and divided into sex‐specific quartiles. Social support was measured as a part of a questionnaire via a self‐assessment scale, including questions concerning possibilities to obtain help and support from people close to oneself. The sum from the questions was calculated and divided into sex‐specific tertiles. Information about mental disorders, based on Diagnostic and Statistical Manual of Mental Disorders, Fourth Edition, diagnostics, was collected face to face using the Munich‐Composite International Diagnostic Interview (M‐CIDI) 33 during the health examination. Based on the structured questions in the M‐CIDI, a depressive disorder variable and an anxiety disorder variable were formed. Information on burnout, measured using the Maslach Burnout Inventory 34, was collected only from subjects who had been working during the last 12 months. The weighted sum from the questions was calculated and divided into sex‐specific quartiles.
Information on type 2 diabetes (International Statistical Classification of Diseases, 10th Revision, E11) was derived from questionnaires, interviews, health examinations and a nationwide register of patients receiving diabetes medication reimbursement kept by the Social Insurance Institution, and in this study, the disease was defined as certain previously diagnosed diabetes or possible diabetes. During the health examination, a determination of knee or hip arthrosis was made by physicians on the basis of physical status, symptoms and medical history 24, 35. Information on elevated blood pressure was derived from the health examination (the mean of two blood pressure measurements) and the interview (the use of anti‐hypertensive medication) and was determined as systolic pressure equal to or over 130 mmHg or diastolic pressure equal to or over 85 mmHg, or use of anti‐hypertensive medication.
Statistical analysis
The strength of association between dieting attempts and weight change during the previous year versus descriptive and potential confounding factors was estimated using linear regression. The prediction of dieting and weight change on changes in continuous BMI and WC was studied using three linear models: model 1 included the respective dieting variable, sex and age; model 2 included model 1 and the confounding factors education, marital status, leisure‐time physical activity, alcohol consumption (continuous), smoking, energy intake (continuous), AHEI (continuous) and geographical area; model 3 included model 2 and the baseline value of the outcome variable in question. Model‐adjusted mean levels were estimated 36. Effect modification was studied (Tables 4, 5 and S2) by including in the model in question (model 1, 2 or 3) an interaction term between dieting and the potential interaction variable at issue.
Table 4.
Mean changes and their standard deviations in BMI and WC during an 11‐year follow‐up by interaction of self‐report dieting attempts during the previous year and BMI at baseline
| Obesity measure | n | Dieting attempts during the previous year | P for interactiona | |||||||||||
|---|---|---|---|---|---|---|---|---|---|---|---|---|---|---|
| No | Yes | |||||||||||||
| BMI at baseline (kg/m2) | BMI at baseline (kg/m2) | |||||||||||||
| <25 (n = 934) | 25–29.9 (n = 707) | ≥30 (n = 231) | <25 (n = 191) | 25–29.9 (n = 409) | ≥30 (n = 313) | |||||||||
| Mean | SD | Mean | SD | Mean | SD | Mean | SD | Mean | SD | Mean | SD | |||
| BMI (kg/m2) | ||||||||||||||
| Model 1b | 2,785 | 0.78 | 1.82 | 0.81 | 2.15 | 0.76 | 3.10 | 1.36 | 2.40 | 1.17 | 2.55 | 0.49 | 3.14 | 0.005 |
| Model 2c | 2,644 | 0.76 | 1.81 | 0.81 | 2.12 | 0.69 | 3.10 | 1.41 | 2.42 | 1.17 | 2.52 | 0.54 | 3.14 | 0.01 |
| WC (cm) | ||||||||||||||
| Model 1b | 2,764 | 2.19 | 6.19 | 2.51 | 7.11 | 2.71 | 8.76 | 4.12 | 8.19 | 3.49 | 8.23 | 1.64 | 8.82 | 0.002 |
| Model 2c | 2,623 | 2.11 | 6.18 | 2.58 | 7.08 | 2.48 | 8.76 | 4.12 | 8.23 | 3.47 | 8.18 | 1.65 | 8.78 | 0.005 |
BMI, body mass index; n, number of subjects in respective category; SD, standard deviation; WC, waist circumference.
Interaction for dieting attempts and BMI at baseline.
Model 1: mean changes adjusted for sex and age (continuous). Standard deviations are unadjusted.
Model 2: mean changes adjusted for model 1, and education, marital status, leisure‐time physical activity, alcohol consumption (continuous), smoking, energy intake (continuous), Alternate Healthy Eating Index (continuous) and geographical area. Standard deviations are unadjusted.
Table 5.
Mean changes and their standard deviations in BMI and WC during an 11‐year follow‐up by interaction of self‐report dieting attempts during the previous year and self‐report weight change during the previous year
| Obesity measure | n | Dieting attempts during the previous year | P for interactionb | |||||||||||||||
|---|---|---|---|---|---|---|---|---|---|---|---|---|---|---|---|---|---|---|
| No | Yes | |||||||||||||||||
| Weight change during the previous year | Weight change during the previous year | |||||||||||||||||
| No (n = 1,112) | Lost (n = 213) | Gained (n = 513) | Weight fluctuationa (n = 34) | No (n = 219) | Lost (n = 258) | Gained (n = 318) | Weight fluctuationa (n = 118) | |||||||||||
| Mean | SD | Mean | SD | Mean | SD | Mean | SD | Mean | SD | Mean | SD | Mean | SD | Mean | SD | |||
| BMI (kg/m2) | ||||||||||||||||||
| Model 1c | 2,785 | 0.68 | 2.01 | 1.43 | 2.09 | 0.73 | 2.34 | 1.14 | 2.56 | 0.64 | 2.39 | 1.61 | 3.00 | 0.56 | 2.65 | 1.30 | 3.08 | 0.58 |
| Model 2d | 2,644 | 0.67 | 2.00 | 1.35 | 2.08 | 0.74 | 2.33 | 1.14 | 2.56 | 0.68 | 2.39 | 1.66 | 2.98 | 0.56 | 2.59 | 1.35 | 3.11 | 0.31 |
| Model 3e | 2,644 | 0.62 | 2.00 | 1.29 | 2.08 | 0.75 | 2.33 | 1.15 | 2.56 | 0.73 | 2.39 | 1.70 | 2.98 | 0.63 | 2.59 | 1.42 | 3.11 | 0.25 |
| WC (cm) | ||||||||||||||||||
| Model 1c | 2,764 | 2.08 | 6.71 | 4.36 | 6.49 | 2.14 | 7.26 | 3.13 | 7.61 | 1.69 | 7.52 | 4.57 | 8.95 | 2.00 | 8.24 | 4.63 | 9.31 | 0.62 |
| Model 2d | 2,623 | 2.03 | 6.71 | 4.14 | 6.46 | 2.16 | 7.24 | 3.03 | 7.61 | 1.59 | 7.57 | 4.68 | 8.90 | 1.99 | 8.08 | 4.65 | 9.38 | 0.44 |
| Model 3e | 2,623 | 1.63 | 6.71 | 3.61 | 6.46 | 2.27 | 7.24 | 3.22 | 7.61 | 2.17 | 7.57 | 5.16 | 8.90 | 2.56 | 8.08 | 5.20 | 9.38 | 0.38 |
BMI, body mass index; n, number of subjects in respective category; SD, standard deviation; WC, waist circumference.
Weight fluctuation means having lost and gained weight during the previous year.
Interaction for dieting attempts and weight change.
Model 1: mean changes adjusted for sex and age (continuous). Standard deviations are unadjusted.
Model 2: mean changes adjusted for model 1, and education, marital status, leisure‐time physical activity, alcohol consumption (continuous), smoking, energy intake (continuous), Alternate Healthy Eating Index (continuous) and geographical area. Standard deviations are unadjusted.
Model 3: mean changes adjusted for model 2, and baseline information of the outcome variable in question (continuous). Standard deviations are unadjusted.
All analyses were performed using SAS 9.3 37.
Results
Baseline characteristics
Approximately one‐third of the study population had tried to diet (Table 1). Dieters were more frequently women and non‐smokers, consumed more alcohol and less energy and had a higher diet quality than non‐dieters. Moreover, they had a worse SOC and more often had an anxiety disorder, type 2 diabetes, arthrosis and elevated blood pressure, but less often had cancer, than non‐dieters. Dieters had also more often obesity than non‐dieters and reported more often previous changes in weight. Of dieters, 28.4% had lost weight, whereas 34.2% had gained weight and 12.6% had weight fluctuation during the previous year. Of the dieters who had lost weight, 22.1% had normal weight, 48.8% had overweight and 29.5% had obesity. Those reporting previous changes in weight were more commonly women, younger, exercised less and had more often obesity than the individuals reporting no changes in weight. Those who had lost weight or reported weight fluctuation during the previous year had the highest quality of diet, most often suffered from depressive or anxiety disorder and had the most often dieting attempts. By contrast, those who reported gaining weight during the previous year had the worst SOC, the highest burnout score and least often self‐rated their health as good.
Table 1.
Sex‐adjusted and age‐adjusted baseline status of the study population by self‐report dieting attempts and self‐report weight change during the previous year (n = 2,785)
| Baseline variable | n | Mean | SD | Dieting attempts during the previous year | Weight change during the previous year | ||||||||||||
|---|---|---|---|---|---|---|---|---|---|---|---|---|---|---|---|---|---|
| No (n = 1,872) | Yes (n = 913) | No (n = 1,331) | Lost (n = 471) | Gained (n = 831) | Weight fluctuationa (n = 152) | P for heterogeneity | |||||||||||
| Mean | SD | Mean | SD | P for heterogeneity | Mean | SD | Mean | SD | Mean | SD | Mean | SD | |||||
| Sociodemographic factors | |||||||||||||||||
| Sex (% male) | 2,785 | 45.5 | 51.4 | 33.5 | <0.0001 | 51.8 | 43.1 | 40.3 | 26.3 | <0.0001 | |||||||
| Age (years) | 2,785 | 47.2 | 10.2 | 47.2 | 10.4 | 47.1 | 9.80 | 0.91 | 47.6 | 10.1 | 46.9 | 10.5 | 47.2 | 10.2 | 44.0 | 10.2 | 0.0007 |
| High education (%) | 2,779 | 37.1 | 35.9 | 39.4 | 0.07 | 37.0 | 37.6 | 35.6 | 44.1 | 0.23 | |||||||
| Married/cohabiting (%) | 2,779 | 77.8 | 77.1 | 79.2 | 0.21 | 77.5 | 77.3 | 78.3 | 79.0 | 0.94 | |||||||
| Lifestyle factors | |||||||||||||||||
| Leisure‐time physical training ≥ 3 h/week (%) | 2,772 | 21.5 | 20.9 | 22.8 | 0.24 | 23.4 | 22.8 | 18.3 | 18.0 | 0.02 | |||||||
| Alcohol consumption (g/week) | 2,777 | 75.8 | 127.4 | 72.1 | 132.3 | 83.4 | 116.8 | 0.02 | 73.6 | 135.5 | 78.9 | 133.4 | 78.2 | 116.0 | 71.9 | 89.4 | 0.75 |
| Current smoker (%) | 2,778 | 25.9 | 27.5 | 22.5 | 0.004 | 27.3 | 27.8 | 23.3 | 21.4 | 0.08 | |||||||
| Energy intake (kcal/day) | 2,669 | 2,304 | 754 | 2,325 | 747 | 2,259 | 761 | 0.03 | 2,306 | 742 | 2,343 | 809 | 2,294 | 749 | 2,209 | 678 | 0.28 |
| AHEI score (range 7–35) | 2,669 | 21.4 | 4.84 | 21.0 | 4.83 | 22.2 | 4.76 | <0.0001 | 21.2 | 4.81 | 22.0 | 4.94 | 21.2 | 4.73 | 22.4 | 5.22 | 0.0004 |
| Psychiatric, psychological and social factors | |||||||||||||||||
| Depressive disorderb (%) | 2,715 | 6.78 | 6.25 | 7.87 | 0.12 | 5.47 | 9.86 | 6.86 | 8.24 | 0.01 | |||||||
| Anxiety disorderc (%) | 2,719 | 4.05 | 3.26 | 5.66 | 0.003 | 3.37 | 6.03 | 3.66 | 5.91 | 0.05 | |||||||
| Sense of coherenced (range 1–7) | 2,718 | 5.51 | 0.77 | 5.55 | 0.76 | 5.43 | 0.80 | 0.0002 | 5.55 | 0.76 | 5.51 | 0.77 | 5.43 | 0.79 | 5.48 | 0.76 | 0.005 |
| Maslach Burnout Inventorye (range 0–5.6) | 2,106 | 1.14 | 0.89 | 1.12 | 0.86 | 1.19 | 0.94 | 0.12 | 1.11 | 0.85 | 1.10 | 0.90 | 1.23 | 0.93 | 1.14 | 0.90 | 0.04 |
| Social supportf (range 0–28) | 2,776 | 7.50 | 3.37 | 7.46 | 3.29 | 7.59 | 3.50 | 0.34 | 7.48 | 3.35 | 7.73 | 3.48 | 7.33 | 3.22 | 7.88 | 3.77 | 0.08 |
| Health‐related factors | |||||||||||||||||
| Type 2 diabetesg (%) | 2,785 | 2.30 | 1.53 | 3.87 | 0.0001 | 1.76 | 3.88 | 2.21 | 2.58 | 0.07 | |||||||
| Arthrosish (%) | 2,783 | 4.56 | 3.75 | 6.24 | 0.003 | 3.55 | 5.65 | 5.29 | 6.10 | 0.09 | |||||||
| Elevated blood pressurei (%) | 2,785 | 53.6 | 50.5 | 60.0 | <0.0001 | 52.5 | 49.9 | 56.5 | 58.4 | 0.03 | |||||||
| Cancerj (%) | 2,778 | 2.66 | 3.12 | 1.74 | 0.03 | 2.22 | 3.81 | 2.86 | 1.96 | 0.28 | |||||||
| Good self‐rated healthk (%) | 2,778 | 72.2 | 73.1 | 70.4 | 0.14 | 75.0 | 71.6 | 68.3 | 71.0 | 0.005 | |||||||
| Obesity measures | |||||||||||||||||
| BMI (kg/m2) | 2,785 | 26.5 | 4.40 | 25.4 | 3.94 | 28.9 | 4.51 | <0.0001 | 25.4 | 4.07 | 26.6 | 4.47 | 27.9 | 4.31 | 28.6 | 5.13 | <0.0001 |
| WC (cm) | 2,783 | 91.0 | 12.9 | 88.2 | 12.2 | 96.8 | 13.2 | <0.0001 | 88.5 | 12.3 | 91.0 | 13.3 | 94.3 | 12.7 | 95.7 | 14.7 | <0.0001 |
| People with obesityl (%) | 2,785 | 19.5 | 12.1 | 34.7 | <0.0001 | 12.3 | 19.5 | 28.2 | 35.1 | <0.0001 | |||||||
| People with abdominal obesitym (%) | 2,783 | 35.4 | 25.8 | 55.1 | <0.0001 | 27.6 | 34.6 | 45.7 | 49.8 | <0.0001 | |||||||
| Exposure measures | |||||||||||||||||
| Dieting attempts during the previous year (%) | 2,785 | 32.8 | 17.1 | 54.5 | 37.7 | 75.7 | <0.0001 | ||||||||||
| Weight change during the previous year (%) | 2,785 | ||||||||||||||||
| No change | 1,331 | 47.8 | 59.0 | 24.8 | <0.0001 | ||||||||||||
| Lost | 471 | 16.9 | 11.3 | 28.4 | <0.0001 | ||||||||||||
| Gained | 831 | 29.8 | 27.7 | 34.2 | 0.0005 | ||||||||||||
| Weight fluctuationa | 152 | 5.46 | 1.97 | 12.6 | <0.0001 | ||||||||||||
AHEI, Alternate Healthy Eating Index; BMI, body mass index; M‐CIDI, Munich‐Composite International Diagnostic Interview; n, number of subjects in respective category; SD, standard deviation; WC, waist circumference.
Weight fluctuation means having lost and gained weight during the previous year.
Depressive disorder based on the structured questions in M‐CIDI interview.
Anxiety disorder based on the structured questions in M‐CIDI interview.
Sense of coherence assessed using Antonovsky's SOC‐13 scale.
Maslach Burnout Inventory; conducted only for those who had been working during the last 12 months.
Social support measured as a part of a questionnaire with self‐assessment scale including questions concerning possibilities to obtain help and support from people close to oneself.
Previously diagnosed certain or possible type 2 diabetes.
Knee or hip arthrosis determination made by physicians during the health examination.
Systolic blood pressure ≥ 130 mmHg, or diastolic blood pressure ≥ 85 mmHg or use of anti‐hypertensive medication.
Self‐report previous or current cancer.
Good self‐rated health covering good or quite good perceived health.
BMI ≥ 30 kg m−2.
WC for women: ≥ 88 cm; for men: ≥ 102 cm.
Follow‐up outcome
During the 11‐year follow‐up, BMI and WC increased by 3.2% and 2.8%, respectively (Table 2). The percentage of subjects with obesity increased from 19.5% to 25%, and the percentage of subjects with abdominal obesity increased from 35.4% to 42.9%. The increase in BMI and WC was more considerable in women; younger age groups; single, divorced or separated individuals; smokers; those receiving less social support from people close to them; and those with poor self‐rated health (Table S1).
Table 2.
Changes in body mass index and waist circumference during the follow‐up
| Measure | n | Measurement point | Changea (%) | P for change | |||
|---|---|---|---|---|---|---|---|
| 2000 | 2011 | ||||||
| Mean | SD | Mean | SD | ||||
| BMI (kg/m2) | 2,785 | 26.5 | 4.40 | 27.4 | 4.79 | 3.2 | <0.0001 |
| WCb (cm) | 2,783 | 91.0 | 12.9 | 93.6 | 13.8 | 2.8 | <0.0001 |
| People with obesityc (%) | 2,785 | 19.5 | 25.0 | 28.2 | <0.0001 | ||
| People with abdominal obesityb , d (%) | 2,783 | 35.4 | 42.9 | 21.2 | <0.0001 | ||
BMI, body mass index; n, number of subjects in respective category; SD, standard deviation; WC, waist circumference.
Change from year 2000 to year 2011.
n in 2000 = 2,783; n in 2011 = 2,766; n in change = 2,764.
BMI ≥ 30 kg/m2.
WC for women: ≥ 88 cm; for men: ≥ 102 cm.
Dieting attempts, previous changes in weight and changes in body mass index and waist circumference during the follow‐up
The increase in both continuous outcome variables, BMI and WC, was more considerable in dieters than in non‐dieters (Table 3, model 3) (Figure 1). The F‐tests of the multivariate adjusted associations between dieting attempts and change in both BMI and WC were statistically significant, P‐values being 0.002 and <0.0001, respectively. A study of the weight change before baseline showed that the largest increase in BMI and WC during the follow‐up occurred in those who reported that they had lost weight or had experienced weight fluctuation during the previous year. Thus, for instance, among those having previously lost weight, the increase in BMI during the follow‐up was more than twofold than in those with no previous changes in weight, the increases being 1.52 (SD 2.61) kg/m2 and 0.65 (SD 2.07) kg/m2, respectively (P < 0.0001).
Table 3.
Mean changes and their standard deviations in BMI and WC during an 11‐year follow‐up by self‐report dieting attempts and self‐report weight change during the previous year (n = 2,785)
| Obesity measure | Dieting attempts during the previous year | Weight change during the previous year | P for heterogeneity | |||||||||||
|---|---|---|---|---|---|---|---|---|---|---|---|---|---|---|
| No (n = 1,872) | Yes (n = 913) | P for heterogeneity | No (n = 1,331) | Lost (n = 471) | Gained (n = 831) | Weight fluctuationa (n = 152) | ||||||||
| Mean | SD | Mean | SD | Mean | SD | Mean | SD | Mean | SD | Mean | SD | |||
| BMI (kg/m2) | ||||||||||||||
| Model 1b | 0.79 | 2.14 | 0.97 | 2.79 | 0.05 | 0.68 | 2.08 | 1.53 | 2.63 | 0.67 | 2.46 | 1.27 | 2.97 | <0.0001 |
| Model 2c | 0.77 | 2.13 | 1.00 | 2.77 | 0.02 | 0.67 | 2.07 | 1.52 | 2.61 | 0.67 | 2.43 | 1.30 | 2.99 | <0.0001 |
| Model 3d | 0.74 | 2.13 | 1.06 | 2.77 | 0.002 | 0.65 | 2.07 | 1.52 | 2.61 | 0.70 | 2.43 | 1.34 | 2.99 | <0.0001 |
| WC (cm) | ||||||||||||||
| Model 1b | 2.38 | 6.90 | 2.99 | 8.54 | 0.04 | 2.01 | 6.85 | 4.48 | 7.92 | 2.09 | 7.64 | 4.30 | 8.95 | <0.0001 |
| Model 2c | 2.33 | 6.88 | 2.99 | 8.50 | 0.03 | 1.96 | 6.86 | 4.44 | 7.88 | 2.10 | 7.57 | 4.27 | 8.99 | <0.0001 |
| Model 3d | 2.07 | 6.88 | 3.54 | 8.50 | <0.0001 | 1.75 | 6.86 | 4.45 | 7.88 | 2.35 | 7.57 | 4.66 | 8.99 | <0.0001 |
BMI, body mass index; n, number of subjects in respective category; SD, standard deviation; WC, waist circumference.
Weight fluctuation means having lost and gained weight during the previous year.
Model 1: mean changes adjusted for sex and age (continuous). Standard deviations are unadjusted.
Model 2: mean changes adjusted for model 1, and education, marital status, leisure‐time physical activity, alcohol consumption (continuous), smoking, energy intake (continuous), Alternate Healthy Eating Index (continuous) and geographical area. Standard deviations are unadjusted.
Model 3: mean changes adjusted for model 2, and baseline information of the outcome variable in question. Standard deviations are unadjusted.
Figure 1.
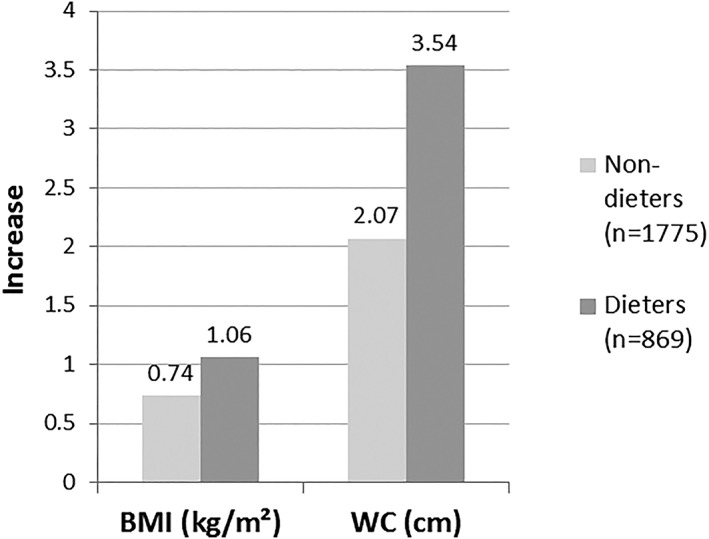
Adjusted* mean increases in BMI and WC during the 11‐year follow‐up by dieting attempts during the previous year (n = 2,644). In all analyses, P for heterogeneity < 0.01. BMI, body mass index; WC, waist circumference. *Adjusted for sex, age, education, marital status, leisure‐time physical activity, alcohol consumption, smoking, energy intake, Alternate Healthy Eating Index, geographical area and baseline information of the outcome variable in question.
Interaction between dieting attempts and baseline body mass index
Consideration of the potential modifying effect of baseline BMI on the association between dieting and subsequent changes in BMI and WC during the follow‐up showed that the increases in BMI (P for interaction = 0.01) and WC (P for interaction = 0.005) were more notable among dieters with initially normal weight than among non‐dieters with initially normal weight (Table 4) (Figure 2). By contrast, growth in both measures appeared to be smaller in dieters with initial obesity than in non‐dieters with initial obesity (Table 4) (Figure 2). The possible effect modification of baseline BMI on the association between previous changes in weight and subsequent change in BMI and WC was tested, and the results proved to be non‐significant (P = 0.82 and P = 0.84, respectively).
Figure 2.
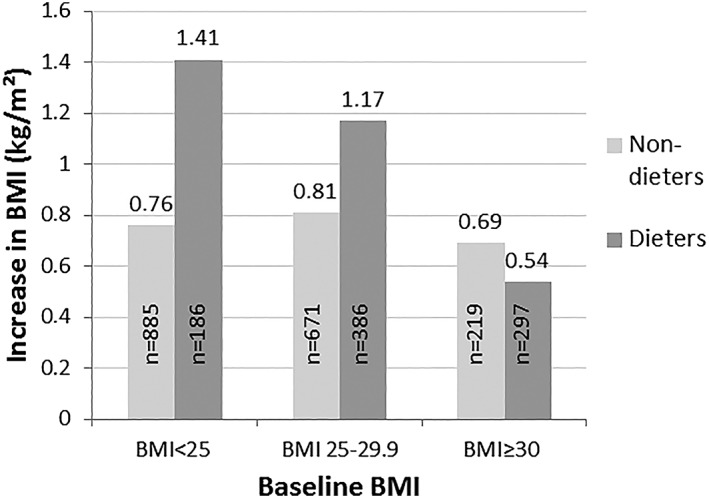
Adjusted* mean increases in BMI during the 11‐year follow‐up by baseline BMI and dieting attempts during the previous year (n = 2,644). P for interaction = 0.01. BMI, body mass index. *Adjusted for sex, age, education, marital status, leisure‐time physical activity, alcohol consumption, smoking, energy intake, Alternate Healthy Eating Index and geographical area.
Interaction between dieting attempts and previous changes in weight
No significant interaction emerged between dieting and previous weight change for changes in BMI or WC during the follow‐up (P = 0.25), despite that a considerable difference between non‐dieters without previous weight change and dieters who had lost weight was noted, with the changes in BMI during the follow‐up being 0.62 (SD 2.00) kg/m2 and 1.70 (SD 2.98) kg/m2, respectively (Table 5, model 3). Further analyses on the interaction between dieting and a comprehensive set of potential effect‐modifying factors (i.e. sociodemographic, lifestyle, psychiatric, psychological and social factors, and health‐related factors) on the prediction of changes in BMI and WC during the follow‐up showed no statistically significant interactions (Table S2). Dieting and physical activity showed a suggestive non‐significant interaction in prediction of an increase in BMI (P = 0.09) and WC (P = 0.07). Of those training regularly, the increases in both measures appeared to be higher in dieters than in non‐dieters.
Discussion
In contrast to several weight loss clinical trials 5, 6, in this study, dieters experienced a greater increase in BMI and WC than non‐dieters. These findings, however, are in line with the majority of previous observational longitudinal studies using self‐report dieting as exposure 7, 8, 9, 10, 11, 12, 13, 14, 15, 16, 17. Most of those studies, conducted both with adolescent populations progressing into adulthood and initial adult populations, have found self‐report dieting and dieting attempts to be associated with later weight gain. However, some conflicting results, with dieting predicting both weight loss and weight gain or the results being non‐significant, have been found as well 18, 19. Even so, in none of the observational studies was dieting associated with subsequent weight loss only.
In addition to dieting attempts, previous weight loss and weight fluctuation predicted subsequent increases in BMI and WC in this study. Accordingly, a cohort study with a 2‐year follow‐up and including 18,001 non‐smoking subjects showed that prior weight cycling and weight loss predicted large weight gain (≥2 kg/year) 20. However, the evidence on an association between weight cycling and weight gain remains inconsistent 21.
It seems that short‐term weight loss can be achieved by weight loss dieting, but in the long term, dieting often results in inverse outcomes. There are a few possible explanations for the conflicting results between the experimental and observational studies. First, the follow‐up times are mostly shorter in weight loss clinical trials than in observational studies. Second, subjects in clinical trials have, on average, more often obesity, whereas in observational studies, the subjects' BMIs vary by a wider range. Third, the concept of dieting may vary between clinical trials and observational studies. In weight loss clinical trials as well as in general usage, dieting is generally perceived as a restriction of energy intake and/or an increase in physical activity. In practice, however, dieting can be carried out in various ways, and subjective perceptions of dieting can differ from reality. Thus, in observational epidemiological studies, self‐report dieting variables presumably cover quite heterogeneous types of dieting and, moreover, may vary according to several factors, for example, BMI at baseline. In subjects with initial obesity, dieting attempts may represent serious efforts to lose substantial amounts of weight, while subjects with initially normal weight may consider it their intention to avoid gaining weight. In addition, personal attitudes towards dieting, social pressure to diet or body image may influence how participants answer the questions concerning dieting. Simultaneous analyses conducted in this study on dieting and previous weight change variables reassert the fact that the dieting attempts variable may not necessarily measure whether or not one has lost weight.
It is possible that dieting as such does not cause weight gain, but it represents a susceptibility to gaining weight because of several other factors. In a review on dieting and future weight gain by Lowe 38, the author concluded that a history of weight loss diets does not cause weight gain beyond what would occur in the absence of dieting. Dieters seem to differ from non‐dieters according to several socio‐economic, lifestyle and health‐related variables. In this study, the increase in BMI and WC was more notable in women; younger age groups; single, divorced or separated individuals; and smokers. Even though these factors were adjusted for, some residual confounding or effect modification cannot be excluded. Furthermore, genetic predisposition may be one factor inducing weight gain. In a longitudinal twin study, the authors suggested that genetic and familial factors may play a meaningful role in weight gain after dieting 10. In that particular study, weight loss attempts were associated with subsequent major weight gain (>10 kg) over both 6‐year and 15‐year periods among initially young men and middle‐aged women but attenuated to non‐significant in pair‐wise twin analyses. However, another longitudinal twin study concluded that besides a genetic predisposition to gain weight, dieting may also have an independent effect on subsequent weight gain 13.
In terms of dieting‐induced weight gain, several possible explanations have been presented. Weight loss, occurring in both fat and lean mass, has been shown to induce both metabolic and behavioural changes by which the body struggles to regain the weight 39, 40. Decreasing body weight and depletion of lean tissue lead to a reduced metabolic rate and energy expenditure, while depletion of both fat and fat‐free mass contributes to compensatory hyperphagia, which persists until the total recovery of fat‐free mass 41, 42. Moreover, varying inter‐individually, weight loss‐induced adaptive thermogenesis diminishes energy expenditure in order to conserve energy 43. In addition to the physiological changes, moral self‐licensing 44 after weight loss may also act as a driver for weight regain. After strict dieting regimen, dieters possibly use self‐licensing (‘I've been so good that now I've earned to pamper myself’) to justify overeating to themselves and, hence, regain weight.
In this study, changes in BMI and WC were assessed according to dieting and various potential effect‐modifying factors. Simultaneous analysis on dieting attempts and previous changes in weight showed suggestive differences in changes in BMI and WC during the follow‐up between the subgroups created. The largest weight gain during the follow‐up occurred in dieters who reported that they had lost weight or experienced weight fluctuation during the previous year while the weight gain was more moderate in non‐dieting and dieting previous weight maintainers and also previous weight gainers. This finding suggests that previous weight loss and weight fluctuation may be stronger predictors of subsequent weight gain than mere attempts at dieting, which could be explained by biological mechanisms activated to regain the weight after weight loss 39.
In this study, the increases in BMI and WC were greater in dieters with initially normal weight than in non‐dieters with normal weight, while no corresponding differences were seen in participants with initial overweight or obesity. Dieting is more common in people with overweight or obesity 1, but it is frequent in populations with normal and underweight as well 45. In accordance with the finding of this study, it has been demonstrated that especially dieters with initial normal weight are prone to later weight gain 42, while no such clear association has been found among persons with initial obesity 46. In dieters with normal weight, weight loss consists more of lean tissue and less of fat mass than it does for dieters with obesity 47. It has been suggested that, as a result of loss of both lean mass and fat mass, feedback signals contribute to weight regain, which favour the replenishment of fat storages and delay protein repletion 42. In people with initial normal weight, this leads to gaining more fat than was lost, thus fat overshooting. Alternatively, in a review article on dieting and weight gain, Lowe 38 concluded that in individuals without initial obesity, weight loss dieting does not induce later weight gain per se. On the contrary, it would represent an individual's predisposition to weight gain because of other factors (e.g. individual characteristics and the obesogenic environment).
In this study, dieting and physical activity showed a suggestive non‐significant interaction in the prediction of an increase in BMI and WC. Of those participants who reported training regularly, the increases in both measures appeared to be higher in dieters than in non‐dieters. Regular physical activity has been shown to prevent from weight gain 48. However, it is possible that the disadvantageous consequences of dieting negate the preventive effects of physical activity. Moreover, it is possible that dieters over‐report their physical activity or that there have been alterations in the physical activity routine of dieters during the follow‐up. Dieters may have used physical activity as a method to lose weight, while also restricting their eating, but eventually have given up on both, possibly overeaten to compensate after strict control and, thus, gained weight.
The major strengths of this study are the representative population sample, the long follow‐up, the valid and reliable BMI and WC measures giving comparable results at both time points and the comprehensive set of potential confounding and effect‐modifying factors considered. There are also some limitations. First, because the BMI and WC were measured only at the beginning and at the end of the follow‐up, the real progress in participants' weight between the time points does not show. Second, the information on dieting attempts and previous changes in weight was assessed only at baseline. During the 11‐year follow‐up, however, dieting behaviour may have changed (some of the non‐dieters may have started dieting and some of the dieters may have discontinued their dieting attempts), affecting the BMI and WC. Third, despite the fairly exhaustive adjustment for potential confounding factors performed, there is still the possibility of residual confounding because of the absence of some variables (i.e. occupational physical activity, perceived body size/image, and eating disorders) in the data. Fourth, because of the skew distributions of some potential effect‐modifying factors (e.g. psychiatric and somatic health), some categories were too small to reveal the possible significance of interaction. Fifth, because of the relatively broad ranges of the amounts of previous weight change, the gained and lost weight categories may be quite heterogeneous. Finally, the validity and reliability of the self‐report dieting variable may vary from one subgroup to another and between studies. Although there are differences in how information on self‐report dieting is obtained in epidemiological cohort studies, apparently, the wording and the structure of the questions do not play a meaningful role because the findings of the studies have been quite similar.
Conclusion
In conclusion, during the follow‐up, BMI and WC increased more in dieters than in non‐dieters, suggesting that dieting attempts are ineffective in the long term among the general population. In individuals with initial obesity, dieting does not necessarily directly lead to greater weight gain, and hence, it should not be avoided by persons with morbid obesity but conducted using evidence‐based strategies. Yet, in persons with initially normal weight, dieting attempts may predispose one to or represent another predisposition to future weight gain. Thus, it is essential to develop preventive strategies against unnecessary dieting attempts and to promote healthy ways of weight maintenance.
Funding
The study was financially supported by a grant from the Finnish Cultural Foundation (L. S.‐J.). The Finnish Cultural Foundation had no role in the design, analysis or writing of this article.
Conflict of interest statement
The authors declared no conflict of interest.
Author contributions
L. S.‐J. and P. K. formulated the research questions and designed the statistical analysis protocol. L. S.‐J. conducted the analyses and wrote the manuscript. All authors contributed to the interpretation of the data, revised the manuscript and approved the final manuscript.
Supporting information
Table S1. Age and sex adjusted mean changes and their standard deviations during an 11‐year follow‐up in BMI and WC by baseline status (n=2785)
Table S2. Adjusteda mean changes and their standard deviations in BMI and WC during an 11‐year follow‐up by interaction of self‐report dieting attempts during the previous year and different baseline variables (n=2644b)
Acknowledgement
The authors acknowledge the National Institute for Health and Welfare, Finland, for providing access to the data from the Health 2000 and 2011 Surveys (BRIF8901).
Sares‐Jäske L., Knekt P., Männistö S., Lindfors O., and Heliövaara M. (2019) Self‐report dieting and long‐term changes in body mass index and waist circumference, Obesity Science & Practice, 5, 291–303. 10.1002/osp4.336.
References
- 1. Santos I, Sniehotta FF, Marques MM, Carraca EV, Teixeira PJ. Prevalence of personal weight control attempts in adults: a systematic review and meta‐analysis. Obes Rev 2017; 18: 32–50. [DOI] [PMC free article] [PubMed] [Google Scholar]
- 2. Hruby A, Manson JE, Qi L, et al. Determinants and consequences of obesity. Am J Public Health 2016; 106: 1656–1662. [DOI] [PMC free article] [PubMed] [Google Scholar]
- 3. Oster G, Thompson D, Edelsberg J, Bird AP, Colditz GA. Lifetime health and economic benefits of weight loss among obese persons. Am J Public Health 1999; 89: 1536–1542. [DOI] [PMC free article] [PubMed] [Google Scholar]
- 4. Rueda‐Clausen CF, Ogunleye AA, Sharma AM. Health benefits of long‐term weight‐loss maintenance. Annu Rev Nutr 2015; 35: 475–516. [DOI] [PubMed] [Google Scholar]
- 5. Franz MJ, VanWormer JJ, Crain AL, et al. Weight‐loss outcomes: a systematic review and meta‐analysis of weight‐loss clinical trials with a minimum 1‐year follow‐up. J Am Diet Assoc 2007; 107: 1755–1767. [DOI] [PubMed] [Google Scholar]
- 6. LeBlanc ES, Patnode CD, Webber EM, Redmond N, Rushkin M, O'Connor EA. Behavioral and pharmacotherapy weight loss interventions to prevent obesity‐related morbidity and mortality in adults: updated evidence report and systematic review for the US Preventive Services Task Force. JAMA 2018; 320: 1172–1191. [DOI] [PMC free article] [PubMed] [Google Scholar]
- 7. Field AE, Aneja P, Austin SB, Shrier LA, de Moor C, Gordon‐Larsen P. Race and gender differences in the association of dieting and gains in BMI among young adults. Obesity (Silver Spring) 2007; 15: 456–464. [DOI] [PubMed] [Google Scholar]
- 8. French SA, Jeffery RW, Forster JL, McGovern PG, Kelder SH, Baxter JE. Predictors of weight change over two years among a population of working adults: the Healthy Worker Project. Int J Obes Relat Metab Disord 1994; 18: 145–154. [PubMed] [Google Scholar]
- 9. Juhaeri, Steven J, Chambless LE, et al. Weight change among self‐reported dieters and non‐dieters in white and African American men and women. Eur J Epidemiol 2001; 17: 917–923. [DOI] [PubMed] [Google Scholar]
- 10. Korkeila M, Rissanen A, Kaprio J, Sørensen TIA, Koskenvuo M. Weight‐loss attempts and risk of major weight gain: a prospective study in Finnish adults. Am J Clin Nutr 1999; 70: 965–975. [DOI] [PubMed] [Google Scholar]
- 11. Neumark‐Sztainer D, Wall M, Story M, Standish AR. Dieting and unhealthy weight control behaviors during adolescence: associations with 10‐year changes in body mass index. J Adolesc Health 2012; 50: 80–86. [DOI] [PMC free article] [PubMed] [Google Scholar]
- 12. Lowe MR, Annunziato RA, Markowitz JT, et al. Multiple types of dieting prospectively predict weight gain during the freshman year of college. Appetite 2006; 47: 83–90. [DOI] [PubMed] [Google Scholar]
- 13. Pietiläinen KH, Saarni SE, Kaprio J, Rissanen A. Does dieting make you fat? A twin study. Int J Obes (Lond) 2012; 36: 456–464. [DOI] [PubMed] [Google Scholar]
- 14. Savage JS, Hoffman L, Birch LL. Dieting, restraint, and disinhibition predict women's weight change over 6 y. Am J Clin Nutr 2009; 90: 33–40. [DOI] [PMC free article] [PubMed] [Google Scholar]
- 15. Siahpush M, Tibbits M, Shaikh RA, Singh GK, Sikora Kessler A, Huang TT. Dieting increases the likelihood of subsequent obesity and BMI gain: results from a prospective study of an Australian national sample. Int J Behav Med 2015; 22: 662–671. [DOI] [PubMed] [Google Scholar]
- 16. van Strien T, Herman CP, Verheijden MW. Dietary restraint and body mass change. A 3‐year follow up study in a representative Dutch sample. Appetite 2014; 76: 44–49. [DOI] [PubMed] [Google Scholar]
- 17. Viner RM, Cole TJ. Who changes body mass between adolescence and adulthood? Factors predicting change in BMI between 16 year and 30 years in the 1970 British Birth Cohort. Int J Obes (Lond) 2006; 30: 1368–1374. [DOI] [PubMed] [Google Scholar]
- 18. Bild DE, Sholinsky P, Smith DE, Lewis CE, Hardin JM, Burke GL. Correlates and predictors of weight loss in young adults: the CARDIA study. Int J Obes Relat Metab Disord 1996; 20: 47–55. [PubMed] [Google Scholar]
- 19. Coakley EH, Rimm EB, Colditz G, Kawachi I, Willett W. Predictors of weight change in men: results from the Health Professionals Follow‐up Study. Int J Obes Relat Metab Disord 1998; 22: 89–96. [DOI] [PubMed] [Google Scholar]
- 20. Kroke A, Liese AD, Schulz M, et al. Recent weight changes and weight cycling as predictors of subsequent two year weight change in a middle‐aged cohort. Int J Obes Relat Metab Disord 2002; 26: 403–409. [DOI] [PubMed] [Google Scholar]
- 21. Mackie GM, Samocha‐Bonet D, Tam CS. Does weight cycling promote obesity and metabolic risk factors? Obes Res Clin Pract 2017; 11: 131–139. [DOI] [PubMed] [Google Scholar]
- 22. Foster GD, Sarwer DB, Wadden TA. Psychological effects of weight cycling in obese persons: a review and research agenda. Obes Res 1997; 5: 474–488. [DOI] [PubMed] [Google Scholar]
- 23. Lowe MR, Doshi SD, Katterman SN, Feig EH. Dieting and restrained eating as prospective predictors of weight gain. Front Psychol 2013; 4: 577. [DOI] [PMC free article] [PubMed] [Google Scholar]
- 24. Heistaro S. (ed.). Methodology Report. Health 2000 Survey. National Public Health Institute: Helsinki, 2008. [Google Scholar]
- 25. Lundqvist A, Mäki‐Opas T. (eds). Health 2011 Survey – Methods. National Institute for Health and Welfare: Helsinki, 2016. [Google Scholar]
- 26. World Health Organization . Obesity: Prevention and Managing the Global Epidemic. WHO: Geneva, 2004. [Google Scholar]
- 27. Männistö S, Virtanen M, Mikkonen T, Pietinen P. Reproducibility and validity of a food frequency questionnaire in a case–control study on breast cancer. J Clin Epidemiol 1996; 49: 401–409. [DOI] [PubMed] [Google Scholar]
- 28. Paalanen L, Männistö S, Virtanen MJ, et al. Validity of a food frequency questionnaire varied by age and body mass index. J Clin Epidemiol 2006; 59: 994–1001. [DOI] [PubMed] [Google Scholar]
- 29. Reinivuo H, Hirvonen T, Ovaskainen M, Korhonen T, Valsta LM. Dietary survey methodology of FINDIET 2007 with a risk assessment perspective. Public Health Nutr 2010; 13: 915–919. [DOI] [PubMed] [Google Scholar]
- 30. McCullough ML, Feskanich D, Stampfer MJ, et al. Diet quality and major chronic disease risk in men and women: moving toward improved dietary guidance. Am J Clin Nutr 2002; 76: 1261–1271. [DOI] [PubMed] [Google Scholar]
- 31. Sares‐Jäske L, Knekt P, Lundqvist A, Heliövaara M, Männistö S. Dieting attempts modify the association between quality of diet and obesity. Nutr Res 2017; 45: 63–72. [DOI] [PubMed] [Google Scholar]
- 32. Antonovsky A. The structure and properties of the sense of coherence scale. Soc Sci Med 1993; 36: 725–733. [DOI] [PubMed] [Google Scholar]
- 33. Wittchen HU, Lachner G, Wunderlich U, Pfister H. Test–retest reliability of the computerized DSM‐IV version of the Munich‐Composite International Diagnostic Interview (M‐CIDI). Soc Psychiatry Psychiatr Epidemiol 1998; 33: 568–578. [DOI] [PubMed] [Google Scholar]
- 34. Maslach C, Jackson SE, Leiter MP. Maslach Burnout Inventory Manual. Consulting Psychologists Press: Palo Alto (CA), 1996. [Google Scholar]
- 35. Kaila‐Kangas L. (ed.). Musculoskeletal Disorders and Diseases in Finland: Results of the Health 2000 Survey. National Public Health Institute: Helsinki, 2007. [Google Scholar]
- 36. Lee J. Covariance adjustment of rates based on the multiple logistic regression model. J Chronic Dis 1981; 34: 415–426. [DOI] [PubMed] [Google Scholar]
- 37. SAS Institute Inc . SAS/STAT 9.3 User's Guide. SAS Institute Inc: Cary (NC), 2009. [Google Scholar]
- 38. Lowe MR. Dieting: proxy or cause of future weight gain? Obes Rev 2015; 16: 19–24. [DOI] [PubMed] [Google Scholar]
- 39. Sumithran P, Proietto J. The defence of body weight: a physiological basis for weight regain after weight loss. Clin Sci (Lond) 2013; 124: 231–241. [DOI] [PubMed] [Google Scholar]
- 40. Ochner CN, Barrios DM, Lee CD, Pi‐Sunyer FX. Biological mechanisms that promote weight regain following weight loss in obese humans. Physiol Behav 2013; 120: 106–113. [DOI] [PMC free article] [PubMed] [Google Scholar]
- 41. MacLean PS, Higgins JA, Giles ED, Sherk VD, Jackman MR. The role for adipose tissue in weight regain after weight loss. Obes Rev 2015; 16: 45–54. [DOI] [PMC free article] [PubMed] [Google Scholar]
- 42. Dulloo AG, Jacquet J, Montani JP, Schutz Y. How dieting makes the lean fatter: from a perspective of body composition autoregulation through adipostats and proteinstats awaiting discovery. Obes Rev 2015; 16: 25–35. [DOI] [PubMed] [Google Scholar]
- 43. Dulloo AG, Schutz Y. Adaptive thermogenesis in resistance to obesity therapies: issues in quantifying thrifty energy expenditure phenotypes in humans. Curr Obes Rep 2015; 4: 230–240. [DOI] [PubMed] [Google Scholar]
- 44. Merritt A, Effron DA, Monin B. Moral self‐licensing: when being good frees us to be bad. Soc Personal Psychol Compass 2010; 4: 344–357. [Google Scholar]
- 45. Montani JP, Schutz Y, Dulloo AG. Dieting and weight cycling as risk factors for cardiometabolic diseases: who is really at risk? Obes Rev 2015; 16: 7–18. [DOI] [PubMed] [Google Scholar]
- 46. Dulloo AG, Jacquet J, Montani JP. How dieting makes some fatter: from a perspective of human body composition autoregulation. Proc Nutr Soc 2012; 71: 379–389. [DOI] [PubMed] [Google Scholar]
- 47. Forbes GB. Body fat content influences the body composition response to nutrition and exercise. Ann N Y Acad Sci 2000; 904: 359–365. [DOI] [PubMed] [Google Scholar]
- 48. Goldberg JH, King AC. Physical activity and weight management across the lifespan. Annu Rev Public Health 2007; 28: 145–170. [DOI] [PubMed] [Google Scholar]
Associated Data
This section collects any data citations, data availability statements, or supplementary materials included in this article.
Supplementary Materials
Table S1. Age and sex adjusted mean changes and their standard deviations during an 11‐year follow‐up in BMI and WC by baseline status (n=2785)
Table S2. Adjusteda mean changes and their standard deviations in BMI and WC during an 11‐year follow‐up by interaction of self‐report dieting attempts during the previous year and different baseline variables (n=2644b)