Abstract
The opioid inactive isomer (+)-naltrexone is one of the rare Toll-like receptor 4 (TLR4) antagonists with good blood-brain barrier (BBB) permeability, which is a lead with promising potential for treating neuropathic pain and drug addiction. (+)-Naltrexone targets the lipopolysaccharides (LPS) binding pocket of myeloid differentiation protein 2 (MD-2) and blocks innate immune TLR4 signaling. However, the details of the molecular interactions of (+)-naltrexone and its derivatives with MD-2 are not fully understood, which hinders the ligand-based drug discovery. Herein, in silico and in vitro assays were performed to elucidate the innate immune recognition of the opioid inactive (+)-isomers. The results showed that the conserved LPS binding pocket of MD-2 accommodated these opioid inactive (+)-isomers. The calculated binding free energies of (+)-naltrexone and its derivatives in complex with MD-2 correlated well with their experimental binding affinities and TLR4 antagonistic activities. Hydrophobic residues in the MD-2 cavity interacted directly with these (+)-naltrexone based TLR4 antagonists and principally participated in ligand binding. Increasing the hydrophobicity of substituted group at N-9 improved its TLR4 antagonistic activity, while charged groups disfavored the binding with MD-2. Molecular dynamics (MD) simulations showed the binding of (+)-naltrexone or its derivatives to MD-2 stabilized the “collapsed” conformation of MD-2, consequently blocking the binding and signaling of TLR4. Thermodynamics and dynamic analysis showed the topology of substituted group at N-9 of (+)-naltrexone affected the binding with MD-2 and TLR4 antagonistic activity. This study provides a molecular insight into the innate immune recognition of opioid inactive (+)-isomers, which would be of great help for the development of next-generation of (+)-opioid based TLR4 antagonists.
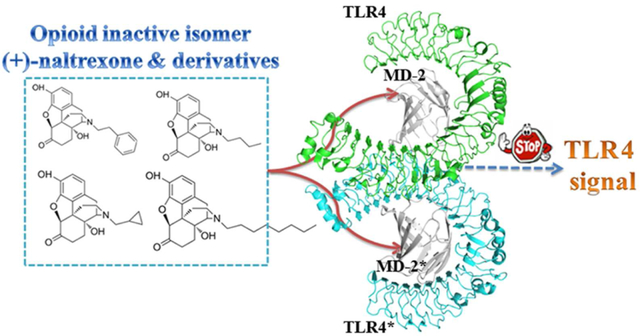
Graphical Abstract
Introduction
The innate immune Toll-like receptor 4 (TLR4) is capable of detecting pathogen-associated molecular patterns (PAMPs)1, damage-associated molecular patterns (DAMPs)2, 3, and xenobiotic-associated molecular patterns (XAMPs)4–6. Myeloid differentiation factor 2 (MD-2), an accessory protein of TLR4, is responsible for recognizing PAMPs, DAMPs and XAMPs, whose signaling via TLR4’s Toll/Interleukin-1 receptor (TIR) domain results in the induction of profound pro-inflammatory factors.7–9 Deregulation of TLR4 signaling contributes to the molecular pathology of various diseases including sepsis, autoimmune disease, neuropathic pain and drug addiction.10–16 Therefore, targeting MD-2 is an important strategy for the discovery of therapeutics in inhibiting TLR4 signaling.17–19
A variety of TLR4 signaling inhibitors targeting MD-2 have been reported.19, 20 Lipid IVa is one of the lipid-like antagonists that competitively blocks lipopolysaccharide (LPS) binding by four acyl chains invading the hydrophobic cavity of MD-2.21–23 Several non-lipid compounds, most of which target MD-2 and show good TLR4 antagonistic activities, have been reported.24–26 Among them, the (+)-opioid inactive isomer (+)-naltrexone is one of the few TLR4 antagonists with good blood-brain barrier (BBB) permeability.16, 27 (+)-Naltrexone inhibits TLR4 signaling by targeting the LPS binding pocket of MD-2 and has demonstrated great potential for treating neuropathic pain and drug addiction.27–30 However, the details of the molecular recognition of (+)-naltrexone with MD-2 are not fully understood, which hinders further structure-activity relationship (SAR) optimization. Herein both in silico and in vitro assays were performed to dissect the innate immune recognition of (+)-naltrexone and its derivatives at the atomic level. The novel molecular insights obtained from this study will guide the development of next-generation of (+)-opioid based TLR4 antagonists.
Materials and Methods
In Silico Simulations
Structure preparation and molecular docking:
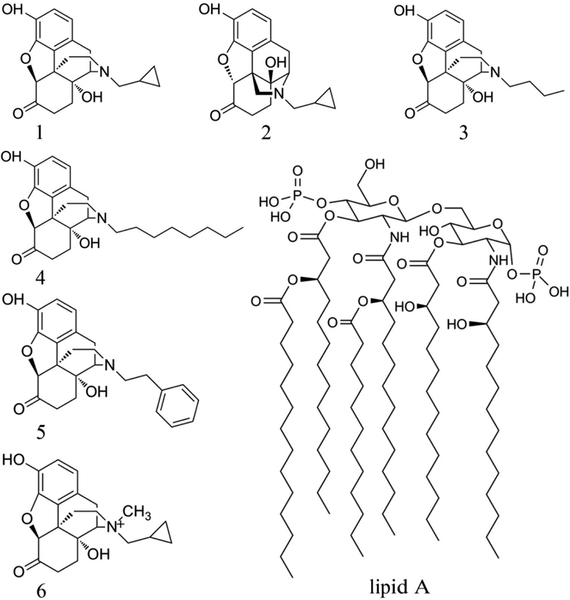
The initial structure for MD-2 was extracted from the crystal structure of TLR4-MD-2-lipid IVa complex (PDB ID: 3VQ1)31. The missing hydrogen atoms were added under pH 7.0 using Maestro32. (+)-Naltrexone and N-9 substituted derivatives (Figure 1) were constructed by GaussView 533. All compounds were optimized by Gaussian 09 software using B3LYP density functional method and 6–31G (d, p) basis set.34–36 Physicochemical properties of (+)-naltrexone and its derivatives were calculated by Chemicalize37. The docking poses were determined by AutoDock Vina38, where the Iterated Local Search Globule Optimizer39, 40 was applied to locate the most favorable binding site. Optimal binding sites were searched in a box of 51×48×56 Å3 that covered the entire protein. It should be noted that semi-flexible molecular docking was carried out and MD-2 was treated as a rigid body. The top 20 poses were picked up based on the calculated binding affinity using the scoring function in AutoDock Vina.38
Figure 1.
Structures of naltrexone and its derivatives. (+)-Naltrexone (1), (−)-naltrexone (2), (+)-N-butylnoroxymorphone (3), (+)-N-octlylnoroxymorphone (4), (+)-N-phenethylnoroxymorphone (5), (+)-N-methylnaltrexone (6) and the head of LPS (lipid A).
Molecular dynamics simulations:
The best binding poses of (+)-naltrexone and its derivatives with MD-2 were refined using MD simulations with NAMD 2.10 program.41 The AMBER 03 force field42, 43 was used for MD-2 protein. Atomic charges of (+)-naltrexone and its derivatives were fitted by R.E.D. based on the quantum mechanics calculations,44 while other atomic parameters were treated with the general AMBER force field (GAFF)43. Meanwhile, MD simulations of apo-MD-2 and lipid A-MD-2 (lipid A is the head of LPS) were also performed. All systems were solvated with TIP3P water molecules in a cubic box, with a minimum distance of 10 Å between the protein and the edge of the box. Na+ and Cl− atoms were added to neutralize the system and mimic the physiological conditions. Periodic boundary conditions were applied in all three directions. The integration time step was set to 2 fs, and the frames were recorded every 20 ps. All bonds involving hydrogen were constrained by SHAKE algorithm45. The Particle-mesh Ewald (PME) method46 was used to calculate the long-range electrostatic interactions. Temperature was kept at 310 K using Langevin dynamics with the collision frequency of 5 ps−1. Pressure was scaled at 1 atm with Nosé-Hoover Langevin piston method47.
All systems were firstly minimized with 5000 steps using the conjugate gradient algorithm, following by heating gradually to 310 K in 310 ps. After that, the volumes of all systems were adjusted under a constant number, pressure and temperature (NPT) ensemble for 2 ns. Subsequently, three independent MD simulations with 100 ns length were performed under a constant number, volume and temperature (NVT) ensemble for each system.
Binding free energy calculation:
Based on the 300 snapshots extracted from the last 30 ns equilibrated MD simulations, the binding free energies of derivatives with MD-2 were calculated using the molecular mechanics Poisson-Boltzmann solvent accessible surface area (MM-PBSA) method48
| (1) |
where Eq 1 consists of the molecular mechanical energy in the gas phase (ΔEMM), the solvation free energy (ΔGsolvation) and the penalty of entropy (-TΔS). The entropy contributions were ignored in present work due to the high computational cost and the low reliability.49–51 ΔEMM can be divided into the van der Waals interactions (ΔEvdW), electrostatic interactions (ΔEele). ΔGsolvation contains polar solvation free energy (ΔGsol-polar) and nonpolar solvation free energy (ΔGsol-nonpolar). Free energy was also decomposed into residue level (ΔGdecomp).
Principal component analysis (PCA):
PCA was carried out using the Bio3D program52 to understand the collective motions of MD-2. Before calculating the covariance matrix, the translation and rotation of the whole molecule were removed by superimposing each frame of production run onto the “core positions” of ten X-ray structures. All PCA calculations were performed from the first frame of the production run. The elements Cij of covariance matrix C was defined as
| (2) |
where xi represents the Cartesian coordinates of the ith Cα atom, the angular brackets 〈〉 denote an ensemble average. The eigenvectors or the principal components (PCs) were obtained via diagonalization of the covariance matrix C.
Free-energy landscape (FEL):
FEL were used to characterize the different conformational states of the MD simulations ensemble.53 Conformations sampled of the production run were projected on the two-dimensional plane, and the number of points was grided. The free energies were calculated by the following equation,
| (3) |
in which kB is the Boltzmann constant, T is the absolute temperature (310K), Pi is the estimation of the probability density function obtained from a histogram of MD data of the ith grid, and Pmax is the probability distribution of the grid containing the maximum number of points.
In Vitro Assays
Fluorescence titrations:
MD-2 expression and purification was performed as described previously.4, 5, 27 Fluorescence measurements were performed on a Cary Eclipse spectrofluorimeter (Agilent Technologies, Santa Clara, CA, USA). All measurements were carried out under room temperature in a 2×10 mm quartz cell (Starna Cells, Atascadero, CA, USA). 295 nm was chosen as the excitation wavelength of MD-2 intrinsic Trp fluorescence and emission at 310–450 nm was measured. Appropriate controls were subtracted from spectra obtained on the samples. Fluorescence was also corrected by the equation, Fcorr = Fobsanti − log ((ODex + ODem) / 2) for the inner filter effect when necessary, where ODex and ODem are the optical densities at excitation and emission wavelengths, respectively.54
0.5 μM MD-2 was titrated with different concentrations of ligand. The fluorescence intensity at 337 nm was plotted against compound concentration. The raw data was fitted by non-linear least square method using the equation:
| (4) |
where F, the observed fluorescence; F0, initial fluorescence of protein in the absence of ligand; FRL, adjustable parameter for protein-ligand complex molar fluorescence; KD, dissociation constant; [LT], total concentration of the ligand; [PT], total protein concentration.
Cell based assay:
(+)-Naltrexone derivatives were kindly provided by Dr. Kenner Rice of the National Institute of Drug Abuse, National Institute of Health (NIH). BV-2 murine microglia was grown in supplemented (Dulbecco Modified Eagle Medium (DMEM), including 10% Fetal Bovine Serum (FBS), 50 unit/mL penicillin, and 50 μg/mL streptomycin). BV-2 cells were detached from the flask by cell lifter when confluence was reached. Cells were seeded at a density of 4×10⁴ cells per well in 96-well plates. After overnight incubation, media was aspirated and changed to DMEM media without FBS. Cells were then treated with 200 ng/ml LPS and various concentrations of compound.
100 μL of supernatant media was removed after cells were treated for 24 h and added to flat black 96-well microfluor plates (Thermo Scientific, MA, USA). Subsequently, 10 μL of 2, 3-diaminonaphthalene (0.05 mg/Ml−1 in 0.62 M HCl) was added to each well and incubated for 15 min. The reaction was quenched by addition of 5 μL of 3 M NaOH and the plate was read on a SYNERGY H1 Micro-plate Reader (BioTek Instruments, Carlsbad, CA, USA) with excitation at 360 nm and emission at 430 nm. The NO of LPS (200 ng/ml) treated group was set as 100%.
Statistical analysis:
Data are expressed as mean ± s.e.m. Fitting and analysis of variance were carried out using OriginPro 2016 (Northampton, MA, USA), where p < 0.05 was considered significantly.
Results and discussion
Biophysical binding:
(+)-Naltrexone (1, Kd = 13.7 ± 0.3 μM) and (−)-naltrexone (2, Kd = 15.5 ± 3.5 μM) bind to MD-2 with the similar dissociation constants.27 1 and 2 are equi-potent inhibitors of LPS-induced TLR4 downstream signaling and induction of the pro-inflammatory factors.29 3, a (+)-naltrexone derivative substituted at N-9 with a butyl group (Figure 1), had a dissociation constant of 5.0 ± 0.8 μM (Figure S1a) when binding to MD-2, and showed ~4 times better TLR4 antagonist activity than 1 and 2.55 The N-9 site of (+)-naltrexone was substituted by a methylcyclopropyl, which has the same carbon chain length as butyl group. Compared to 1, 3 showed greater MD-2 binding affinity and TLR4 antagonistic activity, which indicated the topology of the substituted groups at N-9 affects the molecular recognition with MD-2.
Increasing the hydrophobicity of substituted group at N-9 (Figure 1) by octyl chain (4, Kd = 2.3 ± 0.6 μM, Figure S1b) or phenylethyl group (5, Kd = 2.1 ± 0.3 μM, Figure S1c) improved the binding affinity with MD-2, which was ~8 times better than 1 and 2. 4 and 5 showed ~75 times better TLR4 antagonist activity than 1 and 2.55 However, adding a methyl group onto N-9 of (+)-naltrexone leads to quaternary ammonium cation (6, Figure 1), which showed poor MD-2 binding affinity (Kd > 40 μM) and lost the TLR4 antagonistic activity (Figure S2).
Together, these in vitro results showed that increasing hydrophobicity of substituted group at N-9 improved its binding affinity with MD-2 and its TLR4 antagonistic activity, while charged group disfavored the binding with MD-2. This is consistent with the previous finding that (+)-naltrexone targets hydrophobic LPS binding pocket of MD-2 and indicates that the hydrophobic interactions are dominated in the innate immune recognition of the opioid inactive isomer (+)-naltrexone derived TLR4 antagonists.
Molecular simulations:
In order to elucidate the molecular insight of these opioid inactive (+)-isomers interacting with MD-2, computational simulations were performed. (+)-Naltrexone and its derivatives (Figure 1) were firstly docked into MD-2. The best docking pose with lowest energy of each molecule in MD-2 is given in Figure S3. All were located at the conserved hydrophobic cavity of MD-2 with subtle differences in their backbones orientations. Specifically, 5 with a bulky phenylethyl at N-9 occupied a large portion of the LPS binding location (acyl chains R2′, R2″ and R3; Figure 2). These docking results supported the hypothesis that (+)-naltrexone derived TLR4 antagonists target the LPS binding pocket of MD-2.
Figure 2.
Overlap of the best binding pose of compound 5 with lipid A. Lipid A/MD-2 from (PDB: 3VQ1) was shown to locate the LPS binding pocket of MD-2. MD-2 is shown as the grey cartoon; 5 and lipid A a shown as ball-stick and stick model, respectively.
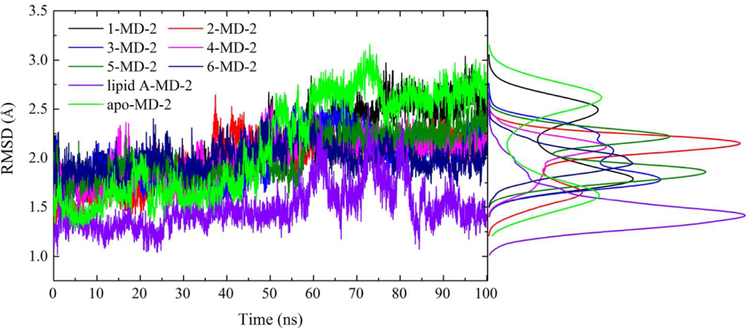
In order to explore the dynamics of the binding with MD-2, MD simulations were performed. The root-mean square deviation (RMSD) values of MD-2 (Figure 3) and TLR4 antagonists (Figure S4) reached a stationary state during 100 ns MD simulation. The RMSD value of lipid A-MD-2 stabilized at ~1.3 Å, while that of apo-MD-2 gradually converged at ~2.6 Å. The RMSD values of MD-2 bound with opioid based TLR4 antagonists were less than that of apo-MD-2. Protein flexibility revealed by RMSD showed that binding with opioid based TLR4 antagonists stabilized MD-2. Compared to Lipid A (Mw: ~1900 Da), opioid based TLR4 antagonists (Mw: ~300 Da) are much smaller and less hydrophobic. Therefore, it is not surprising that opioid based (+)-isomer TLR4 antagonists seem less potent in stabilizing MD-2 when compared to Lipid A. In addition, the MD-2 cavity volume calculated using the CASTp package56 were correlated well with the molar mass of ligands (Figure S5, R2=0.88). These results are consistent with previous observation reported by Bond group, where a strong correlation between MD-2 cavity volume and lipid tail size of endotoxin was found.57
Figure 3.
Time evolution of Cα RMSD during MD simulation. The distribution for RMSD values was also included. Green color indicated apo form of MD-2; black, red, blue, magenta, dark green, navy and violet indicate MD-2 interacting with 1, 2, 3, 4, 5, 6 and lipid A, respectively.
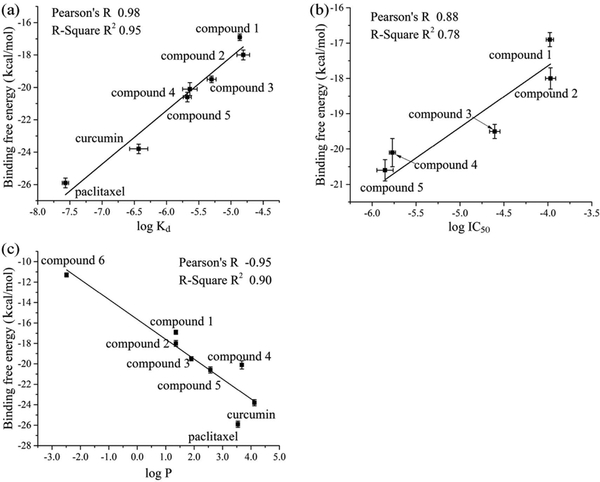
The MM-PBSA method was used to calculate the binding free energy. A total of 300 snapshots were taken from the last 30 ns stable MD simulations. The calculated binding free energies are shown in Table 1, which were correlated well with experimentally determined binding affinities (Figure 4a, R2=0.95) and TLR4 antagonistic activities (Figure 4b, R2 =0.78). Interestingly, the calculated octanol-water partition coefficients log P, which is a measure of molecular hydrophobicity, were also correlated well with the binding free energies (Figure 4c, R2 =0.90). In addition to (+)-naltrexone and its derivatives, it should be noted that two more TLR4 small molecule modulators curcumin (Kd = 0.37 ± 0.12 μM)58 and paclitaxel (Kd = 0.027 ± 0.0028 μM)59 were also included in the plot of calculated binding free energies versus dissociation constants to improve the validity and reliability of the fitting. Interestingly, binding energies of lipid A to MD-2 calculated by MM-PBSA method were 48.5±0.4 kcal/mol, which is in agreement with the observation that approximately 3–4 kJ/mol increments per lipid tail carbon were obtained for binding of LPS analogues to MD-2.60
Table 1.
MM/PBSA derived binding free energies (kcal/mol), experimentally obtained Kd and IC50 values (μM) of (+)-naltrexone and its derivatives to MD-2
| ID | ΔEvdw | ΔEele | ΔGsol-polar | ΔGsol-nonpolar | ΔGbindig | Kd | IC50 |
|---|---|---|---|---|---|---|---|
| 1 | −44.5(0.1) | −1.6(0.1) | 5.5(0.1) | 23.7(0.1) | −16.9(0.2) | 13.7(0.3)a | 105.3(10.1)b |
| 2 | −47.8(0.3) | −1.4(0.1) | 6.6(0.1) | 24.6(0.2) | −18.0(0.3) | 15.5(3.5)a | 107.2(14.3)b |
| 3 | −48.7(0.1) | −0.6(0.1) | 4.7(0.1) | 25.1(0.1) | −19.5(0.2) | 5.0(0.8)c | 24.8(3.4)b |
| 4 | −46.5(0.4) | −2.4(0.3) | 5.1(0.2) | 23.6(0.4) | −20.1(0.4) | 2.3(0.6)c | 1.7(0.1)b |
| 5 | −52.7(0.3) | −1.6(0.1) | 6.1(0.1) | 27.6(0.2) | −20.6(0.3) | 2.1(0.3)c | 1.4(0.3)b |
| 6 | −39.3(0.1) | −6.6(0.1) | 11.9(0.1) | 22.7(0.1) | −11.3(0.2) | > 40d | >400d |
Figure 4.
Correlation of the calculated binding free energies with experimentally determined binding affinities (log Kd, a), antagonistic activities (log IC50, b) and the calculated octanol/water partition coefficient (log P, c)
The decomposition of free energies was performed to elucidate the driving forces of the binding. As shown in Table 1, the contribution of van der Waals interactions (ΔEvdW) was positively correlated with experimentally determined dissociation constants (Figure S6a, R2 = 0.85), while the polar solvation free energy (ΔGsol-polar, Figure S6b, R2 = 0.77) and nonpolar solvation free energy (ΔGsol-nonpolar, Figure S6c, R2 = 0.73) were negatively correlated with dissociation constants. Electrostatic interactions (ΔEele) showed no apparent correlation with the experimentally determined binding affinity (Figure S6d, R2 = 0.04). Combining van der Waals interactions with the nonpolar solvation free energy improved the correlation with experimentally determined dissociation constants (Figure S6e, R2 = 0.95). This indicates the binding of (+)-naltrexone and its derivatives to MD-2 are primarily driven by hydrophobic interactions. However, polar interactions, which includes both electrostatic interactions and polar solvation free energy, were negatively correlated with experimentally determined binding affinities (Figure S6f, R2 = 0.56). These were further supported by the experimental results that the (+)-naltrexone derivative 6 with a quaternary ammonium cation at N-9 site, significantly lost its MD-2 binding affinity and TLR4 antagonistic activity (Figure S2).
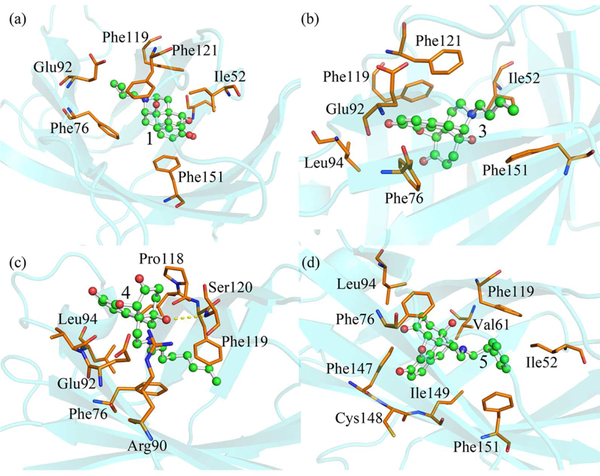
To further investigate how van der Waals interactions regulate the binding of (+)-naltrexone and its derivatives to MD-2, the van der Waals interactions were analyzed by per-residue free energy decomposition. The major van der Waals interactions were contributed by Ile52, Phe76, Phe119, Phe121 and Phe151 residues (Figure S7), which formed hydrophobic interactions with the backbone or substituted group at N-9 of (+)-naltrexone and its derivatives (Figure 5). The flexible butyl group substituted at N-9 of 3 (Figure 5b) has better hydrophobic contact with MD-2 than the methylcyclopropyl group (Figure 5a) of 1, which was consistent with the results that the binding energy contribution of van der Waals interactions of 3 is greater than of that of 1 (Table 1). Therefore, it was not surprising that 3 showed stronger MD-2 binding affinity and better TLR4 antagonistic activity than 1. Though 4 had similar binding energy as 5, they behaved differently. The binding site of 4 was located at the region spanning the mouth of the MD-2 cavity, where a hydrogen bond formed between the 14′-OH of 4 and Ser120 of MD-2. Meanwhile, the octyl group of 4 was buried inside in the LPS binding pocket of MD-2 through hydrophobic interactions (Figure 5c). Compared to flexible octyl group of 4, the bulky phenylethyl group of 5 showed better hydrophobic contact with MD-2. The substituent phenylethyl group of 5 was sandwiched by Phe119 and Phe151, its central benzene of backbone was stabilized by the Phe76, Phe147 and Phe149 with π-stacking interactions (Figure 5d).
Figure 5.
Representative poses of 1 (a), 3 (b), 4 (d) and 5 (e) binding to MD-2 with the lowest-energy during MD simulations. Ligands are shown as ball-and-stick model and MD-2 is shown as cyan cartoon. Key residues of MD-2 in interacting with small molecule antagonists are shown as orange stick. The yellow dash line represents a hydrogen bond.
Dynamic behavior analysis:
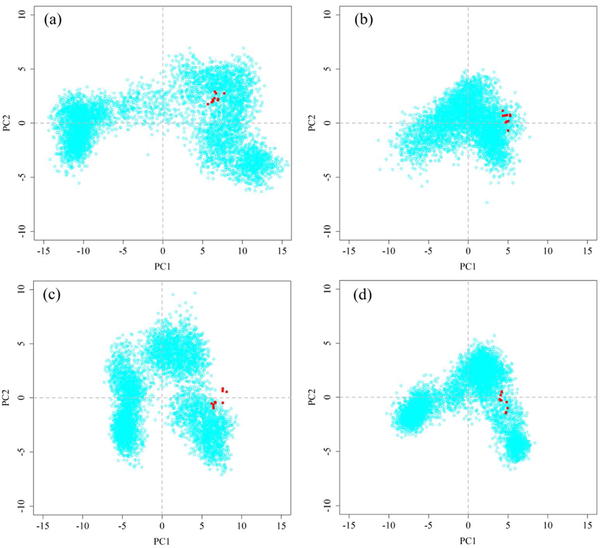
Principal component analysis (PCA) was used to analyze the collective motions of MD-2 during MD simulations. The first two principal components (PC1 and PC2) accounted for approximately 50%~65% of the amplitude motions of MD-2 (Figure S8). Therefore, the projections of MD simulation trajectories onto the first two PCs are sufficient to explain the collective motions61. Apo-MD-2 had the largest conformational space, while its conformational space shrank after the binding of lipid A or (+)-naltrexone and its derivatives (Figures 6 and S9). This indicated that binding with opioid based TLR4 antagonists stabilized MD-2, which is in good agreement with previous RMSD analysis.
Figure 6.
PCA analysis of apo-MD-2 (a), lipid A-MD-2 (b), 4-MD-2 (c), 5-MD-2 (d). Ten X-ray crystallographic MD-2 structures are colored red whilst the distribution of MD conformers is depicted with cyan points.
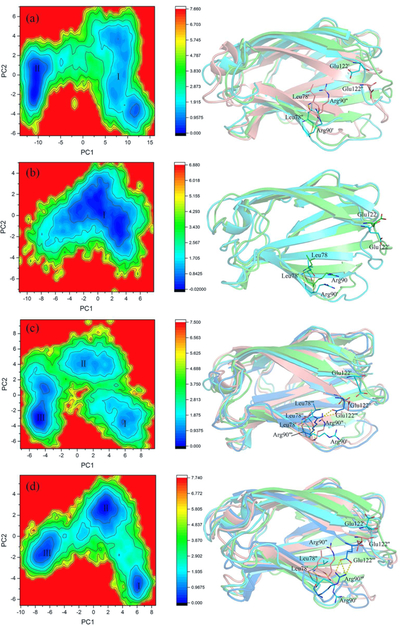
The free energy landscape (FEL) was constructed to correlate the collective motions of MD-2 with the thermodynamics of the conformational transition61. There were two well-defined minima during the apo-MD-2 MD simulation, which was connected by a relatively high (~2 kBT) and long energy path. The representative structure of the first minimum was similar to the initial structure with slight fluctuation. After ~60 ns, the apo-MD-2 overcame the relatively high barrier (~2 kBT) and passed through the long energy path to a deeper FEL basin (minimum ІІ), where the cavity of MD-2 collapsed to an approximately “collapsed” state (Figure 7a). The “openness” of the hydrophobic cavity of MD-2 was defined by a collective distance between the center of mass of MD-2 and to each center of mass of β strand.62 In the presence of lipid A, MD-2 was trapped in a single broad basin, where MD-2 slightly fluctuated around the initial structure and the collapse of MD-2 cavity was not observed (Figure 7b). Unlike lipid A, the sizes of (+)-naltrexone and its derivatives are relatively small. Upon binding with these opioid based TLR4 antagonists, MD-2 structure transformed from the “expanded” state (minimum I) to the “collapsed” conformation (minimum III) through a “meta-state” corresponding to the minimum II (Figures 7 and S10). RMSD and PCA analysis showed that the binding of opioid based TLR4 antagonists stabilized the MD-2 final state when compared to apo-MD-2. Therefore, the binding of (+)-naltrexone or its derivatives stabilized the “collapsed” MD-2 conformation, which blocks the binding and signaling of LPS.
Figure 7.
FEL analysis of MD trajectories of apo MD-2 (a), lipid A-MD-2 (b), 4-MD-2 (c) and 5-MD-2 (d). The representative MD-2 structures corresponding to each FEL basin with the lowest-energy were also shown. State I: cyan color; State II, salmon color; State III, marine color. Key residues involving hydrogen bond interactions at the mouth of MD-2 cavity are shown as stick. Free energy values are given in kcal/mol as indicated by the color bars.
Among the (+)-naltrexone derivatives, binding of 5 clearly reduced the energy barrier (~1 kBT) and facilitated the MD-2 conformation transition into the “collapsed” conformation (minimum III in Figure 7c). During MD simulations, 5 moved into the deep side of cavity of MD-2 from its initial pose (Figure S11d). The binding of 5 induced the rapid collapse of MD-2 cavity to the intermediate state (minimum II) in 5 ns. MD-2 remained in the intermediate basin for ~50 ns, and then evolved into the “collapsed” state (minimum III) overcame an energy barrier of ~1 kBT. In order to track the clamshell-like motion57 of MD-2, the H-bonds at the mouth of MD-2 cavity were monitored. Surprisingly, binding of 5 induced a new H-bond between Arg90 and Glu122 in the minimum III with high occupancies (55~65%, Table S2), which are much higher than the probabilities in other (+)-naltrexone derivative-MD-2 complexes. Arg90 and Glu122 are located at the two sides of MD-2 cavity. The formed H-bond would enhance the stability of the “collapsed” state (minimum III) of MD-2 and block the binding and signaling of LPS.
4 substituted with a flexible octyl group at N-9 had similar binding affinity and antagonistic activity as 5. However, dynamic mechanism analyses showed they behaved differently. 4 initially bound in the cavity closing to the gating loop57 (Figure S11e). The hydrophobic interaction between the octyl group and MD-2 residues drove 4 moving towards the mouth of MD-2 cavity over time. The lipid A-like binding of 4 enhanced the stability of the “collapsed” state of MD-2. Unlike 4 and 5, the size of the substituted groups at N-9 of 1, 2 and 3 are much smaller. During the MD simulation, 1 moved from the initial bound position into the deep pocket of MD-2 (Figure S11a) in a way like 5. 2 (Figure S11b) and 3 (Figure S11c) moved toward the mouth of MD-2 cavity in a way like 4 but remained inside the pocket of MD-2, where a hydrogen bond between 2/3 and Ser120 residue of MD-2 was formed . Although 1 and 2 are stereoisomers and have the similar MD-2 binding affinities as well as TLR4 antagonistic activities,27, 29 they seemed to behave differently in the MD-2 binding. In all, the binding of these (+)-isomer opioid based TLR4 antagonists stabilized the “collapsed” MD-2 conformation, therefore blocking the LPS binding and TLR4 signaling. It is possible to modify the binding and TLR4 antagonistic activity of (+)-naltrexone derivatives by adjusting the hydrophobicity and topology of the substituted groups.
Conclusion
The molecular recognitions and binding modes of (+)-naltrexone inspired antagonists with MD-2 were dissected by in silico and in vitro assays. All these antagonists were bound to a conserved hydrophobic cavity of MD-2 with the order of the binding free energies 5 ≥ 4 > 3 > 2 ≥ 1 > 6, which correlated well with their experimental TLR4 antagonistic activities and binding affinities. Hydrophobic residues, Phe76, Glu92, Phe119, Phe121 and Phe151, were the key residues in stabilizing antagonists via strong hydrophobic interactions. Increasing the hydrophobicity of substitution at the nitrogen (N-9) improves the activity of TLR4 antagonists, while charged groups on nitrogen (N-9) disfavors the binding with MD-2. The binding of (+)-naltrexone or its derivatives stabilized the “collapsed” conformation of MD-2, therefore blocking the LPS binding and TLR4 signaling. Interestingly, thermodynamics and dynamic analysis showed the topology of substituted group at N-9 of (+)-naltrexone affected the binding with MD-2 and TLR4 antagonistic activity. This study dissected the innate immune recognition of (+)-naltrexone and its derivatives, which provided molecular insight for the development of next-generation of (+)-opioid based TLR4 antagonists.
Supplementary Material
Acknowledgments
This work was supported by the National Key Research and Development Program of China (2016YFC0800907), the National Natural Science Foundation of China (21543013, 21374117, 21504092), the 100 Talents Program of Chinese Academy of Sciences, Young Talents Program of Chinese Academy of Agricultural Sciences, Natural Science Foundation of Jilin Province (20160101211JC, 20160520045JH) and the Open Funding of State Key Laboratory of Natural Medicines, China Pharmaceutical University (SKLNMKF201704). Computing time was supported by the National Supercomputer Center in Guangzhou and the Computing Center of Jilin Province. A portion of this work was supported by the intramural research programs of the National Institute on Drug Abuse and the National Institute on Alcohol Abuse and Alcoholism.
Footnotes
This document is confidential and is proprietary to the American Chemical Society and its authors. Do not copy or disclose without written permission. If you have received this item in error, notify the sender and delete all copies.
Supporting information
The Supporting Information is available free of charge on the ACS Publications website: Table S1: Decomposition of per-residue binding free energies; Table S2: Hydrogen bonding interactions of key residues; Figure S1: Titration curves of 3, 4 and 5 binding to MD-2; Figure S2: TLR4 antagonist activity and cellular toxicity of (+)-N-methylnaltrexone (6); Figure S3: The best docking poses of compounds 1–6; Figure S4: time evolution of ligand RMSD; Figure S5: Correlation of MD-2 cavity volume with the molar mass of the ligand; Figure S6: Correlation of the log Kd with the decomposition of binding free energies; Figure S7: Analysis of the van der Waals contribution; Figure S8: Percentages of fluctuations captured by Cartesian-coordinate PCs; Figure S9: PCA analysis of 1-MD-2, 2-MD-2 and 3-MD-2; Figure S10: FEL analysis of MD trajectories of 1-MD-2, 2-MD-2 and 3-MD-2; Figure S11: Alignments of the best docking poses and the poses in the representative MD-2 binding structure.
References
- 1.Takeuchi O; Akira S Pattern recognition receptors and inflammation. Cell 2010, 140, 805–820. [DOI] [PubMed] [Google Scholar]
- 2.Yang H; Hreggvidsdottir HS; Palmblad K; Wang H; Ochani M; Li J; Lu B; Chavan S; Rosas-Ballina M; Al-Abed Y; Akira S; Bierhaus A; Erlandsson-Harris H; Andersson U; Tracey KJ A critical cysteine is required for HMGB1 binding to Toll-like receptor 4 and activation of macrophage cytokine release. Proc. Natl. Acad. Sci. USA 2010, 107, 11942–11947. [DOI] [PMC free article] [PubMed] [Google Scholar]
- 3.Wang X; Smith C; Yin H Targeting Toll-like receptors with small molecule agents. Chem. Soc. Rev 2013, 42, 4859–4866. [DOI] [PMC free article] [PubMed] [Google Scholar]
- 4.Wang XH; Loram LC; Ramos K; de Jesus AJ; Thomas J; Cheng K; Reddy A; Somogyi AA; Hutchinson MR; Watkins LR; Yin H Morphine activates neuroinflammation in a manner parallel to endotoxin. Proc. Natl. Acad. Sci. USA 2012, 109, 6325–6330. [DOI] [PMC free article] [PubMed] [Google Scholar]
- 5.Hutchinson M; Northcutt A; Hiranita T; Wang X; Lewis S; Thomas J; Van Steeg K; Kopajtic T; Loram L; Sfregola C Opioid activation of toll-like receptor 4 contributes to drug reinforcement. J. Neurosci 2012, 32, 11187–11200. [DOI] [PMC free article] [PubMed] [Google Scholar]
- 6.Wang X; Grace PM; Pham MN; Cheng K; Strand KA; Smith C; Li J; Watkins LR; Yin H Rifampin inhibits Toll-like receptor 4 signaling by targeting myeloid differentiation protein 2 and attenuates neuropathic pain. FASEB J. 2013, 27, 2713–2722. [DOI] [PMC free article] [PubMed] [Google Scholar]
- 7.O’Neill LA; Bowie AG The family of five: TIR-domain-containing adaptors in Toll-like receptor signalling. Nat. Rev. Immunol 2007, 7, 353–364. [DOI] [PubMed] [Google Scholar]
- 8.Jerala R Structural biology of the LPS recognition. Int. J. Med. Microbiol 2007, 297, 353–363. [DOI] [PubMed] [Google Scholar]
- 9.Zhang TS; Peng YH; Wang XH Drug discovery for treating drug addiction by targeting glia. Prog. Pharm. Sci 2016, 39, 56–61. [Google Scholar]
- 10.Christ WJ; Asano O; Robidoux ALC; Perez M; Wang YA; Dubuc GR; Gavin WE; Hawkins LD; Mcguinness PD; Mullarkey MA; Lewis MD; Kishi Y; Kawata T; Bristol JR; Rose JR; Rossignol DP; Kobayashi S; Hishinuma L; Kimura A; Asakawa N; Katayama K; Yamatsu I E5531, a pure endotoxin antagonist of high potency. Science 1995, 268, 80–83. [DOI] [PubMed] [Google Scholar]
- 11.Poltorak A; He XL; Smirnova I; Liu MY; Van Huffel C; Du X; Birdwell D; Alejos E; Silva M; Galanos C; Freudenberg M; Ricciardi-Castagnoli P; Layton B; Beutler B Defective LPS signaling in C3H/HeJ and C57BL/10ScCr mice: Mutations in Tlr4 gene. Science 1998, 282, 2085–2088. [DOI] [PubMed] [Google Scholar]
- 12.Buchanan MM; Hutchinson M; Watkins LR; Yin H Toll-like receptor 4 in CNS pathologies. J. Neurochem 2010, 114, 13–27. [DOI] [PMC free article] [PubMed] [Google Scholar]
- 13.Taylor KR; Yamasaki K; Radek KA; Di Nardo A; Goodarzi H; Golenbock D; Beutler B; Gallo RL Recognition of hyaluronan released in sterile injury involves a unique receptor complex dependent on Toll-like receptor 4, CD44, and MD-2. J. Bio. Chem 2007, 282, 18265–18275. [DOI] [PubMed] [Google Scholar]
- 14.Watkins LR; Hutchinson MR; Rice KC; Maier SF The “toll” of opioid-induced glial activation: improving the clinical efficacy of opioids by targeting glia. Trends. Pharmacol. Sci 2009, 30, 581–591. [DOI] [PMC free article] [PubMed] [Google Scholar]
- 15.Lewis SS; Hutchinson MR; Rezvani N; Loram LC; Zhang Y; Maier SF; Rice KC; Watkins LR Evidence That Intrathecal Morphine-3-Glucuronide May Cause Pain Enhancement Via Toll-Like Receptor 4/Md-2 and Interleukin-1 Beta. Neuroscience 2010, 165, 569–583. [DOI] [PMC free article] [PubMed] [Google Scholar]
- 16.Wang X; Cochran TA; Hutchinson MR; Yin H; Watkins LR Drug Addiction In Microglia in Health and Disease, Tremblay M-È; Sierra A, Eds.; Springer New York: New York, NY, 2014, 299–317. [Google Scholar]
- 17.Park BS; Song DH; Kim HM; Choi BS; Lee H; Lee JO The structural basis of lipopolysaccharide recognition by the TLR4-MD-2 complex. Nature 2009, 458, 1191–1195. [DOI] [PubMed] [Google Scholar]
- 18.Roh E; Lee HS; Kwak JA; Hong JT; Nam SY; Jung SH; Lee JY; Kim ND; Han SB; Kim Y MD-2 as the target of nonlipid chalcone in the inhibition of endotoxin LPS-induced TLR4 activity. J. Infect. Dis 2011, 203, 1012–1020. [DOI] [PubMed] [Google Scholar]
- 19.Peri F; Piazza M Therapeutic targeting of innate immunity with Toll-like receptor 4 (TLR4) antagonists. Biotechnol. Adv 2012, 30, 251–260. [DOI] [PubMed] [Google Scholar]
- 20.Zhang XZ; Zhang TS; Cui FC; Li YQ; Peng YH; Wang XH Toll-like Receptor 4 Small Molecule Modulators. Chin. J. Appl. Chem 2016, 33, 876–886. [Google Scholar]
- 21.Kusumoto S; Fukase K; Fukase Y; Kataoka M; Yoshizaki H; Sato K; Oikawa M; Suda Y Structural basis for endotoxic and antagonistic activities: investigation with novel synthetic lipid A analogs. J. Endotoxin. Res 2003, 9, 361–366. [DOI] [PubMed] [Google Scholar]
- 22.Ohto U; Fukase K; Miyake K; Satow Y Crystal structures of human MD-2 and its complex with antiendotoxic lipid IVa. Science 2007, 316, 1632–1634. [DOI] [PubMed] [Google Scholar]
- 23.Muroi M; Tanamoto K Structural regions of MD-2 that determine the agonist-antagonist activity of lipid IVa. J. Bio. Chem 2006, 281, 5484–5491. [DOI] [PubMed] [Google Scholar]
- 24.Mancek-Keber M; Jerala R Structural similarity between the hydrophobic fluorescent probe and lipid A as a ligand of MD-2. FASEB J. 2006, 20, 1836–1842. [DOI] [PubMed] [Google Scholar]
- 25.Wang Z; Chen GZ; Chen LF; Liu X; Fu WT; Zhang YL; Li CL; Liang G; Cai YP Insights into the binding mode of curcumin to MD-2: studies from molecular docking, molecular dynamics simulations and experimental assessments. Mol. Biosyst 2015, 11, 1933–1938. [DOI] [PubMed] [Google Scholar]
- 26.Fu W; Chen L; Wang Z; Zhao C; Chen G; Liu X; Dai Y; Cai Y; Li C; Zhou J; Liang G Determination of the binding mode for anti-inflammatory natural product xanthohumol with myeloid differentiation protein 2. Drug. Des. Dev. Ther 2016, 10, 455–463. [DOI] [PMC free article] [PubMed] [Google Scholar]
- 27.Northcutt A; Hutchinson M; Wang X; Baratta M; Hiranita T; Cochran T; Pomrenze M; Galer E; Kopajtic T; Li C DAT isn’t all that: cocaine reward and reinforcement require Toll-like receptor 4 signaling. Mol. Psychiatr 2015, 20, 1525–1537. [DOI] [PMC free article] [PubMed] [Google Scholar]
- 28.Theberge FR; Li X; Kambhampati S; Pickens CL; St Laurent R; Bossert JM; Baumann MH; Hutchinson MR; Rice KC; Watkins LR; Shaham Y Effect of chronic delivery of the Toll-like receptor 4 antagonist (+)-naltrexone on incubation of heroin craving. Biol. Psychiatry 2013, 73, 729–737. [DOI] [PMC free article] [PubMed] [Google Scholar]
- 29.Wang X; Zhang Y; Peng Y; Hutchinson MR; Rice KC; Yin H; Watkins LR Pharmacological characterization of the opioid inactive isomers (+)-naltrexone and (+)-naloxone as antagonists of toll-like receptor 4. Br. J. Pharmacol 2016, 173, 856–869. [DOI] [PMC free article] [PubMed] [Google Scholar]
- 30.Bachtell R; Hutchinson MR; Wang X; Rice KC; Maier SF; Watkins LR Targeting the Toll of Drug Abuse: The Translational Potential of Toll-Like Receptor 4. Cns Neurol. Disord-Dr. 2015, 14, 692–699. [DOI] [PMC free article] [PubMed] [Google Scholar]
- 31.Ohto U; Fukase K; Miyake K; Shimizu T Structural basis of species-specific endotoxin sensing by innate immune receptor TLR4/MD-2. Proc. Natl. Acad. Sci. USA 2012, 109, 7421–7426. [DOI] [PMC free article] [PubMed] [Google Scholar]
- 32.Sastry GM; Adzhigirey M; Day T; Annabhimoju R; Sherman W Protein and ligand preparation: parameters, protocols, and influence on virtual screening enrichments. J. Comput. Aided Mol. Des 2013, 27, 221–234. [DOI] [PubMed] [Google Scholar]
- 33.Roy D; Todd K; John M GaussView, Version 5. Semichem Inc., Shawnee Mission, KS, 2009. [Google Scholar]
- 34.Becke AD Density-Functional Exchange-Energy Approximation with Correct Asymptotic-Behavior. Phys. Rev. A 1988, 38, 3098–3100. [DOI] [PubMed] [Google Scholar]
- 35.Lee CT; Yang WT; Parr RG Development of the Colle-Salvetti Correlation-Energy Formula into a Functional of the Electron-Density. Phys. Rev. B 1988, 37, 785–789. [DOI] [PubMed] [Google Scholar]
- 36.Miehlich B; Savin A; Stoll H; Preuss H Results Obtained with the Correlation-Energy Density Functionals of Becke and Lee, Yang and Parr. Chem. Phys. Lett 1989, 157, 200–206. [Google Scholar]
- 37.Sketch M, Calculation module developed by ChemAxon. https://chemicalize.com/ (2014).
- 38.Trott O; Olson AJ AutoDock Vina: improving the speed and accuracy of docking with a new scoring function, efficient optimization, and multithreading. J. Comput. Chem 2010, 31, 455–461. [DOI] [PMC free article] [PubMed] [Google Scholar]
- 39.Baxter J Local Optima Avoidance in Depot Location. J. Oper. Res. Soc 1981, 32, 815–819. [Google Scholar]
- 40.Blum C; Aguilera MJB; Roli A; Sampels M Hybrid Metaheuristics, An Emerging Approach to Optimization. Springer-Verlag: Berlin Heidelberg, 2008, 114, 290. [Google Scholar]
- 41.Phillips JC; Braun R; Wang W; Gumbart J; Tajkhorshid E; Villa E; Chipot C; Skeel RD; Kale L; Schulten K Scalable molecular dynamics with NAMD. J. Comput. Chem 2005, 26, 1781–1802. [DOI] [PMC free article] [PubMed] [Google Scholar]
- 42.Duan Y; Wu C; Chowdhury S; Lee MC; Xiong G; Zhang W; Yang R; Cieplak P; Luo R; Lee T; Caldwell J; Wang J; Kollman P A point-charge force field for molecular mechanics simulations of proteins based on condensed-phase quantum mechanical calculations. J. Comput. Chem 2003, 24, 1999–2012. [DOI] [PubMed] [Google Scholar]
- 43.Wang J; Wolf RM; Caldwell JW; Kollman PA; Case DA Development and testing of a general amber force field. J. Comput. Chem 2004, 25, 1157–1174. [DOI] [PubMed] [Google Scholar]
- 44.Dupradeau FY; Pigache A; Zaffran T; Savineau C; Lelong R; Grivel N; Lelong D; Rosanski W; Cieplak P The R.E.D. tools: advances in RESP and ESP charge derivation and force field library building. Phys. Chem. Chem. Phys 2010, 12, 7821–7839. [DOI] [PMC free article] [PubMed] [Google Scholar]
- 45.Ryckaert JP; Ciccotti G; Berendsen HJC Numerical-Integration of Cartesian Equations of Motion of a System with Constraints Molecular Dynamics of N-Alkanes. J. Comput. Phys 1977, 23, 327–341. [Google Scholar]
- 46.Darden T; York D; Pedersen L Particle mesh Ewald: An N·log(N) method for Ewald sums in large systems. J. Chem. Phys 1993, 98, 10089–10092. [Google Scholar]
- 47.Feller SE; Zhang YH; Pastor RW; Brooks BR Constant-Pressure Molecular-Dynamics Simulation - the Langevin Piston Method. J. Chem. Phys 1995, 103, 4613–4621. [Google Scholar]
- 48.Massova I; Kollman PA Combined molecular mechanical and continuum solvent approach (MM-PBSA/GBSA) to predict ligand binding. Perspect. Drug Discov. 2000, 18, 113–135. [Google Scholar]
- 49.Sun HY; Li YY; Tian S; Xu L; Hou TJ Assessing the performance of MM/PBSA and MM/GBSA methods. 4. Accuracies of MM/PBSA and MM/GBSA methodologies evaluated by various simulation protocols using PDBbind data set. Phys. Chem. Chem. Phys 2014, 16, 16719–16729. [DOI] [PubMed] [Google Scholar]
- 50.Genheden S; Ryde U The MM/PBSA and MM/GBSA methods to estimate ligand-binding affinities. Expert Opin. Drug. Dis 2015, 10, 449–461. [DOI] [PMC free article] [PubMed] [Google Scholar]
- 51.Spackova N; Cheatham TE 3rd; Ryjacek F; Lankas F; Van Meervelt L; Hobza P; Sponer J Molecular dynamics simulations and thermodynamics analysis of DNA-drug complexes. Minor groove binding between 4’,6-diamidino-2-phenylindole and DNA duplexes in solution. J. Am. Chem. Soc 2003, 125, 1759–1769. [DOI] [PubMed] [Google Scholar]
- 52.Grant BJ; Rodrigues AP; ElSawy KM; McCammon JA; Caves LS Bio3d: an R package for the comparative analysis of protein structures. Bioinformatics 2006, 22, 2695–2696. [DOI] [PubMed] [Google Scholar]
- 53.Frauenfelder H; Sligar SG; Wolynes PG The energy landscapes and motions of proteins. Science 1991, 254, 1598–1603. [DOI] [PubMed] [Google Scholar]
- 54.Lakowicz JR Principle of Fluorescence Spectroscopy,. Springer-Verlag, New York: 2006. [Google Scholar]
- 55.Selfridge BR; Wang X; Zhang Y; Yin H; Grace PM; Watkins LR; Jacobson AE; Rice KC Structure–Activity Relationships of (+)-Naltrexone-Inspired Toll-like Receptor 4 (TLR4) Antagonists. J. Med. Chem 2015, 58, 5038–5052. [DOI] [PMC free article] [PubMed] [Google Scholar]
- 56.Dundas J; Ouyang Z; Tseng J; Binkowski A; Turpaz Y; Liang J CASTp: computed atlas of surface topography of proteins with structural and topographical mapping of functionally annotated residues. Nucleic. Acids. Res 2006, 34, W116–118. [DOI] [PMC free article] [PubMed] [Google Scholar]
- 57.Paramo T; Piggot TJ; Bryant CE; Bond PJ The Structural Basis for Endotoxin-induced Allosteric Regulation of the Toll-like Receptor 4 (TLR4) Innate Immune Receptor. J. Bio. Chem 2013, 288, 36215–36225. [DOI] [PMC free article] [PubMed] [Google Scholar]
- 58.Gradisar H; Keber MM; Pristovsek P; Jerala R MD-2 as the target of curcumin in the inhibition of response to LPS. J. Leukocyte Biol 2007, 82, 968–974. [DOI] [PubMed] [Google Scholar]
- 59.Resman N; Gradisar H; Vasl J; Keber MM; Pristovsek P; Jerala R Taxanes inhibit human TLR4 signaling by binding to MD-2. FEBS Lett. 2008, 582, 3929–3934. [DOI] [PubMed] [Google Scholar]
- 60.Paramo T; Tomasio SM; Irvine KL; Bryant CE; Bond PJ Energetics of Endotoxin Recognition in the Toll-Like Receptor 4 Innate Immune Response. Sci. Rep 2015, 5, 17997. [DOI] [PMC free article] [PubMed] [Google Scholar]
- 61.Maisuradze GG; Liwo A; Scheraga HA Relation between Free Energy Landscapes of Proteins and Dynamics. J. Chem. Theory. Comput 2010, 6, 583–595. [DOI] [PMC free article] [PubMed] [Google Scholar]
- 62.Garate JA; Oostenbrink C Lipid A from lipopolysaccharide recognition: structure, dynamics and cooperativity by molecular dynamics simulations. Proteins 2013, 81, 658–674. [DOI] [PubMed] [Google Scholar]
Associated Data
This section collects any data citations, data availability statements, or supplementary materials included in this article.


