

Abstract
Delay discounting describes the process wherein rewards lose value as a function of their delayed receipt; how quickly rewards lose value is termed the rate of delay discounting. Rates of delay discounting are robust predictors of much behavior of societal importance. One efficient approach to obtaining a human subject’s rate of delay discounting is via the 21- and 27-item Monetary Choice Questionnaires, brief dichotomous choice tasks that assess preference between small immediate and larger delayed monetary outcomes. Unfortunately, the scoring procedures for the Monetary Choice Questionnaires are rather complex, which may serve as a barrier to their use. This report details a freely available Excel-based spreadsheet tool that automatically scores Monetary Choice Questionnaire response sets, using both traditional and contemporary/advanced approaches. An overview of the Monetary Choice Questionnaire and its scoring algorithm is provided. We conclude with general considerations for using the spreadsheet tool.
Keywords: Delay discounting, Impulsivity, Microsoft Excel, Monetary Choice Questionnaire, Software, Technology
Delay discounting is a behavioral phenomenon wherein reinforcers become devalued as a function of their delay to receipt (see Madden & Bickel, 2010). Laboratory research suggests that both humans and non-humans typically discount rewards according to a hyperbolic or hyperbolic-like function (Green & Myerson, 2004; Mazur, 1987; Rachlin, 2006). Central to delay discounting analyses is the derivation of a subject’s individual rate of discounting. This rate of discounting (k) is the slope of the hyperbolic or hyperbolic-like function through the subject’s subjective value of delayed rewards. Thus, larger k values represent relatively steep discounting wherein small amounts of delay substantially affect reward value. The elegance of the k value is that it serves as parsimonious shorthand in describing a higher order relation between a reinforcer dimension and its effect on behavior. As stated by Critchfield and Reed (2009, p. 343), “it is difficult in words to say exactly how fast value decreases as a function of delay” when describing subjects’ performance across repeated delay amounts; summarizing this relation in one term—k—is thereby both a precise and efficient means of describing the discounting phenomenon. Moreover, we emphasize to behavior-analytic readers that k is not a hypothetical construct; behaviorally speaking, k simply describes a temporally extended pattern of behavior (Odum, 2011).
Translational and clinical research suggests that delay discounting may be a trans-disease behavioral process underpinning many issues of societal importance (see Bickel, Jarmolowicz, Mueller, Koffarnus, & Gatchalian, 2012; Critchfield & Kollins, 2001). Accordingly, k is a robust predictor of many socially important behaviors, including but not limited to substance use disorders (see Bickel, Koffarnus, Moody, & Wilson, 2014; MacKillop, Amlung, Pryor, Ray, & Munafo, 2010; MacKillop et al., 2011), obesity (see Amlung, Petker, Jackson, Balodis, & MacKillop, 2016; Epstein, Salvy, Carr, Dearing, & Bickel, 2010; Rasmussen, Lawyer, & Reilly, 2010), judgments of environmental concerns (e.g., Kaplan, Reed, & McKerchar, 2014b), sexual risks and promiscuity (e.g., Jarmolowicz et al., 2014; Jarmolowicz, Lemley, Asmussen, & Reed, 2015; Johnson, Johnson, Herrmann, & Sweeney, 2015), and technology dependence (e.g., Ferraro & Weatherly, 2016; Reed, Becirevic, Atchley, Kaplan, & Liese, 2016).
Both laboratory and clinical research indicate that delay discounting of hypothetical rewards in humans correlates well with delay discounting of actual rewards in operant arrangements (e.g., Johnson & Bickel, 2002; Lagorio & Madden, 2005; Madden, Begotka, Raiff, & Kastern, 2003; Madden et al., 2004). Because hypothetical delay discounting appears to be a valid form of intertemporal choice (see Odum, 2011), researchers interested in issues of societal concern can save substantial time and money by using hypothetical tasks to derive subjects’ rates of discounting. While many different forms of delay-discounting tasks exist, possibly the most extensively validated task to date is the Monetary Choice Questionnaire (MCQ, Kirby & Marakovic, 1996; Kirby, Petry, & Bickel, 1999). Indeed, the psychometrics and apparent clinical/research utility (Duckworth & Seligman, 2005; Kirby, 2009; Kirby & Finch, 2010; Kirby & Petry, 2004; Kirby et al., 1999) has rendered the MCQ one of the most commonly used discounting scales (MacKillop et al., 2011).
Both the 21- (Kirby & Marakovic, 1996) and 27-item MCQs (Kirby et al., 1999) contain a series of dichotomous choice items pitting a smaller-immediate reward (SIR) against a larger delayed reward (LDR) for three levels of reward size (i.e., small, medium, large). For simplicity of instruction, the remainder of this report will only discuss the 27-item MCQ; note, however, that the logic of scoring methods for the two MCQ versions are identical.
The purpose of the present report is to introduce delay discounting researchers and behavioral economists1 to a freely available Excel-based MCQ spreadsheet tool (Kaplan, Lemley, Reed, & Jarmolowicz, 2014a) that computes standard (hyperbolic-based k), transformed (log and natural log transformed hyperbolic-based k), and supplementary measures (% and proportion LDR choices and summary statistics [mean, standard deviation, standard error of the mean]) for overall discounting on the MCQ, as well as for each magnitude (i.e., small, medium, large). The tool also returns Pearson product-moment correlation coefficients between magnitudes, which assesses the degree of correspondence in discounting across amounts. The tool permits up to 1000 datasets to be analyzed at once. It is available for download via an online curated digital repository at https://kuscholarworks.ku.edu/handle/1808/15424,2 or by scanning the QR code in Fig. 1. The remainder of this report details the logic behind the MCQ scoring in the spreadsheet tool. We begin by first describing the intricacies of MCQ scoring for researchers unfamiliar with the nuances of this approach.
Fig. 1.

Scannable QR code to access the 21- and 27-item MCQ Automated Scorers (Kaplan et al., 2014; URL: https://kuscholarworks.ku.edu/handle/1808/15424)
Delay Discounting Rates from the MCQ
For each of the 27 items in the spreadsheet tool, respondent selections are entered into the spreadsheet; “0” values indicate selection of the SIR (e.g., “$11 today”) and “1” values indicate selection of the LDR (e.g., “$30 7 days from now”). Starting in column C of the spreadsheet tool, within-respondent selections are entered vertically in the order in which items are displayed in the questionnaire, with optional participant IDs entered in row 3 (see Fig. 2 for an example).
Fig. 2.
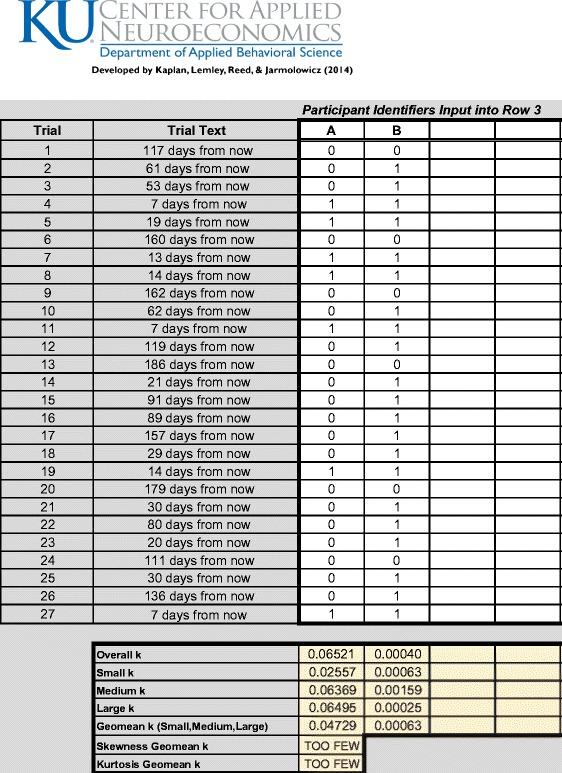
Example screenshot illustrating data from two hypothetical respondents. Note, 0s indicate selection of the SIR and 1s indicate selection of the LDR
The 27 items are comprised of three groupings of nine items each, with each group constituting a different magnitude (i.e., small, medium, and large). The small magnitude items correspond with LDR amounts of $25, $30, and $35. The medium magnitude items correspond with LDR amounts of $50, $55, and $60. Finally, the large magnitude items correspond with LDR amounts of $75, $80, and $85.
The hyperbolic discounting equation (Mazur, 1987) can be rearranged so that k is on the left side of the equation:
| 1 |
| 2 |
| 3 |
| 4 |
| 5 |
where V is the smaller, immediate amount; A is the larger, delayed amount; and D is the delay associated with A. Thus, a k value is derived at each of the 27 items. For example, the k value associated with item 11 of the 27-item version (i.e., $11 today or $30 in 7 days) is 0.246753:
| 6 |
Note that in typical discounting assessments, this k value would be representative of a respondent who is indifferent between the two amounts (i.e., $11 today and $30 in 7 days). However, as discussed in the following section, the researcher cannot be certain that an individual is truly indifferent between the two amounts because respondents are specifically instructed to choose the option they most prefer. Therefore, a k value is approximated based on the respondent’s general pattern of responding (Kirby et al., 1999).
Deriving Overall, Small, Medium, and Large k
In this section, we describe the method of estimating the overall k value based on the entire 27-item response pattern, which provides the logic behind the scoring in the spreadsheet tool. The same method is used to estimate k values at each of the small, medium, and large magnitude sizes. First, the 27 items are ordered based on their associated k values, starting with the smallest k values (Table 1). When ordered in such a way, a respondent with many 0s (i.e., many selections of the SIR) and few 1s (i.e., few selections of the LDR) would be indicative of relatively steep delay discounting (i.e., the value of the reward decreases rapidly with increases in delay; Table 1, respondent A). Conversely, a respondent with relatively few 0s and many 1s would be indicative of shallow delay discounting (i.e., the value of the reward decreases slowly with increases in delay; Table 1, respondent B).
Table 1.
Twenty-seven items ordered by k value
| Item # | Magnitude | k value | Respondent A | Respondent B |
|---|---|---|---|---|
| Relatively steep discounting | Relatively shallow discounting | |||
| 13 | Small | 0.000158128 | 0 | 0 |
| 1 | Medium | 0.000158278 | 0 | 0 |
| 9 | Large | 0.000158278 | 0 | 0 |
| 20 | Small | 0.000399042 | 0 | 0 |
| 6 | Medium | 0.000398936 | 0 | 0 |
| 17 | Large | 0.000398089 | 0 | 1 |
| 26 | Small | 0.001002674 | 0 | 1 |
| 24 | Medium | 0.001001001 | 0 | 0 |
| 12 | Large | 0.001003386 | 0 | 1 |
| 22 | Small | 0.002500000 | 0 | 1 |
| 16 | Medium | 0.002522357 | 0 | 1 |
| 15 | Large | 0.002548176 | 0 | 1 |
| 3 | Small | 0.005958292 | 0 | 1 |
| 10 | Medium | 0.006048387 | 0 | 1 |
| 2 | Large | 0.005961252 | 0 | 1 |
| 18 | Small | 0.015804598 | 0 | 1 |
| 21 | Medium | 0.015686275 | 0 | 1 |
| 25 | Large | 0.016049383 | 0 | 1 |
| 5 | Small | 0.041353383 | 1 | 1 |
| 14 | Medium | 0.040564374 | 0 | 1 |
| 23 | Large | 0.041463415 | 0 | 1 |
| 7 | Small | 0.102564103 | 1 | 1 |
| 8 | Medium | 0.100000000 | 1 | 1 |
| 19 | Large | 0.101731602 | 1 | 1 |
| 11 | Small | 0.246753247 | 1 | 1 |
| 27 | Medium | 0.250000000 | 1 | 1 |
| 4 | Large | 0.248847926 | 1 | 1 |
Questions on the 27-item MCQ sorted by k value. Respondent A reflects relatively steep discounting (higher k). Respondent B illustrates relatively shallow discounting (lower k). Note, 0s represent selection of the SIR and 1s represent selection of the LDR
At each item, the respondent chooses either the SIR or LDR; from each item, inferences regarding the respondent’s k value are made. For example, based on the construction of the MCQ, the k value associated with item 11 is 0.246753 (see Eq. 6 above). If a respondent selects the SIR amount (i.e., $11 today), then it bears to reason that the respondent’s k value should be equal to or greater than 0.246753, the value that assumes indifference between $11 today and $30 in 7 days. Alternatively, if a respondent selects the larger, delayed amount (i.e., $30 in 7 days), that respondent’s k value is presumably equal to or less than 0.246753.
For each item, the degree to which the respondents’ selections are consistent with response patterns preceding, as well as following, the switch(es) from SIR choices to LDR choices is calculated. A consistency score is determined by counting the instances of 0s (i.e., selection of the SIR) prior to the given k value and instances of 1s (i.e., selection of the LDR) at and following the given k value. This number is then divided by the number of items possible (27 in the case of overall; 9 in the case of each of the three magnitudes). The larger the number, the more consistent the response pattern. In Table 1, for respondent A, the highest consistency would fall at question 7, and for respondent B, the highest consistency would fall at question 17.
Once a consistency score is calculated at each k value, the k value with the highest consistency score is identified. If the highest consistency score occurs only once, then the geometric mean between that k value and the k value immediately preceding it is returned to estimate that value as the respondent’s k value. The geometric mean is used, rather than the single observed k value itself, because it is not possible to obtain the respondent’s “true3” indifference point using the MCQ and thereby impute the “true” k value. The best estimate is that the “true” indifference point lies somewhere between where the respondent’s choice crosses over from preferring the SIR to LDR and is associated with the question yielding the highest consistency. In cases where the highest consistency score occurs more than once, the geometric mean of k values at each of the items associated with those consistency scores determines the final k value (similar to the process described above). We recommend the researcher to closely examine individual-level patterns of responding in cases where consistency scores are less than 75 % (Kris Kirby, July 22, 2014; personal communication), as this may be an indication of a lack of attending to the questionnaire. In the MCQ tool, instances where consistency scores are less than 75 % are shaded in red, but are nevertheless retained in all summary statistics. For additional information on scoring in general, see Kirby et al. (1999; pp. 80–81) and Kirby (2000, 2009).
Overall, small, medium, and large k values are determined using the method outlined above. “Geomean k” (or composite k; termed “geomean” in the tool to remain consistent with Excel function nomenclature), is determined by taking the geometric mean of the resulting small, medium, and large k values. When reporting k values in manuscript articles, we encourage authors to specify whether the values reported are calculated using the overall or geomean (i.e., composite) methods.4
Because the distribution of raw k values tends to be skewed (e.g., Landes, Pitcock, Yi, & Bickel, 2010; Mitchell, Wilson, & Karalunas, 2015), logarithmic transformations have been used to approximate a normal (Gaussian) distribution for use with parametric statistical analyses. Note, square-root transformations can also be used in cases where logarithmic transformations maintain substantial skew and/or kurtosis. In addition, the researcher may be interested in Effective Delay 50 (ED50; Yoon & Higgins, 2008). This measure reflects the delay at which the larger, delayed amount loses half its value. For purposes of the MCQ, ED50 = 1/k and log(ED50) = −log(k); such ED50 analyses can be conducted fairly easily outside the spreadsheet tool. For more information, see Franck, Koffarnus, House, and Bickel (2015).
Summary Statistics
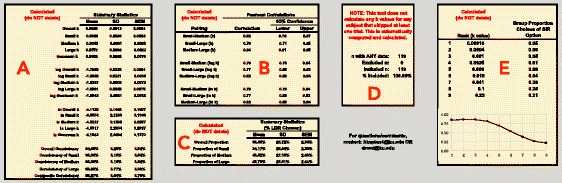
Figure 3 displays the summary statistics generated from the spreadsheet tool. Figure 3a displays the mean, standard deviation, and standard error of the mean for untransformed and transformed values of k, as well as measures of consistency. Figure 3b displays Pearson product-moment correlation coefficients and associated 95 % confidence intervals between the transformed and untransformed k values within each reward magnitude. Figure 3c displays the mean, standard deviation, and standard error of the mean for the proportion of LDR choices calculated at the individual level. Myerson, Baumann, and Green (2014) suggest that the proportion of LDR choices may be taken as an alternative scoring method that corresponds closely to logarithmically transformed k values while retaining the reliability and validity of the more complicated scoring procedure. The reader is encouraged to consult Myerson et al. (2014) for more details. Figure 3d displays the number of respondents with any data, as well as the number of respondents included/excluded based on incomplete data; the tool will only calculate k values for complete datasets. Finally, Fig. 3e displays the proportion of smaller, immediate choices at each possible k value calculated at the group level, a measure that has been used previously (e.g., Bickel et al., 2014).
Fig. 3.
Screenshot of summary statistics in the 27-item MCQ Automated Scorer. See text for details
Validity Check on the Automated Scoring Tool
During tool development, we compared the k values rendered by the MCQ tool to those of hand-scored datasets in our laboratories. In the second phase of validity check, we compared the results from 933 hand-scored datasets (i.e., 933 participants; datasets were scored per the scoring method described in Kirby et al., 1999) to the results from the same datasets scored using the MCQ tool. These datasets were from a published study on delay discounting and nicotine dependence (Amlung & MacKillop, 2014). Our comparisons found that results between the approaches were identical up to three decimal places. Subsequently, the tool was refined to ensure accuracy up to 10 decimal places. Finally, results from the MCQ tool identically matched those in a tutorial on MCQ scoring available from its creator, Kris Kirby (2000).
Limitations and Considerations
Although the tool provides many advantages over manually scoring responses on the MCQ (e.g., time and resource efficient, automatic calculation of additional metrics), it is not without its limitations. Currently, the tool is configured for the standard monetary reward version. Recently, alternative dichotomous choice discounting questionnaires based on the monetary reward version of the MCQ have been developed (e.g., Amlung & MacKillop, 2014; MacKillop et al., 2012). We recommend against using the tool for calculating discounting metrics based on these alternative questionnaires as scoring procedures may not be the same. An exception may be taken for those questionnaires that equate non-monetary reward amounts with monetary equivalents out of $100 (e.g., if a respondent indicated 100 pizza slices is worth $100, then item 11 would be mathematically equivalent to 11 pizza slices now or 30 pizza slices in 7 days). Note, however, that non-monetary equivalents to amounts used in monetary discounting may not be discounted similarly (Killeen, 2009, 2015).
As noted earlier, the tool requires the data to be in a specific format. Such specificity includes individual’s responses entered in column-major format—0 and 1s for selections of the SIR and the LDR, respectively—and responses entered in the order of questions presented on the MCQ. In order for the data to be properly analyzed by the tool, the researcher may be required to transpose their data (e.g., from row-major to column-major format), to use the “find and replace” function to specify 0 and 1s as the responses, or to sort the responses in the order in which questions are presented on the MCQ. In addition, the tool is limited in its ability to score up to 1000 datasets at once. In situations where more than 1000 respondents’ data need to be scored, we recommend obtaining individual indices using the tool (1000 respondents at a time) and then calculating group statistics separately.
Finally, there are a number of different analytic techniques (e.g., imputation, partial deletion, interpolation) to deal with various classes of missing data (e.g., missing completely at random, missing at random, missing not at random). Given these considerations, the tool is designed under the assumption that when data are missing, they are missing at random. Thus, the tool only calculates metrics based on complete response sets (i.e., listwise deletion). Although this method reduces statistical power, it is typically less problematic than other methods for dealing with missing data (Allison, 2001). The researcher should strive to minimize instances of missing data either at the time of data collection or when data are manually entered into the spreadsheet tool.
Conclusions
The MCQ has emerged as a core paradigm in survey and experimental research on delay discounting in healthy and clinical populations (Bickel et al., 2012). Despite its ease of administration, methods for scoring the MCQ are often complex and may limit wider application of the measure (Myerson et al., 2014). In this paper, we have introduced a freely available, automated tool for processing individual subject responses on the MCQ. A primary strength of the tool is that it provides a variety of discounting indices, including k values, proportion of immediate reward choices, and others. The tool also provides the user with diagnostic information such as response consistency and identification of missing data to aid with evaluating the quality of MCQ responses. While the limitations outlined above deserve careful consideration when implementing this tool across research and applied contexts, the MCQ Automated Scorer provides an efficient and comprehensive approach to translating raw delay discounting data on the MCQ into summary indices of discounting rate and immediate reward preference.
Compliance with Ethical Standards
Funding
This work was not funded.
Conflict of Interest
The authors declare that they have no conflict of interest.
Ethical Approval
This article does not contain any studies with human participants performed by any of the authors.
Footnotes
Accordingly, this report is written for researchers familiar with delay discounting assessments. An introduction to delay discounting and its various assessments is beyond the scope of this report. Readers from other domains interested in learning more about delay discounting are encouraged to consult Madden & Bickel, 2010.
Accordingly, KU ScholarWorks provides static URLs; thus, the URL provided in this report will indefinitely serve as the source page for the tool.
By “true,” we mean an indifference point we would expect to obtain using a fine-grained titration procedure.
We know of no empirical work comparing inferences made from the geomean and overall k values; because different discounting researchers prefer one over the other, we offer both approaches to aggregate summaries of k to accommodate researchers’ personal preferences.
Readers are encouraged to download the MCQ scoring tool via https://kuscholarworks.ku.edu/handle/1808/15424.
References
- Allison PD. Missing data. Thousand Oaks, CA: Sage; 2001. [Google Scholar]
- Amlung M, MacKillop J. Clarifying the relationship between impulsive delay discounting and nicotine dependence. Psychology of Addictive Behaviors. 2014;28(3):761–768. doi: 10.1037/a0036726. [DOI] [PMC free article] [PubMed] [Google Scholar]
- Amlung M, Petker T, Jackson J, Balodis I, MacKillop J. Steep discounting of delayed monetary and food rewards in obesity: a meta analysis. Psychological Medicine. 2016 doi: 10.1017/S0033291716000866. [DOI] [PubMed] [Google Scholar]
- Bickel WK, Jarmolowicz DP, Mueller ET, Koffarnus MN, Gatchalian KM. Excessive discounting of delayed reinforcers as a trans-disease process contributing to addiction and other disease-related vulnerabilities: emerging evidence. Pharmacology and Therapeutics. 2012;134(3):287–297. doi: 10.1016/j.pharmthera.2012.02.004. [DOI] [PMC free article] [PubMed] [Google Scholar]
- Bickel WK, Koffarnus MN, Moody L, Wilson AG. The behavioral- and neuro-economic process of temporal discounting: a candidate behavioral marker of addiction. Neuropharmacology. 2014;76(Pt B):518–527. doi: 10.1016/j.neuropharm.2013.06.013. [DOI] [PMC free article] [PubMed] [Google Scholar]
- Critchfield TS, Kollins SH. Temporal discounting: basic research and the analysis of socially important behavior. Journal of Applied Behavior Analysis. 2001;34(1):101–122. doi: 10.1901/jaba.2001.34-101. [DOI] [PMC free article] [PubMed] [Google Scholar]
- Critchfield TS, Reed DD. What are we doing when we translate from quantitative models? The Behavior Analyst. 2009;32(2):339–362. doi: 10.1007/BF03392197. [DOI] [PMC free article] [PubMed] [Google Scholar]
- Duckworth AL, Seligman ME. Self-discipline outdoes IQ in predicting academic performance of adolescents. Psychological Science. 2005;16(12):939–944. doi: 10.1111/j.1467-9280.2005.01641.x. [DOI] [PubMed] [Google Scholar]
- Epstein LH, Salvy SJ, Carr KA, Dearing KK, Bickel WK. Food reinforcement, delay discounting and obesity. Physiology and Behavior. 2010;100(5):438–445. doi: 10.1016/j.physbeh.2010.04.029. [DOI] [PMC free article] [PubMed] [Google Scholar]
- Ferraro FR, Weatherly JN. Texting dependence, ipod dependence, and delay discounting. The American Journal of Psychology. 2016;129(2):161–168. doi: 10.5406/amerjpsyc.129.2.0161. [DOI] [PubMed] [Google Scholar]
- Franck CT, Koffarnus MN, House LL, Bickel WK. Accurate characterization of delay discounting: a multiple model approach using approximate Bayesian model selection and a unified discounting measure. Journal of the Experimental Analysis of Behavior. 2015;103(1):218–233. doi: 10.1002/jeab.128. [DOI] [PMC free article] [PubMed] [Google Scholar]
- Green L, Myerson J. A discounting framework for choice with delayed and probabilistic rewards. Psychological Bulletin. 2004;130(5):769–792. doi: 10.1037/0033-2909.130.5.769. [DOI] [PMC free article] [PubMed] [Google Scholar]
- Jarmolowicz DP, Landes RD, Christensen DR, Jones BA, Jackson L, Yi R, et al. Discounting of money and sex: effects of commodity and temporal position in stimulant-dependent men and women. Addictive Behaviors. 2014;39(11):1652–1657. doi: 10.1016/j.addbeh.2014.04.026. [DOI] [PMC free article] [PubMed] [Google Scholar]
- Jarmolowicz DP, Lemley SM, Asmussen L, Reed DD. Mr. right versus Mr. right now: a discounting-based approach to promiscuity. Behavioural Processes. 2015;115:117–122. doi: 10.1016/j.beproc.2015.03.005. [DOI] [PubMed] [Google Scholar]
- Johnson MW, Bickel WK. Within-subject comparison of real and hypothetical money rewards in delay discounting. Journal of the Experimental Analysis of Behavior. 2002;77(2):129–146. doi: 10.1901/jeab.2002.77-129. [DOI] [PMC free article] [PubMed] [Google Scholar]
- Johnson MW, Johnson PS, Herrmann ES, Sweeney MM. Delay and probability discounting of sexual and monetary outcomes in individuals with cocaine use disorders and matched controls. PLoS One. 2015;10(5):e0128641. doi: 10.1371/journal.pone.0128641. [DOI] [PMC free article] [PubMed] [Google Scholar]
- Kaplan, B. A., Lemley, S. M., Reed, D. D., & Jarmolowicz, D. P. (2014a). 21- and 27-item monetary choice questionnaire automated scorers [software]. Lawrence, KS: Center for Applied Neuroeconomics, University of Kansas. Available from http://hdl.handle.net/1808/15424. Accessed 20 July 2016.
- Kaplan BA, Reed DD, McKerchar TL. Using a visual analogue scale to assess delay, social, and probability discounting of an environmental loss. Psychological Record. 2014;64(2):261–269. doi: 10.1007/s40732-014-0041-z. [DOI] [Google Scholar]
- Killeen PR. An additive-utility model of delay discounting. Psychological Review. 2009;116(3):602–619. doi: 10.1037/a0016414. [DOI] [PubMed] [Google Scholar]
- Killeen PR. The arithmetic of discounting. Journal of the Experimental Analysis of Behavior. 2015;103(1):249–259. doi: 10.1002/jeab.130. [DOI] [PubMed] [Google Scholar]
- Kirby, K. (2000). Instructions for inferring discount rates from choices between immediate and delayed rewards. Unpublished manuscript, Williams College.
- Kirby KN. One-year temporal stability of delay-discount rates. Psychonomic Bulletin & Review. 2009;16(3):457–462. doi: 10.3758/PBR.16.3.457. [DOI] [PubMed] [Google Scholar]
- Kirby, K. N., & Finch, J. C. (2010). The hierarchical structure of self-reported impulsivity. Personality and Individual Differences, 48(6), 704–713. doi:10.1016/j.paid.2010.01.019. [DOI] [PMC free article] [PubMed]
- Kirby KN, Marakovic NN. Delay-discounting probabilistic rewards: rates decrease as amounts increase. Psychonomic Bulletin & Review. 1996;3(1):100–104. doi: 10.3758/BF03210748. [DOI] [PubMed] [Google Scholar]
- Kirby, K. N., & Petry, N. M. (2004). Heroin and cocaine abusers have higher discount rates for delayed rewards than alcoholics or non‐drug‐using controls. Addiction, 99(4), 461–471. doi:10.1111/j.1360-0443.2003.00669.x. [DOI] [PubMed]
- Kirby KN, Petry NM, Bickel WK. Heroin addicts have higher discount rates for delayed rewards than non-drug-using controls. Journal of Experimental Psychology: General. 1999;128(1):78–87. doi: 10.1037/0096-3445.128.1.78. [DOI] [PubMed] [Google Scholar]
- Lagorio, C. H., & Madden, G. J. (2005). Delay discounting of real and hypothetical rewards III: Steady-state assessments, forced-choice trials, and all real rewards. Behavioural Processes, 69(2), 173–187. doi:10.1016/j.beproc.2005.02.003. [DOI] [PubMed]
- Landes RD, Pitcock JA, Yi R, Bickel WK. Analytical methods to detect within-individual changes in discounting. Experimental and Clinical Psychopharmacology. 2010;18(2):175–183. doi: 10.1037/a0018901. [DOI] [PMC free article] [PubMed] [Google Scholar]
- MacKillop J, Amlung MT, Few LR, Ray LA, Sweet LH, Munafo MR. Delayed reward discounting and addictive behavior: a meta-analysis. Psychopharmacology. 2011;216(3):305–321. doi: 10.1007/s00213-011-2229-0. [DOI] [PMC free article] [PubMed] [Google Scholar]
- MacKillop J, Amlung M, Pryor L, Ray LA, Munafo M. Understanding impulsivity and alcohol misuse via delayed reward discounting. Alcoholism-Clinical and Experimental Research. 2010;34(8):18a. [Google Scholar]
- MacKillop J, Amlung MT, Wier LM, David SP, Ray LA, Bickel WK, et al. The neuroeconomics of nicotine dependence: a preliminary functional magnetic resonance imaging study of delay discounting of monetary and cigarette rewards in smokers. Psychiatry Research: Neuroimaging. 2012;202(1):20–29. doi: 10.1016/j.pscychresns.2011.10.003. [DOI] [PMC free article] [PubMed] [Google Scholar]
- Madden GJ, Bickel WK. Impulsivity: the behavioral and neurological science of discounting. 1. Washington, DC: American Psychological Association; 2010. [Google Scholar]
- Madden, G. J., Begotka, A. M., Raiff, B. R., & Kastern, L. L. (2003). Delay discounting of real and hypothetical rewards. Experimental and Clinical Psychopharmacology, 11(2), 139–145. doi:10.1037/1064-1297.11.2.139. [DOI] [PubMed]
- Madden, G. J., Raiff, B. R., Lagorio, C. H., Begotka, A. M., Mueller, A. M., Hehli, D. J., & Wegener, A. A. (2004). Delay discounting of potentially real and hypothetical rewards: II. Between- and within-subject comparisons. Experimental and Clinical Psychopharmacology, 12(4), 251–261. doi:10.1037/1064-1297.12.4.251. [DOI] [PubMed]
- Mazur JE. An adjusting procedure for studying delayed reinforcement. In: Commons ML, Mazur JE, Nevin JA, editors. Quantitative analyses of behavior: vol. 5. The effect of delay and of intervening events on reinforcement value. Hillsdale, NJ: Erlbaum; 1987. pp. 55–73. [Google Scholar]
- Mitchell SH, Wilson VB, Karalunas SL. Comparing hyperbolic, delay-amount sensitivity and present-bias models of delay discounting. Behavioural Processes. 2015;114:52–62. doi: 10.1016/j.beproc.2015.03.006. [DOI] [PMC free article] [PubMed] [Google Scholar]
- Myerson J, Baumann AA, Green L. Discounting of delayed rewards: (A)theoretical interpretation of the Kirby questionnaire. Behavioural Processes. 2014;107:99–105. doi: 10.1016/j.beproc.2014.07.021. [DOI] [PMC free article] [PubMed] [Google Scholar]
- Odum AL. Delay discounting: i’m a k, you’re a k. Journal of the Experimental Analysis of Behavior. 2011;96(3):427–439. doi: 10.1901/jeab.2011.96-423. [DOI] [PMC free article] [PubMed] [Google Scholar]
- Rachlin H. Notes on discounting. Journal of the Experimental Analysis of Behavior. 2006;85(3):425–435. doi: 10.1901/jeab.2006.85-05. [DOI] [PMC free article] [PubMed] [Google Scholar]
- Rasmussen EB, Lawyer SR, Reilly W. Percent body fat is related to delay and probability discounting for food in humans. Behavioural Processes. 2010;83(1):23–30. doi: 10.1016/j.beproc.2009.09.001. [DOI] [PubMed] [Google Scholar]
- Reed DD, Becirevic A, Atchley P, Kaplan BA, Liese BS. Validation of a novel delay discounting of text messaging questionnaire. The Psychological Record. Advance online publication. 2016 [Google Scholar]
- Yoon JH, Higgins ST. Turning k on its head: comments on use of an ED50 in delay discounting research. Drug and Alcohol Dependence. 2008;95(1):169–172. doi: 10.1016/j.drugalcdep.2007.12.011. [DOI] [PMC free article] [PubMed] [Google Scholar]