Abstract
Background
Gastric cancer (GC) is a major leading cause of cancer mortality worldwide. Polyadenylate (poly(A))-binding protein (PABP)-interacting protein 1 (Paip1) is a key regulator in the initiation of translation; however, its role in GC remains to be investigated.
Purpose
The purpose of this study is to determine Paip1 expression levels and investigate its underlying molecular mechanism in GC.
Patients and methods
In the present study, a total of 90 GC samples and 90 adjacent noncancerous tissues were used to examine the expression of Paip1. In order to gain a deep insight into the molecular mechanism of Paip1 in GC, the Paip1 siRNA sequences were transfected into GC cell lines (MGC-803 and SGC-7901), respectively. Meanwhile, Paip1 plasmid was used to mediate overexpression of Paip1. Cell proliferation were examined via colony formation assay, EdU assay and flow cytometry assay. Cell metastasis were discovered via wound healing assay and Transwell assays. In addition, key EMT makers were detected by Western blotting assay.
Results
In this study, Paip1 expression was observed to be upregulated in GC and was associated with shorter overall survival. Knockdown of Paip1 inhibited cell proliferation, migration and caused cell cycle arrest in GC cells, whereas its overexpression reversed these effects. Another mechanistic study showed that Paip1 overexpression promoted EMT progression and regulated its targets expression.
Conclusion
High expression of Paip1 plays a significant role in the progression of GC and may be a potential biomarker of poor prognosis as well as a therapeutic target.
Keywords: Paip1, metastasis, proliferation, gastric cancer, prognostic marker
Introduction
GC is one of the leading causes of cancer-related deaths worldwide and occurs with the highest frequency in China.1,2 According to Chinese statistics from 2015, 679 100 new cases of GC were diagnosed, and 498 000 patients died in 2015. Residents of rural areas were reported to have significantly higher incidence and mortality rates than urban residents.3 These studies show that incidence rates of GC depend on geography. Due to the limited clinical approaches for the early diagnosis and treatment of GC, the prognosis for GC patients is far from optimistic. Therefore, a comprehensive understanding of the etiology and mechanisms of GC development could benefit the identification of novel targets associated with GC.
The mammalian PABP-binding protein is polyadenylate-binding protein-interacting protein 1 (Paip1), which can stimulate the initiation of translation by binding PABP.4,5 Protein synthesis regulation at translation initiation is a crucial mechanism for regulating cell proliferation and differentiation.6,7 Recently, many studies have reported that imbalances in this process may contribute to cell immortalization and oncogenic transformation.8,9 Based on these studies, Paip1 might be involved in cancer development and progression. Previous research has demonstrated that Paip1 is overexpressed in invasive cervical cancer and amyotrophic lateral sclerosis and participates in the malignant progression of cervical epithelial cells.10,11 However, the mechanisms underlying these tumor-promoting effects of Paip1 are still not well understood.
In the present study, we explored the role of Paip1 in GC. The results showed that knockdown of Paip1 inhibited the proliferation and metastasis of GC cells. These results suggest that Paip1 is a novel oncogene in GC that could be used as an additional diagnostic target and a potential therapeutic target for GC patients.
Materials and methods
Ethics statement
This study complied with the principles of the Declaration of Helsinki and was approved by the human ethics and research ethics committees of Yanbian University Medical College in China. All patients whose tissues used in this research were provided written informed consent. Their resected specimens were stored by our hospital and will potentially be used for scientific research. Their privacy will be maintained. The Follow-up survival data were collected retrospectively through medical-record analyses.
Tissues and specimens
A total of 90 cases of surgically resected GC and 90 cases of peritumoral gastric tissues were collected from the files of Yanbian University Cancer Research Center. All patients are Han nationality, from Jilin Province, China. All patients did not receive chemotherapy. All cases were reviewed by two pathologists, and the histological diagnoses were confirmed without discrepancy. All samples were routinely fixed in 10% buffered formalin and embedded in paraffin blocks. The pathological parameters, including age, gender, tumor invasion, histological grade, lymph node metastasis, lymphatic invasion, clinical stage and survival data, were reviewed. Overall survival (OS) time was defined as the time from surgery to cancer-related death. The pathological parameters considered in this study are summarized in Table 1.
Table 1.
Paip1 protein expression in gastric cancer and adjacent-nontumor tissues
| Diagnosis | No. of cases | Paip1 expression | Positive rate (%) | Strongly positive rate (%) | |||
|---|---|---|---|---|---|---|---|
| - | + | ++ | +++ | ||||
| Gastric cancers | 90 | 13 | 40 | 28 | 9 | 85.5** | 41.1** |
| Normal tissues | 90 | 57 | 27 | 6 | 0 | 36.6 | 7.0 |
Note: **Mean p<0.01. Positive rate percentage of positive cases with “+”, “++”, and “+++” staining score; Strongly positive rate percentage of positive cases with “++” and “+++” staining score.
Immunohistochemical (IHC) analysis
Immunohistochemical (IHC) analysis was performed using a Dako LSAB kit (Dako A/S, Glostrup, Denmark). Tissue sections were deparaffinized, hydrated and incubated with 3% H2O2 in methanol. Next, the antigen was restored and then incubated with 1% bovine serum albumin. The slides were incubated overnight at 4 °C with a primary antibody. Then, the cells were incubated with a secondary antibody for 30 min, followed by diaminobenzidine (DAB), and counterstained with Mayer’s hematoxylin. Using a rabbit IgG isotope as a negative control, positive tissue sections were processed, and the primary antibody was omitted as an additional negative control.
Two pathologists analyzed the samples without knowledge of the clinical results of all tissue samples. If there was a difference between the two analyses, the two pathologists reassessed the samples on a double-headed microscope to determine the final score. In short, the staining intensity was scored as 0 (negative), 1 (weak), 2 (intermediate) and 3 (strong). The staining proportion was scored as 0 (<10%), 1 (11–25%), 2 (26–50%), 3 (51–75%) and 4 (76–100%). The intensity and proportion scores were used to calculate the final immunoreactive score. Tissue sections scored as ≥4 were considered a strong positive (high expression level) of Paip1 protein. The immunoreactive scores were grouped as strong (≥4) and weak (<4) for survival analysis.
UALCAN database
UALCAN is a user-friendly and interactive web resource for analyzing cancer transcriptome data. We analyzed the mRNA expression of Paip1 using the UALCAN database, which included 415 GC samples and 34 normal gastric tissue samples.12
Cell culture
Four human cancer cell lines (MGC-803, BGC-823, SGC-7901, and AGS) and a normal gastric epithelial cell line (GES-1) were obtained from the Chinese Academy of Medical Sciences Cell Bank and stored at Yanbian University Cancer Research Center. The cells were cultured in RPMI 1640 medium (Gibco, Gaithersburg, MD, USA) supplemented with 10% fetal bovine serum and 100 U/ml penicillin/streptomycin and then placed in a humidified 5% CO2 incubator at 37 °C.
Paip1 knockdown and overexpression
SiRNA was transfected with Lipofectamine 3000 (Invitrogen, CA, USA) according to the manufacturer’s instructions. The siRNA1 and siRNA2 sequences were 5ʹ-GGATTATCCTACTCTATCA-3ʹ and 5ʹ-GTGGCAACTTCCGCCAATT-3ʹ, respectively. Nontargeting siRNA was used as a negative control (siCON). All of the primer sequences were synthesized by RiboBio (Guangzhou, China). Protein expression levels were analyzed after 48 h of transfection.
Human Paip1 cDNA was purchased form (Genechem) and cloned into the GV144 plasmid. The Paip1 plasmid and corresponding empty vector were transfected into GC cell using Lipofectamine 3000 reagent (Invitrogen) according to the manufacturer’s protocol.
Western blotting
Cells were washed twice with ice-cold PBS and then lysed in RIPA lysis buffer (CWBIO). The protein concentration of the lysates was determined with the Bradford reagent (Aid Lab). Equal amounts of proteins were separated on SDS polyacrylamide gels and transferred to polyvinylidene fluoride (PVDF) membranes. The membranes were blocked with 5% fat-free milk and immunoblotted overnight at 4 °C with primary antibodies followed by the corresponding secondary antibodies for 1 h. β-actin was used as the loading control. The membranes were detected using enhanced chemiluminescent (ECL) Prime Western blotting detection reagent (Amersham Biosciences, Uppsala, Sweden). Images were acquired with a Champchemi Professional image analysis system (Sagecreation, Beijing, China) and quantified using LANE 1D software (Sagecreation).
Immunofluorescence (IF) staining analysis
IF staining was used to analyze the subcellular localization of the Paip1 protein in MGC-803 and SGC-7901 cells. The cells were grown on coverslips to 65–75% confluence, fixed with 3.65% paraformaldehyde for 5 min and penetrated with 0.5% TritonX-100 for 12 min. After blocking with 3% bovine serum albumin fraction V (A8020, Solarbio, Beijing, China) for 1.5 h, the slides were quickly washed with phosphate-buffered saline (PBS) three times. Then, the cells were incubated overnight at 4 °C with a primary antibody followed by incubation with Alexa Fluor 488 goat anti-rabbit IgG (H + C) (A11008, 1:1000 dilution, Invitrogen, USA) for 1 h. After washing with PBS, the cells were counterstained with diamidino phenylindole (DAPI) (C1006, Beyotime, Shanghai, China) and fixed on a slide. Finally, the IF signals were observed and imaged using a Leica SP5II CLSM microscope (Heidelberg, Germany) with filters for the corresponding fluorescent stains.
Colony formation assay
Cells were seeded at a density of 5×10³cells in six-well plates and incubated at 37 °C for approximately 2–3 weeks. Even if not observed under the microscope, the culture was terminated when the clones were clearly visible. The number of colonies containing more than 50 cells was counted using crystal violet staining and an Olympus phase contrast microscope.
Flow cytometry analysis of the cell cycle
For cell cycle analysis, MGC-803 and SGC-7901 cells were transfected with Paip1 or siCON for 48 h seeded in 6-well plates and cultivated for 24 h. Then, the cells were collected and fixed in 75% ethanol at 4 °C for 24–48 h and stained with 300 μl propidium iodide (PI) (BD Biosciences, Bedford, MA, USA). Finally, the cell cycle distribution was analyzed by an Accuri C6 flow cytometer (Accuri, Ann Arbor, MI), and the data were analyzed with ModFit (Verity Software House, Topsham, ME).
5-ethynyl-2ʹ-deoxyuridine (EdU) incorporation assay
MGC-803 and SGC-7901 cells transfected with Paip1 or siCON were plated in 96-well plates at a density of 5×10⁴ cells/well and then treated with 50 mM EdU for an additional 2 h at room temperature. Then, the cells were fixed with 4% paraformaldehyde for 15 min. After washing with 3% BSA (bovine serum albumin), the cells were permeabilized with 0.5% Triton X-100 for 20 min. After washing with PBS, 500 ml Click-iT mix was added to each well, and the cells were incubated for 30 min. Finally, the cells were stained with 1 ml Hoechst 33342 for 15 min and observed under a Leica SP5II CLSM microscope.
Wound healing assay
Cells were seeded in 6-well plates and allowed to grow until 90% confluent. scratched with a 10-μl pipette tip and washed twice with PBS to remove the nonadherent cells. Then, the cells were incubated in growth media that changes its distribution to reflect cell migration. Wound closure was analyzed after 0, 12, 24 and 48 h (indicated by cell migration to the scratched acellular area). All experiments were performed in triplicate.
Transwell assays
Cell migration was determined using 24-well transwell plates with 8-μM pore sizes. Cell invasion was analyzed using the same transwell inserts coated with Matrigel. Cells (5.0×10⁴/500 μL serum-starved medium) were added to the upper chambers, and complete medium was added to the bottom wells. After incubating for 48 h at 37 °C, 4% paraformaldehyde was added to both chambers for 1 min at room temperature. The upper faces of the filters were then wiped with cotton swabs. Then, Giemsa staining (Wako) was performed, and invading and migrating cells were counted using a microscope.
Statistical analysis
Statistical analyses were performed using SPSS/Win17.0 software (SPSS, Inc., Chicago, IL, USA) and GraphPad Prism® version 7.00 (GraphPad Software, USA). The results are presented as the mean ± SD. All observations were confirmed by at least three independent experiments. Survival curves were analyzed by the log-rank Kaplan-Meier method followed by log-rank testing for univariate analysis. Multivariate analyses were performed using Cox’s proportional hazards regression model. p<0.05 was considered statistically significant. Colony formation and cell migration and invasion levels were compared using Student’s t-test or Mann-Whitney U test.
Results
Paip1 is frequently overexpressed in GC
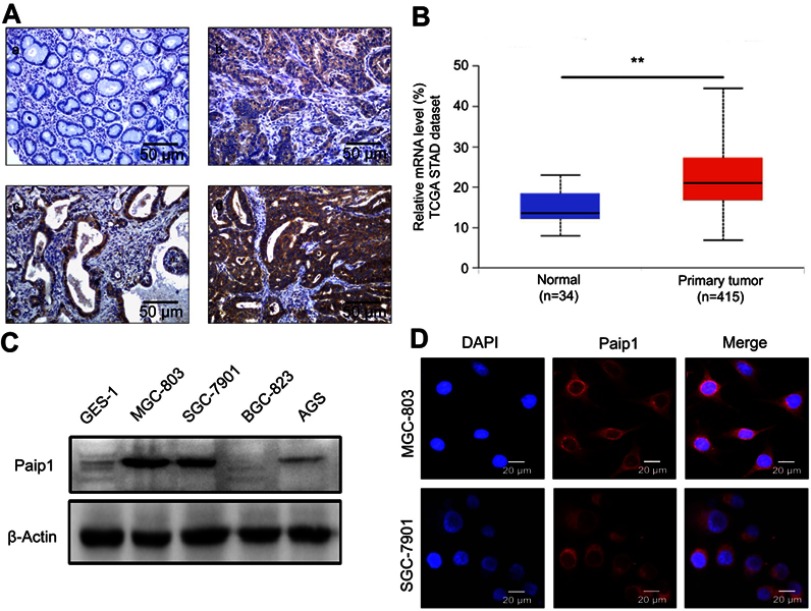
To identify the expression status of Paip1, we first performed IHC staining of GC tissues and adjacent normal gastric tissues. The results showed that Paip1 expression was upregulated in GC tissues compared to adjacent normal tissues (Figure 1A). As shown in Table 1, the positive rate was 85.5% in GC tissues (77/90), which was significantly greater than that in adjacent normal gastric tissues (36.6%, 33/90; p<0.01). Similarly, the strongly positive rate of Paip1 protein in GC tissues (41.1%, 37/90) was significantly greater than that in adjacent normal gastric tissues (7%, 6/90; p<0.01) (Table 1). Additionally, we evaluated the mRNA expression level of Paip1 in clinical samples using microarray data obtained from the UALCAN dataset, which indicated that the Paip1 expression level in GC tissues was greater than that in adjacent normal tissues (Figure 1B). Then, we analyzed the expression levels of Paip1 in four human GC cell lines (AGS, SGC-7901, BGC-823 and MGC-803) and a normal gastric epithelial cell line (GES-1). The results demonstrated that the expression levels of Paip1 were significantly increased in human GC cell lines compared the GES-1 gastric epithelial cells (Figure 1C). Moreover, IF analysis also confirmed that Paip1 was located in the cytoplasm of GC cells (Figure 1D). These results provide support for the overexpression of Paip1 in GC.
Figure 1.
Paip1 expression was upregulated in GC.
Notes: (A), a, Paip1 expression was downregulated in adjacent nontumor tissue. b, Paip1 was weakly positive in GC tissue. c, Paip1 was positively expressed in GC tissue. d, Paip1 was strongly positive in GC tissue. Original magnification ×200. (B) The UALCAN dataset showed that the average Paip1 mRNA expression level was higher in GC tissues than in normal gastric tissue. (C) Western blot analysis of Paip1 in a normal human gastric cell line (GES-1) and GC cell lines (AGS, SGC-7901, BGC-823 and MGC-803). The expression levels were normalized to β-actin. (D) IF analysis showed that Paip1 (red) was strictly located in the cytoplasm of MGC-803 and SGC-7901 cells. Original magnification was ×400; blue indicates DAPI staining; red indicates Paip1 staining. **p<0.01.
Abbreviations: GC, gastric cancer; DAPI, 4ʹ,6-diamidino-2-phenylindole.
Paip1 overexpression is associated with poor patient outcome in GC
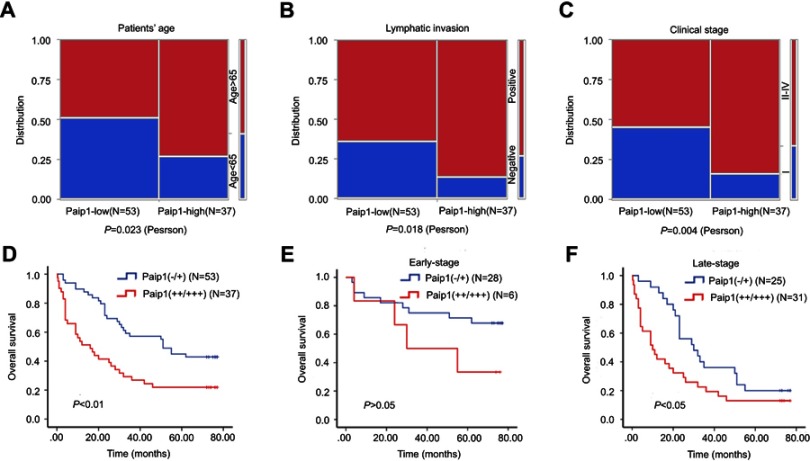
According to the results of IHC, correlation analysis showed that protein expression level of Paip1 was significantly correlated with patient age, lymphatic invasion and clinical stage. However, the expression level of Paip1 was not related to gender, LN metastasis or histological stage (Table 2 and Figure 2A–C). Univariate analysis demonstrated that age, tumor invasion, lymphatic invasion, clinical stage and Paip1 expression were associated with the overall survival (OS) rate of GC patients (Table 3). In addition, multivariate analysis using Cox’s proportional hazards model for all significant variables examined in the univariate analysis showed that age, tumor invasion and Paip1 expression were independent prognostic factors for GC patients (Table 3). Similar to univariate and multivariate analyses, patients whose tumors expressed a high level (++/+++) of Paip1 had a significantly shorter overall survival time than those whose tumors expressed a low level (−/+) of Paip1 (p<0.001) (Figure 2D). For late-stage (II–IV) GCs, OS rates were significantly higher in patients with low Paip1 expression than in those with high expression (p<0.05) (Figure 2E). By combination analysis, we found that the expression of Paip1 protein did not correlate with the survival rate of patients with early stage GC (p>0.05) (Figure 2F). Overall, these data suggest that Paip1 might be a potential prognostic factor in GC.
Table 2.
Correlation between Paip1 expression and clinicopathological parameters of gastric cancer patients
| Clinical features | No. of Cases | Strongly positive cases (%) | χ2 | p-value |
|---|---|---|---|---|
| Gender | 2.303 | 0.129 | ||
| Male | 68 | 31 (45.6) | ||
| Female | 22 | 6 (27.3) | ||
| Age | 5.148 | 0.023* | ||
| <65 | 37 | 10 (27.0) | ||
| ≥65 | 53 | 27 (50.9) | ||
| Histological grade | 1.795 | 0.180 | ||
| Grade-I, II | 29 | 9 (31.0) | ||
| Grade-III | 61 | 28 (45.9) | ||
| Tumor invasion | 2.086 | 0.149 | ||
| T1-T2 | 16 | 4 (25.0) | ||
| T3-T4 | 74 | 33 (44.6) | ||
| LN metastasis | 2.171 | 0.141 | ||
| Positive | 37 | 12(86.5) | ||
| Negative | 53 | 25(64.2) | ||
| Lymphatic invasion | 5.559 | 0.018* | ||
| Positive | 66 | 32 (48.4) | ||
| Negative | 24 | 5 (31.2) | ||
| P53 | 0.008 | 0.927 | ||
| Positive | 37 | 15 (40.5) | ||
| Negative | 53 | 22 (41.5) | ||
| Clinical stage | 8.284 | 0.004** | ||
| Stage I | 30 | 6 (20.0) | ||
| Stage II, III, IV | 60 | 31 (51.7) |
Note: *Mean p<0.05. **Mean p<0.01. Age: p=0.023; Lymphatic invasion: p=0.018; and Clinical stage: p=0.004.
Abbreviations: LN metastasis, Lymph node metastasis.
Figure 2.
Survival rate of sub-groups in gastric cancer.
Notes: (A-C) The relationships between Paip1 expression and the clinicopathologically significant aspects of GC. (D) Kaplan-Meier analysis of Paip1 (−/+) (53 cases) and Paip1 (++/+++) (37 cases) showed significant differences in GC. (E) Kaplan-Meier analysis of Paip1 (−/+) (28 cases) and Paip1 (++/+++) (6 cases) showed no significant in the early-stage GC. (F) Kaplan–Meier analysis of Paip1 (−/+) (25 cases) and Paip1 (++/+++) (31 cases) showed significant differences in the late-stage GC.
Table 3.
Univariate survival analyses (Cox regression model) of various factors in patients with gastric cancer
| Factors | B | SE | Wald | HR | 95%CI | p-value | |
|---|---|---|---|---|---|---|---|
| Lower | Upper | ||||||
| Univariate | |||||||
| Gender | 0.176 | 0.314 | 0.316 | 1.193 | 0.645 | 2.207 | 0.574 |
| Age | 0.628 | 0.278 | 5.096 | 1.874 | 1.086 | 3.233 | 0.024* |
| Tumor invasion | 1.565 | 0.594 | 6.937 | 4.783 | 1.492 | 15.327 | 0.008** |
| Histological grade | 0.451 | 0.287 | 2.462 | 1.569 | 0.894 | 2.755 | 0.117 |
| LN metastasis | 0.223 | 0.298 | 0.558 | 0.673 | 0.696 | 2.243 | 0.455 |
| Lymphatic invasion | 1.074 | 0.363 | 8.734 | 2.927 | 1.436 | 5.967 | 0.003** |
| Clinical stage | 1.250 | 0.337 | 13.784 | 3.491 | 1.804 | 6.755 | 0.001** |
| P53 | 0.373 | 0.260 | 2.058 | 1.452 | 0.872 | 2.417 | 0.151 |
| Paip1 | 0.804 | 0.261 | 9.492 | 2.235 | 1.340 | 3.729 | 0.002** |
| Multivariate | |||||||
| Clinical stage | 0.875 | 0.521 | 2.822 | 2.399 | 0.864 | 6.661 | 0.093 |
| Age | 0.611 | 0.289 | 4.473 | 1.791 | 1.046 | 3.243 | 0.034* |
| Tumor invasion | 1.185 | 0.604 | 3.849 | 3.270 | 1.001 | 10.681 | 0.050 |
| Lymphatic invasion | 0.077 | 0.565 | 0.019 | 1.080 | 0.357 | 3.268 | 0.891 |
| Paip1 | 0.743 | 0.265 | 7.874 | 2.103 | 1.251 | 3.535 | 0.005** |
Note: *Mean p<0.05. **Mean p<0.01.
Abbreviations: LN metastasis, lymph node metastasis; B, Coefficient; SE, standard error; Wald, Wald statistic; HR, hazard ratio; CI; confidence interval.
Silencing of Paip1 expression suppressed cell proliferation and induced cell cycle arrest
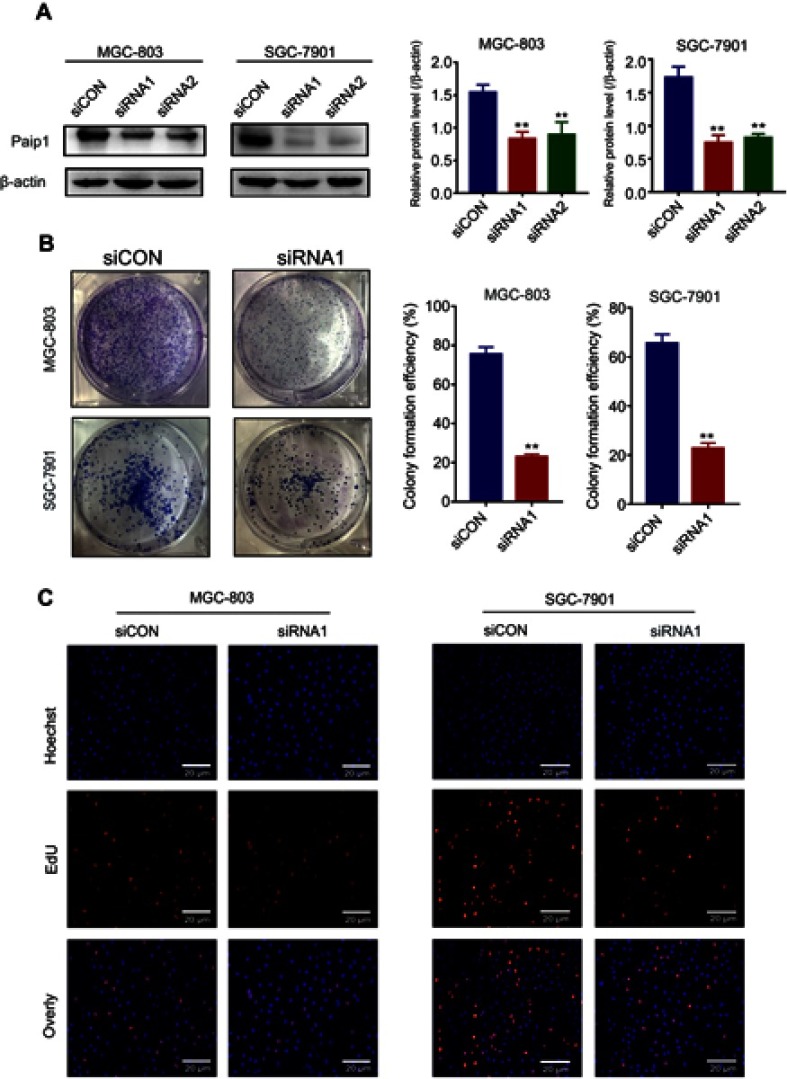
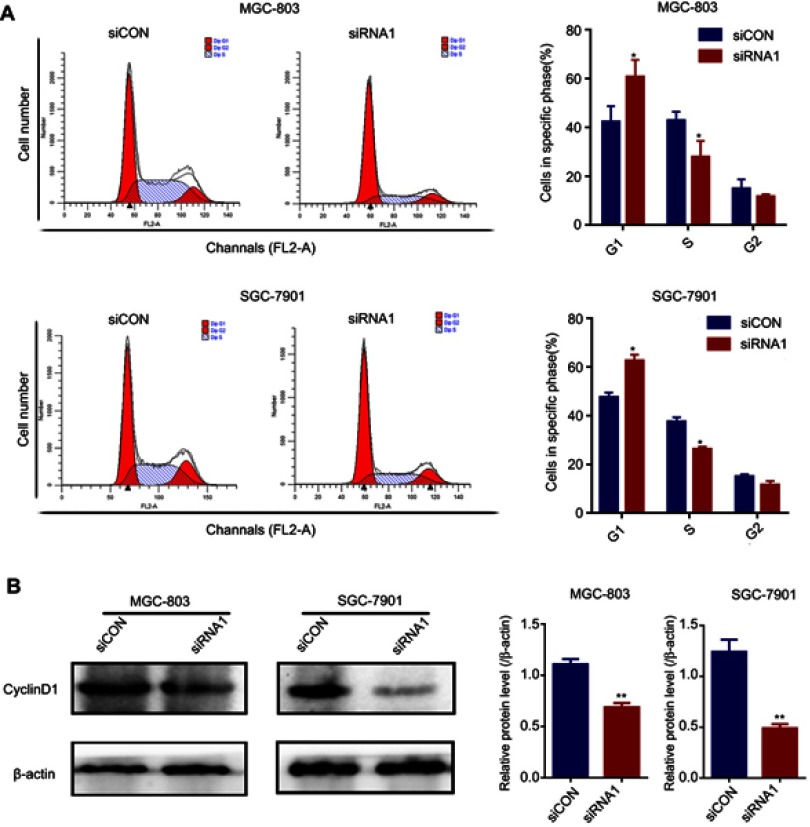
To further investigate the function of Paip1 in GC cells, we silenced Paip1 expression using siRNA in MGC803 and SGC-7901 cells. Western blot analysis showed that Paip1 protein expression levels were significantly decreased in MGC803 and SGC-7901 cells transfected with specific siRNA compared with cells transfected with control siRNA (Figure 3A). As shown in Figure 3B, silencing Paip1 expression significantly inhibited the colony formation ability of GC cells. Additionally, compared to the negative control group, the number of EdU-positive cells significantly decreased upon Paip1 siRNA transfection (Figure 3C), suggesting that silencing Paip1 expression decreased DNA synthesis. The speed of the cell cycle is closely related to cell proliferation.13,14 We identified that silencing Paip1 induced cell cycle arrest in the G1/S phases (Figure 4A). In addition, Western blot analysis indicated that the expression of cyclin D1 was downregulated after Paip1 silencing (Figure 4B). Therefore, our studies demonstrated that silencing Paip1 expression induced G1/S cell cycle arrest as the predominant mechanism in the inhibition of cell proliferation.
Figure 3.
Silencing Paip1 inhibited cell proliferation.
Notes: (A) Western blot analysis of Paip1 expression in MGC803 and SGC-7901 cells. (B) Representative images of the colony formation assay in MGC803 and SGC-7901 cells treated with siCON and siRNA1. (C) The proliferative ability of MGC-803 and SGC-7901 cells transfected with siCON and siRNA1 was analyzed by Edu staining. Each column shows the mean of three independent experiments. Each bar represents the mean ± SD. **p<0.01.
Abbreviations: siCON, non-targeting siRNA; siRNA, small interfering RNA.
Figure 4.
Silencing Paip1 inhibited cell cycle arrest.
Notes: (A) Flow cytometric analysis of the cell cycle indicated that Paip1 downregulation significantly induced MGC-803 and SGC-7901 cell cycle arrest in the G1/S phase. (B) The cyclin D1 expression level in MGC-803 and SGC-7901 cells was decreased after siRNA1 silencing. Each bar represents the mean ± SD. *p<0.05, **p<0.01.
Abbreviations: siCON, non-targeting siRNA; siRNA, small interfering RNA.
Silencing Paip1 expression inhibited EMT progression to prevent tumor metastasis
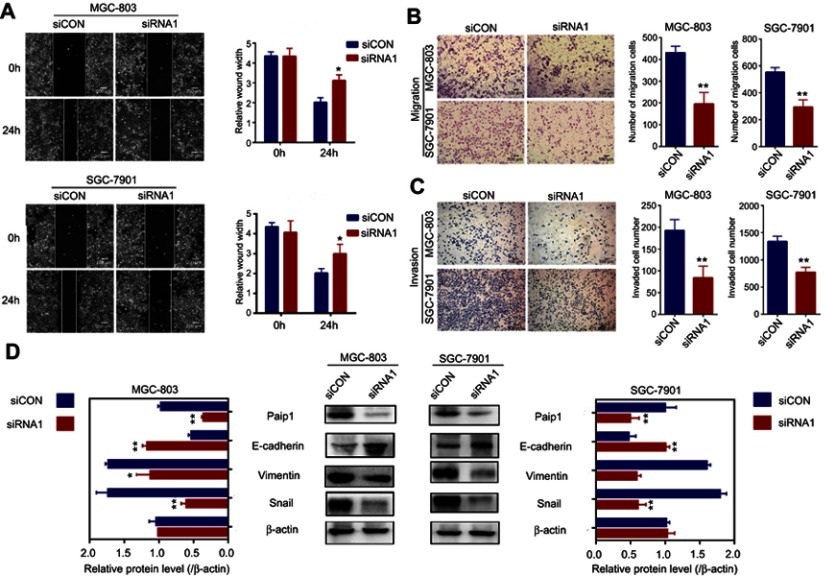
To identify the role of Paip1 in cell migration and invasion, we performed a wound healing assay and Transwell assays. The results showed that the cell migration and invasion abilities were attenuated in Paip1-silenced cells (Figure 5A–C). Epithelial-mesenchymal transition (EMT) is the transition from polarized epithelial cancer cells to contractile and motile mesenchymal cells during cancer progression and metastasis.15 Paip1-silenced GC cells were analyzed for key EMT markers, such as Snail, vimentin and E-cadherin. The results showed that the expression of the mesenchymal marker vimentin and the EMT-related transcription factor snai1 were downregulated in Paip1-silenced cells, while the expression of the epithelial marker E-cadherin was significantly upregulated (Figure 5D). Our experiments demonstrated that Paip1 regulated EMT progression to promote tumor metastasis.
Figure 5.
Silencing Paip1 expression inhibited GC cell migration by preventing EMT.
Notes: (A) The motility of the cells was evaluated by a wound healing assay in MGC-803 and SGC-7901 cells treated with siRNA1 and siCON. (B, C) The effects of Paip1 downregulation on cell migration and invasion were determined by Transwell assays in MGC-803 and SGC-7901 cells treated with siRNA1 and siCON. (D) EMT-related protein expression was analyzed in MGC-803 and SGC-7901 cells treated with siRNA1 and siCON. Each column shows the mean of three independent experiments. Each bar represents the mean ± SD. *p<0.05, **p<0.01.
Abbreviations: siCON, non-targeting siRNA; siRNA, small interfering RNA.
Paip1 overexpression promoted proliferation and metastasis in GC cell
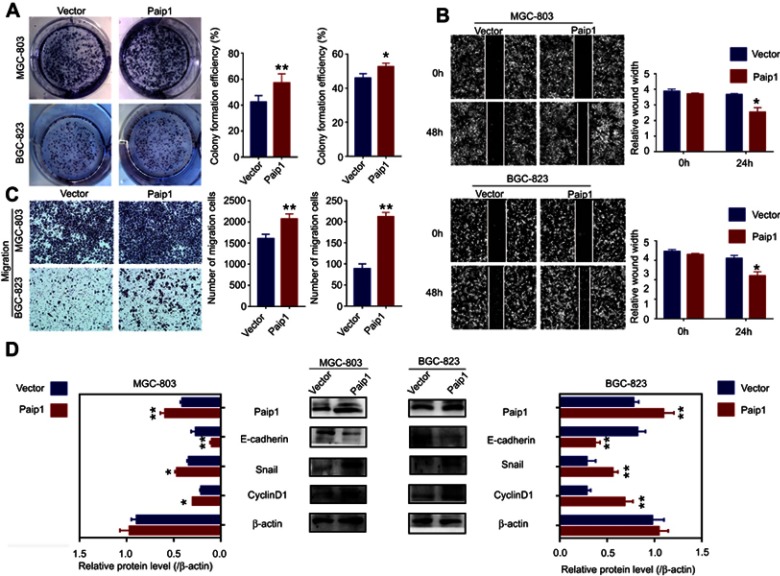
To determine the biological functions of Paip1 in GC, we established stable overexpression of Paip1 in MGC-803 and BGC823 cells. (Figure 6D). Colony formation assay showed that Paip1 overexpression significantly promoted the colony formation ability of GC cells. (Figure 6A). In addition, Western blot analysis indicated that Paip1 overexpression increased the expression of cyclin D1 in GC cells. (Figure 6D). To determine the role of Paip1 in cell migration and invasion, we performed a wound healing assay and Transwell assays. The results showed that Paip1 overexpression significantly promoted GC cell metastasis (Figure 6B and C). Whether Paip1 was involved in the regulation of EMT process of GC, we examined typical EMT proteins. Western blotting indicated that after overexpression in MGC-803 and BGC823 cells, the expression of vimentin and snai1 levels reduced while E-cadherin levels increased. (Figure 6D). These results indicated that Paip1 overexpression promoted GC cell proliferation and metastasis.
Figure 6.
Paip1 overexpression promoted GC cell proliferation and migration.
Notes: (A) Colony formation assay suggested that Paip1 overexpression significantly promoted GC cell proliferation. (B, C) Transwell assay and wound healing assay showed that Paip1 overexpression significantly promoted GC cell invasion. (D) EMT-related protein and cyclinD1 expression were analyzed in MGC-803 and BGC-823 cells treated with paip1 vector and empty vector. Each column shows the mean of three independent experiments. Each bar represents the mean ± SD. *p<0.05, **p<0.01.
Discussion
Abnormal regulation at the initial stage of the translation process leads to unusual gene expression that alters cell growth and may lead to cancer development.16 Shull AY et al reported the potential dependence of eukaryotic translation factor 4G (eIF4G) overexpression in chronic lymphocytic leukemia (CLL) survival.17 Simultaneously, Zhong and associates showed that overexpression of eukaryotic translation initiation factor 4A (eIF4A) conferred cancer cells with resistance to cell death.18 A new human PABP-interacting protein, Paip1, whose sequence is similar to the central portion of eIF4G and interacts with eIF4A, results in the stimulation of protein translation by binding PABP and activating protein translation.19–21 Accordingly, we hypothesized that Paip1 might be involved in the multicellular function of cancer progression as a translation initiation regulator.
Notably, for the first time, we demonstrated that Paip1 was significantly overexpressed at both the protein and mRNA levels in GC tissues but rarely in adjacent normal gastric tissues. These results demonstrated that Paip1 participates in the process of GC progression. Additionally, in the univariate analysis, patient age, tumor invasion, lymphatic invasion, clinical stage and Paip1 were identified as factors associated with the OS results (p<0.05). For the multivariate analysis, tumor invasion and Paip1 were independently associated with the OS results (p<0.05). Similarly, Paip1 expression was more abundant in stage II, III and IV GC than in stage I of GCs. Thus, Paip1 overexpression is correlated with late-stage cancers. Based on our findings, we propose that Paip1 can be potentially used as a novel therapeutic target for GC.
Although a high expression level of Paip1 was observed in GC, the detailed molecular mechanisms by which the overexpression of Paip1 promotes GC have not been elucidated. In our previous study, we showed that suppression of Paip1 expression inhibits breast cancer cell proliferation.22 In this study, we found that the ability of proliferation in GC cells were significantly inhibited with the depletion of Paip1 and increased with the overexpression of Paip1 in vitro. Importantly, cell cycle analysis showed that silencing Paip1 expression delayed G1/S stage in GC cells. These results indicated that suppression of Paip1 expression affected cell growth by inducing cell cycle arrest. Patel et al reported that cyclinD1 overexpression may accelerate G1/S stage as a positive regulator of cell cycle progression, accelerating cell proliferation.23 As indicated by our data, Paip1 knockdown led to decreased expression of Cyclin D1, whereas Paip1 overexpression enhanced Cyclin D1 expression. These results supported that Paip1 can control the progression of cell cycle by regulating the expression level of Cyclin D1.
Metastasis involves a series of complex steps, including reduced adhesion, increased motility, cell attachment, matrix lysis and migration.24,25 We observed that the increased levels of Paip1 is significantly correlated with poor prognostic features such as lymphatic invasion advanced tumor pathologic stage, and tumor TNM stage. Previous studies have demonstrated that Paip1 might be involved in the invasion of cervical cancer.10 Furthermore, our results showed that after silencing Paip1 expression, the migration distance and invasiveness of GC cells decreased, while Paip1 overexpression exhibited the opposite results. These results reveal that Paip1 prompted the migration and invasion in GC cells. Based on the abovementioned results, we investigated the underlying molecular mechanisms for promotion of metastasis by Paip1 in greater detail. EMT is a key process in tumor metastasis and is involved in the coordinated regulation of many genes.26–28 In this study, we discovered that Paip1 overexpression promoted EMT by decreasing the expression of the mesenchymal markers vimentin and snail and by elevating the expression of the epithelial marker E-cadherin. These results confirmed that Paip1 promoted cell migration and invasion by promoting the process of EMT in GC. Further studies should be conducted to determine the mechanism by which Paip1 promotes GC metastasis by controlling the translation of EMT-related genes.
Conclusion
This study demonstrated that Paip1 overexpression is strongly related to GC progression and is an independent prognostic factor. Moreover, Paip1 overexpression promoted cell proliferation, migration, invasion and EMT progression in GC cells. Our findings indicated that Paip1 may also represent a new molecular biomarker for human GC.
Acknowledgments
This study was supported by the National Natural Science Funds of China (No. 31760313, 31460303, 81660609), the Funds of Changbai Mountain Scholar Project and Key Laboratory of the Science and Technology Department of Jilin Province.
Author contributions
Zhenhua Lin and Xianglan Zhang conceived this study and takes responsibility for the quality of the data. Jie Sun and Anna Han participated in the tissue sample selection and experiments. Liyan Chen acquired data and played an important role in interpreting the results. Qianrong Wang performed the data analysis and wrote the manuscript. Xiangshan Ren played an important role in modifying the paper. All authors contributed to data analysis, drafting or revising the article, gave final approval of the version to be published, and agree to be accountable for all aspects of the work.
Disclosure
The authors report no conflicts of interest in this work.
References
- 1.Siegel RL, Miller KD, Jemal A. Cancer statistics 2018. CA Cancer J Clin. 2018;68:7–30. doi: 10.3322/caac.21442 [DOI] [PubMed] [Google Scholar]
- 2.Van Cutsem E, Sagaert X, Topal B, Haustermans K, Prenen H. Gastric cancer. Lancet. 2016;388:2654–2664. doi: 10.1016/S0140-6736(16)30354-3 [DOI] [PubMed] [Google Scholar]
- 3.Chen W, Zheng R, Baade PD, et al. Cancer statistics in China, 2015. CA Cancer J Clin. 2016;66:115–132. doi: 10.3322/caac.21338 [DOI] [PubMed] [Google Scholar]
- 4.Craig AW, Haghighat A, Yu AT, Sonenberg N. Interaction of polyadenylate-binding protein with the eIF4G homologue PAIP enhances translation. Nature. 1998;392:520–523. doi: 10.1038/33198 [DOI] [PubMed] [Google Scholar]
- 5.Gray NK, Coller JM, Dickson KS, Wickens M. Multiple portions of poly(A)-binding protein stimulate translation in vivo. Embo J. 2000;19:4723–4733. doi: 10.1093/emboj/19.17.4723 [DOI] [PMC free article] [PubMed] [Google Scholar]
- 6.Sonenberg N, Hinnebusch AG. Regulation of translation initiation in eukaryotes: mechanisms and biological targets. Cell. 2009;136:731–745. doi: 10.1016/j.cell.2009.01.042 [DOI] [PMC free article] [PubMed] [Google Scholar]
- 7.Kong J, Lasko P. Translational control in cellular and developmental processes. Nat Rev Genet. 2012;13:383–394. doi: 10.1038/nrg3184 [DOI] [PubMed] [Google Scholar]
- 8.Spilka R, Ernst C, Mehta AK, Haybaeck J. Eukaryotic translation initiation factors in cancer development and progression. Cancer Lett. 2013;340:9–21. doi: 10.1016/j.canlet.2013.06.019 [DOI] [PubMed] [Google Scholar]
- 9.Sendoel A, Dunn JG, Rodriguez EH, et al. Translation from unconventional 5ʹ start sites drives tumour initiation. Nature. 2017;541:494–499. doi: 10.1038/nature21036 [DOI] [PMC free article] [PubMed] [Google Scholar]
- 10.Scotto L, Narayan G, Nandula SV, et al. Integrative genomics analysis of chromosome 5p gain in cervical cancer reveals target over-expressed genes, including Drosha. Mol Cancer. 2008;7:58. doi: 10.1186/1476-4598-7-58 [DOI] [PMC free article] [PubMed] [Google Scholar]
- 11.Fukada Y, Yasui K, Kitayama M, et al. Gene expression analysis of the murine model of amyotrophic lateral sclerosis: studies of the Leu126delTT mutation in SOD1. Brain Res. 2007;1160:1–10. doi: 10.1016/j.brainres.2007.05.044 [DOI] [PubMed] [Google Scholar]
- 12.Chandrashekar DS, Bashel B, Balasubramanya SAH, et al. UALCAN: a portal for facilitating tumor subgroup gene expression and survival analyses. Neoplasia. 2017;19:649–658. doi: 10.1016/j.neo.2017.05.002 [DOI] [PMC free article] [PubMed] [Google Scholar]
- 13.Kushner JA, Ciemerych MA, Sicinska E, et al. Cyclins D2 and D1 are essential for postnatal pancreatic beta-cell growth. Mol Cell Biol. 2005;25:3752–3762. doi: 10.1128/MCB.25.9.3752-3762.2005 [DOI] [PMC free article] [PubMed] [Google Scholar]
- 14.Sharma DK, Bressler K, Patel H, Balasingam N, Thakor N. Role of eukaryotic initiation factors during cellular stress and cancer progression. J Nucleic Acids. 2016;2016:8235121. doi: 10.1155/2016/8235121 [DOI] [PMC free article] [PubMed] [Google Scholar]
- 15.Nieto MA, Huang RY, Jackson RA, Thiery JP. Emt: 2016. Cell. 2016;166:21–45. doi: 10.1016/j.cell.2016.06.028 [DOI] [PubMed] [Google Scholar]
- 16.Ruggero D. Translational control in cancer etiology. Cold Spring Harb Perspect Biol. 2013;5(2):a012336. doi: 10.1101/cshperspect [DOI] [PMC free article] [PubMed] [Google Scholar]
- 17.Shull AY, Noonepalle SK, Awan FT, et al. RPPA-based protein profiling reveals eIF4G overexpression and 4E-BP1 serine 65 phosphorylation as molecular events that correspond with a pro-survival phenotype in chronic lymphocytic leukemia. Oncotarget. 2015;6:14632–14645. doi: 10.18632/oncotarget.4104 [DOI] [PMC free article] [PubMed] [Google Scholar]
- 18.Zhong X, Persaud L, Muharam H, et al. Eukaryotic translation initiation factor 4A down-regulation mediates interleukin-24-induced apoptosis through inhibition of translation. Cancers (Basel). 2018;10(5). doi: 10.3390/cancers10110400. [DOI] [PMC free article] [PubMed] [Google Scholar]
- 19.Zang Y, Zhang X, Yan L, et al. Eukaryotic translation initiation factor 3b is both a promising prognostic biomarker and a potential therapeutic target for patients with clear cell renal cell carcinoma. J Cancer. 2017;8:3049–3061. doi: 10.7150/jca.19594 [DOI] [PMC free article] [PubMed] [Google Scholar]
- 20.Attar-Schneider O, Drucker L, Gottfried M. Migration and epithelial-to-mesenchymal transition of lung cancer can be targeted via translation initiation factors eIF4E and eIF4GI. Lab Invest. 2016;96:1004–1015. doi: 10.1038/labinvest.2016.77 [DOI] [PubMed] [Google Scholar]
- 21.Imataka H, Gradi A, Sonenberg N. A newly identified N-terminal amino acid sequence of human eIF4G binds poly(A)-binding protein and functions in poly(A)-dependent translation. Embo J. 1998;17:7480–7489. doi: 10.1093/emboj/17.24.7480 [DOI] [PMC free article] [PubMed] [Google Scholar]
- 22.Piao J, Chen L, Jin T, Xu M, Quan C, Lin Z. Paip1 affects breast cancer cell growth and represents a novel prognostic biomarker. Hum Pathol. 2018;73:33–40. doi: 10.1016/j.humpath.2017.10.037 [DOI] [PubMed] [Google Scholar]
- 23.Patel H, Abduljabbar R, Lai CF, et al. Expression of CDK7, Cyclin H, and MAT1 Is elevated in breast cancer and is prognostic in estrogen receptor-positive breast cancer. Clin Cancer Res. 2016;22:5929–5938. doi: 10.1158/1078-0432.CCR-15-1104 [DOI] [PMC free article] [PubMed] [Google Scholar]
- 24.Vleminckx K, Vakaet L Jr., Mareel M, Fiers W, van Roy F. Genetic manipulation of E-cadherin expression by epithelial tumor cells reveals an invasion suppressor role. Cell. 1991;66:107–119. doi: 10.1016/0092-8674(91)90143-m [DOI] [PubMed] [Google Scholar]
- 25.Jewett A, Kos J, Fong Y, et al. NK cells shape pancreatic and oral tumor microenvironments; role in inhibition of tumor growth and metastasis. Semin Cancer Biol. 2018;53:178–188. doi: 10.1016/j [DOI] [PubMed] [Google Scholar]
- 26.Shook D, Keller R. Mechanisms, mechanics and function of epithelial-mesenchymal transitions in early development. Mech Dev. 2003;120:1351–1383. [DOI] [PubMed] [Google Scholar]
- 27.Radisky DC, Levy DD, Littlepage LE, et al. Rac1b and reactive oxygen species mediate MMP-3-induced EMT and genomic instability. Nature. 2005;436:123–127. doi: 10.1038/nature03688 [DOI] [PMC free article] [PubMed] [Google Scholar]
- 28.Thiery JP, Acloque H, Huang RY, Nieto MA. Epithelial-mesenchymal transitions in development and disease. Cell. 2009;139:871–890. doi: 10.1016/j.cell.2009.11.007 [DOI] [PubMed] [Google Scholar]


