

Abstract
Worries about the reproducibility of experiments in the behavioral and social sciences arise from evidence that many published reports contain false positive results. Misunderstanding and misuse of statistical procedures are key sources of false positives. In behavior analysis, however, statistical procedures have not been used much. Instead, the investigator must show that the behavior of an individual is consistent over time within an experimental condition, that the behavior changes systematically across conditions, and that these changes can be reproduced – and then the whole pattern must be shown in additional individuals. These high standards of within- and between-subject replication protect behavior analysis from the publication of false positive findings. When a properly designed and executed experiment fails to replicate a previously published finding, the failure exposes flaws in our understanding of the phenomenon under study – perhaps in recognizing the boundary conditions of the phenomenon, identifying the relevant variables, or bringing the variables under sufficient control. We must accept the contradictory findings as valid and pursue an experimental analysis of the possible reasons. In this way, we resolve the contradiction and advance our science. To illustrate, two research programs are described, each initiated because of a replication failure.
Keywords: Replication, Replication failure, Open Science Collaboration, Statistical significance, Fixed-ratio pausing, Conditioned reinforcement
Dr. Strangelove, Stanley Kubrick’s (1964) film classic, used satire to help Americans cope with their anxiety about the nuclear arms race between the United States and the Soviet Union during the Cold War. The film’s subtitle set the stage: How I Learned to Stop Worrying and Love the Bomb. This article is intended to help behavior analysts cope with their anxiety about the so-called “replication crisis.” The antidote will not be satire, however. Instead, I hope to persuade you that there is no crisis in behavior analysis. And although Kubrick was kidding about learning to love the atomic bomb, I am serious about getting you to stop worrying about replication failures in behavior analysis and, indeed, to love them.
Worries about the replicability of research in the behavioral and social sciences rose to the fore around 2010 (Nelson, Simmons, & Simonsohn, 2018). The worries were confirmed by the Open Science Collaboration, a group of investigators who tried, and for the most part failed, to replicate 100 experiments published in prominent psychology journals (Open Science Collaboration, 2015). They reported, for example, that the average effect size in the replication studies was about half of the size in the source publications, and only 36% of the replication studies yielded statistically significant results. The media promptly sounded the alarm. An article in Nature News, for example, said “Don’t trust everything you read in the psychology literature. In fact, two thirds of it probably should be distrusted” (Baker, 2015).
Today’s concern about the reliability of the behavioral and social sciences may be overly broad, considering that the Open Science Collaboration targeted research in only three journals: the Journal of Experimental Psychology: Learning, Memory, and Cognition, the Journal of Personality and Social Psychology, and Psychological Science. It is uncertain whether these journals are representative of mainstream psychology, but they certainly do not represent behavior analysis. And yet in the community of scholars and society at large, behavior analysis is lumped together with psychology and tarred with the same brush. It is important to understand what sets behavior analysis apart, and what could insulate it from the replication crisis.
Replication Failures in Psychology
The journals sampled by the Open Science Collaboration publish reports of group experiments supported by tests of statistical significance. The pitfalls of relying on significance tests have been recognized for a long time. A broad survey of the behavioral and social sciences, ecology, medicine, economics, and statistics found that published critiques of significance tests rose exponentially from the 1940’s through the 1990’s (Anderson, Burnham, & Thompson, 2000). Of particular note are two book-length treatments directed to psychologists. The first, The Significance Test Controversy (Morrison & Henkel, 1970), identified problems and offered solutions, but psychology’s difficulties with statistical tests did not go away. Almost thirty-five years later, the second book, Beyond Significance Testing (Kline, 2004) encouraged a new Zeitgeist, and many of the reforms it advocated have come into common use. In recent years, psychologists have placed more emphasis on estimates of effect size and confidence limits and less on null hypothesis testing.
Judging from the dire news in the Open Science Collaboration’s report, the changes in methods of data analysis were insufficient. Cohen (1994) seemed to have anticipated this outcome over twenty years ago when he admonished researchers with this bit of advice: “[D]on’t look for a magic alternative to [null hypothesis significance testing], some other objective mechanical ritual to replace it. It doesn’t exist” (p. 1001). The reliance on methodological rule books – and the mechanical rituals promoted by the rules – continued. Statistical tools have become more sophisticated – and probably better in a lot of ways – but too often they are applied in the same old rule-governed manner. “As researchers, we have a considerable array of statistical techniques that can help us find our way to theories of some depth,” Cohen wrote, “but they must be used sensibly and be heavily informed by informed judgment” (p. 1002). As I have suggested elsewhere (Perone, 1999), good sense and good judgment have not always been associated with the application of significance tests.
Nelson et al. (2018) contend that the replication crisis has helped generate widespread improvements in research methods, leading them to proclaim these times as “psychology’s renaissance.” One major improvement is the elimination of what they call “p-hacking,” which consists of conducting several analyses on a variety of measures and reporting only those that yield statistical significance. This common practice makes it easy to obtain statistical support for a false hypothesis and raises questions about the validity of any research that relies on null hypothesis significance testing. Nelson et al. drive the point home by demonstrating how to obtain statistical support for the preposterous claim that a person’s age can be changed by listening to a song (Simmons, Nelson, & Simonsohn, 2011)!
Another major improvement identified by Nelson et al. (2018) is acceptance of the need for replication. The work of the Open Science Collaboration is a conspicuous manifestation of this acceptance. This welcome development is long overdue. The critical importance of replication – and its superiority over significance testing as a measure of the reliability of experimental outcomes – has been recognized for a long time and promoted by articles in prominent journals (e.g., Cohen, 1994; Lykken, 1968; Smith, 1970). One must wonder how much trouble might have been averted if this message had taken hold in an earlier generation of psychologists.
Replication Failures in Behavior Analysis
Replication has been an essential feature of experimental methods in behavior analysis. This arose naturally in the field’s emphasis on the intensive study of the behavior of individuals by way of single-subject designs (e.g., Johnston & Pennypacker, 2009; Sidman, 1960). In his seminal book The Behavior of Organisms, Skinner (1938) documented the effects of his experimental manipulations by showing, side by side, graphs of results from individual rats. In these displays the similarities and differences across the rats are readily apparent. The similarities represent successful replications at the level of the individual organism, and Skinner was able to draw strong conclusions about those aspects of the results that were replicated across rats. At the same time, any important inconsistency across rats (not every inconsistency matters) constituted a replication failure that provided information about the limits of Skinner’s understanding of the behavioral phenomenon under study as well as a guide for further research.1
Twenty years after The Behavior of Organisms, Ferster and Skinner (1957) published Schedules of Reinforcement, a tour de force of experimental analysis at the level of the individual organism. The experimental sessions collectively lasted 70,000 h (eight years!) and the results are shown in over 900 sets of cumulative records produced by individual pigeons (and a few rats). By this time, null hypothesis significance testing had become a standard part of the experimental psychologist’s armamentarium, and it appears that Ferster and Skinner felt obligated to explain the absence of group means and statistical tests. Here is their description of how replication was used to assess the reliability of experimental outcomes:
Because of the very large number of hours of behavior recorded with this technique, and because we may use the reversibility of processes to provide control curves, the use of large groups of organisms was not necessary. Two pigeons are usually studied on a given schedule, but in some cases as many as four or five are used. If differences in performance are conspicuous and cannot be immediately explained in terms of differences in the behavior which the organisms bring to the schedules, the experimental conditions are further analyzed, and the experiment may be repeated with other pigeons. But this is rarely done. A given experiment is often repeated many times in later, more complex experiments. For example, the total number of pigeons studied on fixed-ratio schedules in this research is of the order of fifty, although no particular experiment involves more than three. (p. 38)
In Tactics of Scientific Research a few years later, Sidman (1960) formally described the research methods that had been developed by Skinner and his colleagues and their students. It is worth noting that three of the first four chapters addressed reliability, generality, and replication, and that Sidman’s treatment of these topics constituted a full 25% of the text. In the last 57 years, attention to these matters has been central to experimental research in behavior analysis. In this respect, it seems, behavior analysis has enjoyed a considerable head start over other branches of the behavioral and social sciences.
Research that meets the standards modeled by Skinner (1938) and Ferster and Skinner (1957) and formalized by Sidman (1960) avoids the replication crisis plaguing psychology specifically because replication is an integral part of the method. Within each experimental condition, the behavior of an individual subject is observed across a series of sessions until it stabilizes into a steady state, that is, until the behavioral measures of interest are replicated from session to session. Experiments compare two or more steady states engendered by different conditions imposed on the same subject. Control is demonstrated by the reliable production of behavior that changes systematically across conditions but remains stable within each condition. Replication of selected conditions demonstrates the ability to reproduce previously observed states of behavior. Replication across subjects demonstrates the reliability and generality of the relations under study. An ideal experiment is one with convincing evidence of all three types of replication: (a) at steady-state, behavior is consistent from one session to the next within each condition; (b) differences in behavior across conditions are reproduced; and (c) similar relations between the experimental conditions and behavior are obtained with several individuals.2
Application of these standards virtually eliminates the publication of false positive results. It does not, however, eliminate the possibility of replication failures. The advantage is in the way the failures can be treated by the scientific community. If both the original experiment and the failed replication meet the standards described here, neither set of results can be discounted. Both must be accepted. Contradictory results reveal the limits of our understanding: They show that variables relevant to the phenomenon of interest have not been identified, or brought under sufficient control, or both. The challenge, then, is to discover these variables and study them. The replication failure, in other words, serves a constructive purpose as a spur and guide to further experimentation.
The Desirability of Parametric Experiments
Before describing some specific replication failures, it is important to recognize that at least some experiments can be designed in a way that minimizes the misunderstandings that lead to the failures. If the experimental variable is quantitative rather than qualitative, it is possible to conduct a parametric experiment in which the quantitative variable is manipulated over some range. If the range is broad enough, the experiment provides information about the shape of the function relating the experimental variable and behavior, the values over which the variable is and is not effective, and individual differences across subjects. The desirability of parametric studies can be shown by considering some examples and comparing the information obtained from a broad manipulation of the experimental variable with the information obtained from a more limited manipulation.
Figure 1 shows results from Powell’s (1968) experiment in which the size of a fixed-ratio (FR) schedule was raised from 10 to 160 responses per food reinforcer. The behavior of interest is the pause in responding that occurred after each reinforcer. Powell studied three pigeons; results from two are shown in the figure. It is readily apparent, to me at least, that similar results were obtained with both pigeons: Raising the ratio increased the duration of the pause. Yes, the pigeons differ in that P44’s pauses are longer than P42’s, and it is conceivable that in some lines of inquiry this difference would be cause for concern. But Powell’s interest was in the relation between ratio size and pause duration, not the absolute duration of the pause. And regardless of the investigator’s interest, the fact remains that the positive relation between ratio size and pause duration observed in one pigeon was replicated in the other pigeon (as well as in Powell’s third pigeon not represented here).
Fig. 1.

Fixed-ratio pausing after reinforcer delivery by two pigeons in Powell’s (1968) experiment. The results are redrawn from Powell’s Figure 1 (p. 590).
In this case the between-subject replication was successful because of the wide range of ratios. Consider, therefore, what Powell might have been concluded had he limited his study to ratios from 10 to 50. Across that range, there is virtually no change in P42’s pausing – despite the five-fold increase in ratio from low to high – whereas P44’s pausing increases. Powell might have concluded that the effects of ratio size are unreliable when, in fact, the effect is reliable even though there are individual differences in sensitivity to ratio size. Suppose Powell had compared just two ratio sizes: 50 and 60. Across those ratios, P42’s pausing increases whereas P44’s decreases. This outcome would be both puzzling and discouraging. But because Powell’s range was so much broader, we can dismiss the downturn in P44’s function as relatively unimportant noise in an otherwise increasing function.3
Parametric experiments are common in studies of drug-behavior interactions. The drug’s effect is studied by administering a range of doses. Figure 2 provides an example with results from an experiment by Minervini and Branch (2013). Responding of pigeons was maintained on an FR schedule of food reinforcement. Before some sessions the pigeons received a dose of cocaine ranging from 1 mg to 10 mg per kg of body weight, or a like volume of inert saline. The figure shows response rates on the drug days as a percentage of the rate on the saline (control) days.
Fig. 2.
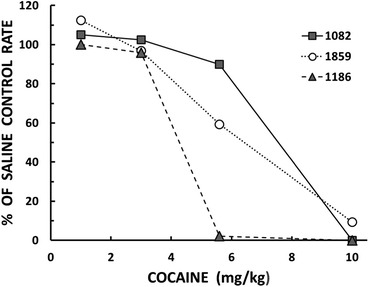
Responding on a fixed-ratio schedule as a function of cocaine dose by three of Minervini and Branch’s (2013) pigeons. The results are expressed as a percentage of the response rate on saline control days. The results are redrawn from their Figure 2 (p. 323).
Minervini and Branch studied five pigeons; results are shown here for only three of them. The straightforward conclusion to draw from Figure 2 is that raising the dose of cocaine decreases response rates. The effect is seen in all three pigeons, with some specific details in common: In none of the pigeons is there an effect of 1 mg/kg or 3 mg/kg, and in all of the pigeons responding is completely or almost completely suppressed at 10 mg/kg. What would have happened had Minervini and Branch (2013) confined their experiment to just two doses, say, 1 mg/kg and 3 mg/kg.? They might have questioned the efficacy of the drug. Suppose they had confined the experiment to 1 mg/kg and 5.6 mg/kg? They would have seen almost no effect in Pigeon 1082, virtually complete suppression of responding in Pigeon 1186, and an intermediate effect in Pigeon 1859. If they managed to publish such a mess, what could they possibly say about it? Perhaps they would hypothesize that some characteristic of each pigeon – some “pigeonality” trait – moderates the effect of cocaine.
The point of these examples is to demonstrate that broad manipulations of the sort conducted by Powell (1968) and Minervini and Branch (2013) can help us identify commonalities across subjects that are apparent even in the face of individual differences. By comparison, limited manipulation of the experimental variable can lead us astray. When trying to understand why an effect obtained in one study is not replicated in another, it would be prudent to start by comparing the range of the experimental variable in the two studies.
Overlooked Variables
Not all experimental variables can be manipulated parametrically, and not every replication failure is attributable to a restricted range in the variable of interest. Sometimes a relevant variable goes unrecognized. The next example is such a case.
Figure 3 shows representative results from two experiments concerned with the effects of the magnitude of a food reinforcer on the pause in responding after the reinforcer. The experiments used different operations to manipulate magnitude: Powell (1969) varied the duration of pigeons’ access to grain to reinforce key-pecking whereas Lowe, Davey, and Harzem (1974) varied the concentration of sweetened condensed milk to reinforce rats’ lever-pressing. To represent these operations on a common scale, I (somewhat arbitrarily) expressed the magnitudes in each experiment in relation to the lowest magnitude, with the lowest set to a value of 1. By this method, Lowe et al.’s milk concentrations of 10, 30, 50, and 70% became relative magnitudes of 1, 3, 5, and 7, and Powell’s grain durations of 2.5 s and 4.0 s became relative magnitudes of 1 and 1.6.
Fig. 3.
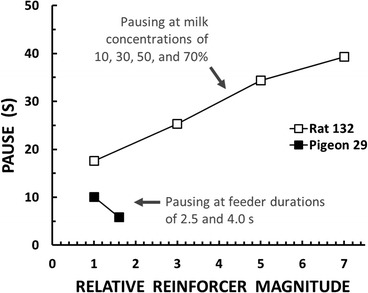
Fixed-ratio pausing after reinforcer delivery as a function of the relative magnitude of the reinforcer. The results for Rat 132 are redrawn from Lowe, Davey, and Harzem’s (1974) Figure 3 (p. 558). The results for Pigeon 29 are redrawn from the FR-40 condition in Powell’s (1969) Figure 2 (p. 607).
In Powell’s (1969) experiment, the two reinforcer magnitudes were arranged on alternate days. Each magnitude was correlated with a distinctive color on the pigeon’s response key. As shown in Figure 3, pausing was inversely related to magnitude: Pauses were shorter in the condition with the relatively rich reinforcer. Lowe et al. (1974) trained rats using a 30% milk concentration. After responding stabilized, they conducted test sessions in which the reinforcer concentration was varied unpredictably across blocks of ratios. In striking contrast with Powell’s results, pausing was directly related to magnitude: Pauses were longer in the conditions with relatively rich reinforcers.
The results of the two experiments are opposite of one another. Which one is correct? If these results had been obtained in a group study that relied on tests of statistical significance, one might suspect that either (or both) could be a false result supported, erroneously, by the aforementioned practice of p-hacking. But both experiments involved intensive analysis of individual subjects, reversals of experimental conditions, and successful between-subject replications (for brevity, these features of the research are not depicted in my selective summary). In addition, Lowe et al.’s (1974) experiment using an FR schedule was complemented with two additional experiments, one using a fixed-interval schedule and the other using a tandem FR-fixed-interval schedule. The direct relation between magnitude and pausing was replicated in these additional experiments. In light of the methodological rigor of both studies, both sets of results must be accepted as correct. And now the fun begins, for we have a mystery to solve: What is responsible for flipping the effect of magnitude from one study to the next?
There are some obvious differences between the two experiments: different species (pigeons v. rats), response topographies (pecks v. presses), ranges of magnitude (two relatively close values v. four widely space values), and ways in which the subjects contacted reinforcer magnitude (as time passed with continued access to food v. different degrees of sweetness detected at the first lick). After some exploration of these differences, my colleagues and I focused on the temporal locus of pausing and the stimuli in this locus (Perone, Perone, & Baron, 1987). We figured that pausing occurs in the transition from one ratio to the next: after the reinforcer from the past ratio has been consumed and in the presence of stimuli correlated with the upcoming ratio and reinforcer. Contradictory results may arise from differences in the degree to which these two factors can contribute to pausing. In Lowe et al.’s (1974) experiment, no stimuli were correlated with the upcoming reinforcer magnitude, so only the past reinforcer could exert control. By comparison, in Powell’s (1969) experiment, key colors were correlated with the upcoming magnitudes and may have developed discriminative stimulus control, in effect providing a way for the upcoming reinforcer to control pausing.
Karen Courtney and I trained pigeons on compound schedules that juxtaposed ratios ending in small and large reinforcers (durations of access to grain), and measured pausing as a function of both the past and upcoming reinforcer magnitudes (Perone & Courtney, 1992). In some conditions, the response key was lit white throughout the session, and so no stimuli were correlated with the upcoming magnitude. In these conditions, in which only the past reinforcer could conceivably exert control, we replicated Lowe et al.’s (1974) results: Pausing was directly related to the past reinforcer magnitude, with longer pauses after the larger magnitude.
In the condition of present interest, different key colors signaled the upcoming reinforcer magnitude. With these stimuli added to the procedure, both the past and upcoming reinforcers have the potential to affect pausing. Representative results from one of our pigeons are shown in Figure 4. In the condition shown here, some ratios ended in 1-s access to grain and others ended in 7-s access. These lean and rich ratios, each accompanied by a distinctive key color, alternated irregularly. Our arrangement constituted a factorial design with two experimental variables (past magnitude, upcoming magnitude) and two levels of each variable (1-s, 7-s). The left panel of Figure 4 shows the main effects of the experimental variables. To assess the effect of the past reinforcer magnitude, pauses that followed the 1-s reinforcer are contrasted with pauses that followed the 7-s reinforcer (collapsing across – i.e., disregarding – the levels of the upcoming reinforcer magnitude). As in Lowe et al.’s (1974) experiment, pausing is directly related to the past magnitude (white squares). The effect of the upcoming reinforcer magnitude is assessed in like manner: Pauses that preceded the 1-s reinforcer are contrasted with pauses that preceded the 7-s reinforcer (collapsing across levels of the past magnitude). Now we see the opposite effect: As in Powell’s (1969) experiment, pausing is inversely related to reinforcer magnitude (black squares).
Fig. 4.
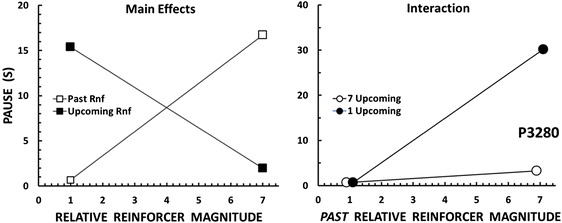
Left panel: Fixed-ratio pausing by a pigeon in relation to the relative magnitude of the past reinforcer (collapsing across the levels of the upcoming reinforcer magnitude) and pausing in relation to the relative magnitude of the upcoming reinforcer (collapsing across the levels of the past reinforcer magnitude). Right panel: Fixed-ratio pausing in the same pigeon and same condition, expressed as a joint function of the past and upcoming reinforcer magnitudes. The results are redrawn from the “Mult 1/7” condition in Perone and Courtney’s (1992) Figure 3 (p. 40).
At steady-state, these main effects of the past and upcoming reinforcer magnitudes were observed in every session. We were successful in replicating diametrically opposed results – within the same individual subject and within the same session. I think this is strong evidence that we identified an important overlooked variable. The right panel of Figure 4 adds something new to the picture. Here pausing is separated into the four types of transitions between the lean and rich ratios (e.g., after a lean ratio and before another lean ratio, after a lean ratio and before a rich ratio, etc.). The panel shows an interaction between the past and upcoming reinforcer magnitudes, that is, it shows that the effect of the past magnitude depends on the upcoming magnitude. When the upcoming reinforcer is 7-s (white circles), the past reinforcer has little effect: Pauses are short after both the 1-s and 7-s reinforcers. When the upcoming reinforcer is 1-s (black circles), however, the past reinforcer exerts a considerable effect: Pauses are short after the 1-s reinforcer, but long after the 7-s reinforcer. Put another way, pausing is most extended in the discriminable transition from a relatively rich ratio (ending in the 7-s reinforcer) to a relatively lean ratio (1-s reinforcer). The results in Figure 4 were replicated across the pigeons in the Perone and Courtney (1992) study. Later experiments replicated the results with different kinds of reinforcers and a variety of species besides pigeons, including rats, monkeys, and humans (e.g., Williams, Saunders, & Perone, 2011). And applied research suggests that transitions from rich to lean reinforcement contexts are implicated in maladaptive behavior of clinical significance (e.g., Castillo et al., 2018).
In this example, accepting the validity of contradictory results made it worthwhile to search for the hidden basis for the contradiction. Other than systematic experimental analysis, is there a better way to address replication failures? In some branches of the behavioral and social sciences, contradictory results would be addressed by way of meta-analysis. In this procedure, the results of various published studies are aggregated and an effect size is estimated. The aggregation may include contradictory studies as well as studies of uneven methodological rigor. It should not be surprising that meta-analysis has its critics. According to Nelson et al. (2018), for example, “meta-analytic thinking not only fails to solve the problems of p-hacking, reporting errors, and fraud, it dramatically exacerbates them” (p. 17). From the present perspective that prioritizes experimental analysis as a means of addressing replication failures, the fundamental problem with meta-analysis is that it obscures replication failures rather than face them squarely and resolve them.4
Reconciling Discrepancies Between Research with Animals and Humans
Behavior analysis has its origins in laboratory research with animals, and in that context effective methods were developed for arranging contingencies and measuring behavior. Efforts to extend the concepts, principles, and methods of the animal laboratory to experiments with humans have an uneven track record (e.g., Baron, Perone, & Galizio, 1991). Especially interesting is the process of conditioned reinforcement – the strengthening of behavior by stimuli whose reinforcing function is not innate but rather derives from some contemporary or historical association with a previously established reinforcer. As Dinsmoor (1983) noted, conditioned reinforcement is “a necessary bridge if principles derived from laboratory studies with innately effective stimuli like food or shock are to be applied to human behavior in a natural setting, in which most of the presumed reinforcers are not innate” (p. 695).
Dinsmoor and his students (Mulvaney, Dinsmoor, Jwaideh, & Hughes, 1974) developed an elegant procedure to compare the conditioned effects of two kinds of stimuli: one positively correlated with an established reinforcer (such a stimulus is called an “S+”) and one negatively correlated with the reinforcer (“S-”). Their pigeons had concurrent access to three response keys. Pecks on the center key were maintained on a compound schedule with two components that alternated irregularly. In one component was a variable-interval (VI) schedule of food reinforcement; in the other was extinction (EXT). Pecks on the two side keys allowed the pigeons to observe brief displays of stimuli correlated with the VI or EXT schedule currently underway on the center key. In operational terms, pecking the observing keys could change the color of the keys. In the condition of present interest, pecks on one observing key intermittently produced the color serving as S+ (if the VI was underway on the center key) and the color serving as S- (if EXT was underway). Pecks on the other observing key could produce only S+ (if the VI was underway). Responding was maintained on both observing keys, but the rates were lower on the key that produced both S+ and S- than on the key that produced only S+, and this difference was maintained when the roles of the keys were interchanged. These results led Mulvaney et al. to conclude that S+ functioned as a conditioned reinforcer whereas S- functioned as a conditioned punisher (because S- decreased the probability of the response that produced it). Their results and conclusions are in line with Pavlovian accounts of conditioned reinforcement.
Alan Baron and I attempted to replicate Mulvaney et al.’s (1974) experiment with human subjects (Perone & Baron, 1980). The procedure closely followed Mulvaney et al.’s precedent, except that our main reinforcer was money. Yet when our subjects had concurrent access to an observing key that intermittently produced S+ and S- and a key that produced only S+, they preferred S+ and S-. In line with Mulvaney et al., S+ functioned as a conditioned reinforcer. In contrast with Mulvaney et al., S- also functioned as a conditioned reinforcer, not a punisher.
The discrepancy is illustrated in Figure 5. The results are shown as the relative rate of responding on the observing key that produced S- as well as S+, collapsing across reversals and replications. Mulvaney et al.’s (1974) two pigeons (designated as P1 and P2 in the figure) had relative rates well below the indifference point (dashed line), indicating that S- suppressed responding. Of our six human subjects, two had relative rates near the indifference point (H3 and H6), suggesting that adding S- as a consequence of observing neither increased nor decreased the reinforcement provided by S+ alone. The relative rates of the other four human subjects were well above the indifference point, indicating that S- (as well as S+) functioned as a conditioned reinforcer. Whereas Mulvaney et al.’s results are in accord with Pavlovian conceptions of conditioned reinforcement, ours are not.
Fig. 5.
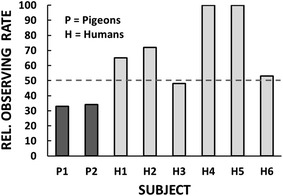
Relative rates of observing (response rates on the key that produced S+ and S- divided by the sum of response rates on the key that produced S+ and S- plus response rates on the key that produced S+ only). Values below the dashed line represent preference for S+ only; values above the dashed line represent preference for S+ and S-. Results from the pigeons are redrawn from Mulvaney, Jwaideh, Dinsmoor, and Hughes’s (1974) Figures 2 and 3 (pp. 41–42). Results from the humans are drawn from data in Perone and Baron’s (1980) Table 1 (p. 246).
To reconcile the contradiction, Fantino and Case (1983) hypothesized that our S- became a conditioned reinforcer because it was paired with relief from an effortful response requirement. In our experiment, the response to earn money was pulling a plunger with 22 N of force whereas the responses to observe S+ and S- were key presses requiring less than 1 N. If plunger pulling was aversive, then the relief provided during the EXT component could have been reinforcing. Because S- was correlated with the EXT component, it could have come to function as a conditioned reinforcer (despite its negative correlation with money).
Fantino and Case (1983) designed an experiment to eliminate any possibility that relief from effortful responding could affect the function of the discriminative stimuli. In one component of a compound schedule, a variable-time (VT) schedule occasionally delivered points (backed by money) independently of responding. In the other, points were never delivered (EXT). Two observing levers were available. Pressing one of the levers occasionally produced brief displays of S- if the EXT component was underway, but nothing if the VT component was underway. Pressing the other lever produced a stimulus that was uncorrelated with either component, and thus it was equally likely to be produced during the VT component as during the EXT component.
Fantino and Case’s (1983) results are summarized in the first cluster of bars in Figure 6. Because the figure is designed for comparisons among four experiments, to conserve space I have taken the liberty of averaging the results across the subjects (individual data are reported in the source publications). The figure shows the mean response rates (of eight students) to observe S- (gray bar) and the uncorrelated stimulus, designated as “S1” (white bar), as well as the relative rate of observing S- (black bar). The students preferred S1, a stimulus uncorrelated with the schedule components (but in whose presence reinforcement did occur occasionally) over S- (in whose presence reinforcement never occurred). This result casts doubt on the reinforcing function of S- reported by Perone and Baron (1980). A closer look, however, suggests that Fantino and Case’s experiment may raise more questions than it answers. I am aware of no account of conditioned reinforcement that would predict reinforcement by an uncorrelated stimulus. Indeed, even Fantino’s (1977) own delay-reduction account holds that an uncorrelated stimulus should be neutral.
Fig. 6.
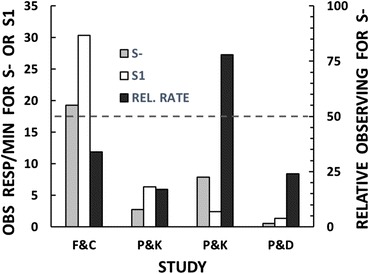
Observing behavior that produces S- or S1 in four different experiments. Absolute rates of observing are scaled on the left vertical axis. Relative rates of observing are scaled on the right vertical axis (response rates on the key that produced S- divided by the sum of response rates on the key that produced S- plus response rates on the key that produced S1). The dashed line applies to the relative rates (black bars) only: Values below the dashed line represent preference for S1; values above it represent preference for S-. The results are means across all subjects in the relevant conditions. “F&C” results are redrawn from Fantino and Case’s Table 1 (p. 197). “P&K” results are redrawn from Perone and Kaminski’s (1992) Table 2 (p. 565). The first P&K cluster of bars is based on data from Subjects F1, F2, F3, and M3 (“After” phase in the table). The second cluster is based on data from Subjects F6, F7, and F8. The “P&D” results are from an unpublished study.
Barbara Kaminski and I thought that Fantino and Case’s (1983) results might reflect control by the instructions they gave their subjects rather than conditioned reinforcement. Their subjects were not directly exposed to the relations between the stimuli and points before the observing tests; instead, they were told: “In this experiment you have the chance to occasionally receive points which are worth 10 cents each to you at the end of today's session. Points are more likely during certain periods than during others as you will soon see for yourself.” About the observing responses, the subjects were told that “In front of you are two levers and some lights. The white light will normally be on. You can occasionally cause the blue or red lights to turn on by pressing the levers.” About the uncorrelated S1, the subjects were told that “when the blue light is on, some of the time points are twice as likely as normal. However, at other times when the blue light is on, no points will be earned.” About S-, the subjects were told that “no points will be earned when the red light is on.” (All of the quoted instructions are from p. 196 of the Fantino and Case article.)
Kaminski and I were concerned that these instructions misled the subjects to believe that by pressing the levers they could affect the likelihood of receiving the points. It is plausible that the instructions functioned as mands to produce the uncorrelated S1 in whose presence points might be presented rather than S- in which points could never be “earned.” Although the points were delivered independently of the subjects’ behavior and the color of the lights did not change the likelihood of point delivery, the subjects were told that the likelihood of points differed depending on the color of the light, and that by pressing the observing levers they could change the color of the light. Importantly, the subjects were not told about the likelihood of points in the presence of the white light, even though the white light was programmed to be functionally equivalent to the blue (S1) light: In the presence of either the white or blue light, the VT and EXT components were equally likely to be underway.
To assess the role of the instructions, Kaminski and I (Perone & Kaminski, 1992) combined elements of Perone and Baron’s (1980) procedure with elements of Fantino and Case’s (1983) procedure. Each of our subjects pressed a key for monetary reinforcers (described to the subjects as “scores”) on a compound schedule with alternating VI and EXT components. At the same time, the subject could press observing keys to produce S- correlated with EXT or an uncorrelated S1. The stimuli, however, were not colored lights. Instead, a computer screen displayed descriptive messages based on Fantino and Case’s instructions. The S1 message was “Some of this time scores are TWICE AS LIKELY as normal, and some of this time NO SCORES can be earned.” The S- message was “At this time NO SCORES can be earned.” The results, averaged across four subjects, are shown in the second cluster of bars in Figure 6. They are similar to Fantino and Case’s results in that our subjects and theirs preferred S1 over S-.
In a second experiment, Kaminski and I replaced the descriptive verbal stimuli with arbitrary verbal stimuli – that is, stimuli that had no a priori relation with the VI and EXT schedule components. The uncorrelated S1 message was “The Current Status of the Program is: either A or B.” The S- message was “The Current Status of the Program is: B.” The results, averaged across three subjects, are shown in the third cluster of bars in Figure 6. In this experiment, the subjects preferred S- over S1. These results are consistent with our first experiment in this series (Perone & Baron, 1980) showing that S- functioned as a reinforcer.
It is important to recognize that Kaminski and I were able to produce results consistent with those of Fantino and Case (1983) and opposite results consistent with those of Perone and Baron (1980) simply by changing the nature of the verbal stimuli. When the stimuli mimicked Fantino and Case’s potentially misleading instructions, we replicated Fantino and Case’s results showing that the uncorrelated S1, but not S-, functioned as a reinforcer. When the stimulus messages were arbitrary, just as Perone and Baron’s colored lights were arbitrary, we replicated Perone and Baron’s finding that S- functioned as a reinforcer. Our success in replicating these contradictory results is strong evidence that Fantino and Case’s instructions were responsible for their failure to replicate Perone and Baron’s experiment.
At this point we appear to have resolved the contradiction between the experiments by Fantino and Case (1983) and Perone and Baron (1980). We have not, however, resolved the contradiction between Perone and Baron and Mulvaney et al. (1974). The question remains: Why was S- a conditioned reinforcer in Perone and Baron’s experiment but a conditioned punisher in Mulvaney et al.’s experiment?
Recall Fantino and Case’s (1983) argument that, when the monetary reinforcers are contingent on responding, an EXT component provides relief from response effort and the S- paired with such relief may become a conditioned reinforcer. Kaminski and I had sought to minimize response effort by using a low-force response key on the monetary schedule (Perone & Kaminski, 1992). This drastically reduced the response force from that required in the Perone and Baron (1980) experiment, from 22 N to 1 N. Still, we had not eliminated effort and so the EXT component still provided some relief.
In an unpublished experiment, Wendy Donlin and I addressed this issue not by eliminating response effort, but by equating it across the VI and EXT components of a compound schedule of monetary reinforcement. Each of our subjects was asked to imagine that they were monitoring a radar screen to distinguish between ally space ships and enemy ships. The ships were represented by asterisks that briefly appeared on the screen at short, irregular intervals. The subject’s task was to click the asterisk with a computer mouse, at which point the asterisk was replaced with an “A” or an “E” before disappearing. The “A” represented an ally and the “E” an enemy. The subject was paid for each enemy they detected. Responding in this fashion occasionally detected enemies – produced monetary reinforcers – in the VI component. In the EXT component, only allies were detected and so no reinforcers were delivered.
Note that the amount of responding was tied to the rate at which the asterisks appeared, and the rate was the same in the VI and EXT components. To ensure complete control of response rates, Donlin and I added a punishment contingency: Money was deducted from the subject’s earnings for each failure to click an asterisk. Each subject quickly learned to click every asterisk. With responding equalized in this fashion, the EXT component provided no relief from responding.
Following Fantino and Case’s (1983) precedent, we assessed the reinforcing functions of S- and an uncorrelated S1. The subject could click on-screen observing buttons to obtain reports from two concurrently available “scouts” (operationally, the reports were changes in the color of the radar screen’s frame). In the condition of interest, one of the scouting reports was uncorrelated with the VI and EXT components; this report served as S1. The other scouting report was correlated with the EXT component; it served as S-. The results, averaged across four subjects, are shown in the last cluster of bars in Figure 6. In line with Fantino and Case’s experiment, the relative observing rate (black bar) shows a strong preference for S1. More interesting, I think, are the absolute rates of observing: Responding was barely maintained by either S1 (white bar) or S- (gray bar). This aligns with Pavlovian conceptions of conditioned reinforcement – including Fantino (1977) – which predict no conditioned reinforcing value for stimuli uncorrelated or negatively correlated with an established reinforcer. Note that Pavlovian accounts go further by predicting a punitive function for negatively correlated stimuli, but our experiment was not designed to test this.
We started this journey by trying to replicate with humans an experiment with pigeons (Mulvaney et al., 1974) that demonstrated the punitive function of an S- (dark bars in Figure 5). We failed in our initial attempt (Perone & Baron, 1980) in which S- was an arbitrary stimulus (a colored light) that functioned not as a punisher but as a reinforcer (light bars in Figure 5). Our initial results were not anomalous. We (Perone & Kaminski, 1992) successfully replicated them with another arbitrary S-, a verbal message (“The status of the program is: B”) (third cluster in Figure 6). Fantino and Case (1983) failed to replicate our results (first cluster in Figure 6), but we were undeterred. We attributed the failure to the instructions they gave their subjects and, sure enough, when we used those instructions as stimuli, we replicated their results (second cluster in Figure 6). Fantino and Case suggested that S- might function as a conditioned reinforcer because of its association with an EXT component in which the subject is relieved of the need to respond for monetary reinforcement. We eliminated this possibility with a procedure that required the subject to respond in the EXT component at same rate as in the VI component. In line with Fantino and Case’s suggestion, without an association with relief from responding, S- lost its reinforcing function (fourth cluster in Figure 6). This brings us much closer to replicating the Mulvaney et al. experiment that started all of this. Our last results are consistent with Mulvaney et al.’s even though our experiment cannot distinguish between an S- that fails as a reinforcer versus an S- that punishes. Despite this limitation, substantial progress has been made, and the circle is almost closed.
Concluding Remarks
Replication is an essential feature of scientific research, and it has been woven into the fabric of behavior analysis since its origins in Skinner’s laboratory. Experiments in the Skinnerian tradition incorporate multiple forms of replication: To establish the validity of a finding, the investigator must show that the behavior of an individual is consistent over time within an experimental condition, that the behavior changes across conditions, and that these changes can be reproduced – and then the whole pattern must be shown in additional individuals. These high standards of within- and between- subject replication protect behavior analysis from the publication of false positive findings. When a properly designed and executed experiment fails to replicate a previously published finding, the outcome is both humbling and exciting. It is humbling because it exposes flaws in our understanding of the phenomenon under study. Perhaps we failed to recognize the boundary conditions of the phenomenon, to identify all of the relevant variables, or to bring the variables under sufficient control. It is exciting because it presents a new scientific challenge. We accept the contradictory findings as valid and pursue an experimental analysis of the possible reasons. In this way, we resolve the contradiction and advance our science.
Orestes “Minnie” Miñoso [1925–2015], the beloved All-Star infielder for the New York Cubans, Cleveland Indians, and Chicago White Sox, was fond of saying that “Baseball’s been very, very good to me” (Weinberg & Cohen, 2014). Replication failures in behavior analysis have been very, very good to me. Trying to understand and resolve them has guided much of my research program, and I have had a great time in the process. I love replication failures.
Compliance with Ethical Standards
Conflict of Interest
The author declares that he has no conflict of interest.
Ethical Standards
This paper does not report original empirical research, but rather reviews previous work, almost all of it published in peer-reviewed journals. The research in which I directly participated was reviewed and approved by the responsible committee (IACUC or IRB).
Footnotes
At this early stage of his career, Skinner was not averse to comparisons between experimental groups, but in his work they were rare. By my count, about 10% of the figures in The Behavior of Organisms report group comparisons. For the record, they are Figures 18, 19, 47, 48, 70, 75, 76, 79, 98, 138, 139, 142, 143, 146, and 147.
Many authors have described in detail how replication is incorporated into the experimental analysis of individual behavior (e.g., Baron & Perone, 1998; Johnston & Pennypacker, 2009; Perone, 1991; Perone & Hursh, 2013; and of course, Sidman, 1960). Barlow and colleagues have called attention to the importance of replication in the analysis of clinical interventions (Barlow, Hayes, & Nelson, 1984; Barlow, Nock, & Hersen, 2009).
After the FR-160 condition, Powell conducted a series of conditions in which the ratio size was progressively lowered. The reversal was successful: Pausing of all three pigeons was progressively reduced.
References
- Anderson DR, Burnham KP, Thompson WL. Null hypothesis testing: Problems, prevalence, and an alternative. Journal of Wildlife Management. 2000;64:912–923. doi: 10.2307/3803199. [DOI] [Google Scholar]
- Baker, M. (2015). Over half of psychology studies fail reproducibility test. Retrieved from Nature News, https://www.nature.com/news/over-half-of-psychology-studies-fail-reproducibility-test-1.18248.
- Barlow DH, Hayes SC, Nelson RO. The scientist practitioner: Research and accountability in clinical and educational settings. New York: Pergamon Press; 1984. [Google Scholar]
- Barlow DH, Nock MK, Hersen M. Single case experimental designs: Strategies for studying behavior change. 3. New York: Pearson; 2009. [Google Scholar]
- Baron A, Perone M. Experimental design and analysis in the laboratory study of human operant behavior. In: Lattal KA, Perone M, editors. Handbook of research methods in human operant behavior. New York: Plenum; 1998. pp. 45–91. [Google Scholar]
- Baron A, Perone M, Galizio M. The experimental analysis of human behavior. Indispensable, ancillary, or irrelevant? The Behavior Analyst. 1991;14:145–155. doi: 10.1007/BF03392565. [DOI] [PMC free article] [PubMed] [Google Scholar]
- Castillo MI, Clark DR, Schaller EA, Donaldson JM, DeLeon IG, Kahng S. Descriptive assessment of problem behavior during transitions of children with intellectual and developmental disabilities. Journal of Applied Behavior Analysis. 2018;51:99–117. doi: 10.1002/jaba.430. [DOI] [PubMed] [Google Scholar]
- Cohen J. The earth is round (p < .05) American Psychologist. 1994;49:997–1003. doi: 10.1037/0003-066X.49.12.997. [DOI] [Google Scholar]
- Derenne A, Baron A. Human sensitivity to reinforcement: A comment on Kollins, Newland, and Critchfield’s (1997) quantitative literature review. The Behavior Analyst. 1999;22:35–41. doi: 10.1007/BF03391976. [DOI] [PMC free article] [PubMed] [Google Scholar]
- Derenne A, Baron A. Quantitative summaries of single-subject studies: What do group comparisons tell us about individual performances? The Behavior Analyst. 2000;23:101–106. doi: 10.1007/BF03392004. [DOI] [PMC free article] [PubMed] [Google Scholar]
- Dinsmoor JA. Observing and conditioned reinforcement. Behavioral and Brain Sciences. 1983;6:693–704. doi: 10.1017/S0140525X00017969. [DOI] [Google Scholar]
- Fantino E. Conditioned reinforcement: Choice and information. In: Honig WK, Staddon JER, editors. Handbook of operant behavior. Englewood Cliffs: Prentice-Hall; 1977. pp. 313–339. [Google Scholar]
- Fantino E, Case DA. Human observing: Maintained by stimuli correlated with reinforcement but not extinction. Journal of the Experimental Analysis of Behavior. 1983;40:193–220. doi: 10.1901/jeab.1983.40-193. [DOI] [PMC free article] [PubMed] [Google Scholar]
- Ferster CB, Skinner BF. Schedules of reinforcement. New York: Appleton-Century-Crofts; 1957. [Google Scholar]
- Johnston JM, Pennypacker HS. Strategies and tactics of behavioral research. 3. New York: Routledge; 2009. [Google Scholar]
- Kline RB. Beyond significance testing. Washington, DC: American Psychological Association; 2004. [Google Scholar]
- Kollins, S. H., Newland, M. C., &. Critchfield, T. S. (1997). Human sensitivity to reinforcement in operant choice: How much do consequences matter? Psychonomic Bulletin & Review, 4, 208–220. Erratum: Psychonomic Bulletin & Review, 4, 431. 10.3758/BF03209395 [DOI] [PubMed]
- Kollins SH, Newland MC, Critchfield TS. Quantitative integration of single-subject studies: Methods and misinterpretations. The Behavior Analyst. 1999;22:149–157. doi: 10.1007/BF03391992. [DOI] [PMC free article] [PubMed] [Google Scholar]
- Kubrick S. Dr. Strangelove or: How I learned to stop worrying and love the bomb [motion picture] United States: Columbia Pictures; 1964. [Google Scholar]
- Lowe CF, Davey GCL, Harzem P. Effects of reinforcement magnitude on interval and ratio schedules. Journal of the Experimental Analysis of Behavior. 1974;22:553–560. doi: 10.1901/jeab.1974.22-553. [DOI] [PMC free article] [PubMed] [Google Scholar]
- Lykken DT. Statistical significance in psychological research. Psychological Bulletin. 1968;70:151–159. doi: 10.1037/h0026141. [DOI] [PubMed] [Google Scholar]
- Minervini V, Branch MN. Tolerance to cocaine’s effects following chronic administration of a dose without detected effects on response rate or pause. Journal of the Experimental Analysis of Behavior. 2013;100:316–332. doi: 10.1002/jeab.47. [DOI] [PMC free article] [PubMed] [Google Scholar]
- Morrison DE, Henkel RE, editors. The significance test controversy. Chicago: Aldine; 1970. [Google Scholar]
- Mulvaney DE, Dinsmoor JA, Jwaideh AR, Hughes LH. Punishment of observing by the negative discriminative stimulus. Journal of the Experimental Analysis of Behavior. 1974;21:37–44. doi: 10.1901/jeab.1974.21-37. [DOI] [PMC free article] [PubMed] [Google Scholar]
- Nelson LD, Simmons J, Simonsohn U. Psychology’s renaissance. Annual Review of Psychology. 2018;69:17.1–17.24. doi: 10.1146/annurev-psych-122216-011836. [DOI] [PubMed] [Google Scholar]
- Open Science Collaboration Estimating the reproducibility of psychological science. Science. 2015;349(6251):aac4716. doi: 10.1126/science.aac4716. [DOI] [PubMed] [Google Scholar]
- Perone M. Experimental design in the analysis of free-operant behavior. In: Iversen IH, Lattal KA, editors. Techniques in the behavioral and neural sciences: Vol. 6. Experimental analysis of behavior, part 1. Amsterdam: Elsevier; 1991. pp. 135–171. [Google Scholar]
- Perone M. Statistical inference in behavior analysis: Experimental control is better. The Behavior Analyst. 1999;22:109–116. doi: 10.1007/BF03391988. [DOI] [PMC free article] [PubMed] [Google Scholar]
- Perone M, Baron A. Reinforcement of human observing behavior by a stimulus correlated with extinction or increased effort. Journal of the Experimental Analysis of Behavior. 1980;34:239–261. doi: 10.1901/jeab.1980.34-239. [DOI] [PMC free article] [PubMed] [Google Scholar]
- Perone M, Courtney K. Fixed-ratio pausing: Joint effects of past reinforcer magnitude and stimuli correlated with upcoming magnitude. Journal of the Experimental Analysis of Behavior. 1992;57:33–46. doi: 10.1901/jeab.1992.57-33. [DOI] [PMC free article] [PubMed] [Google Scholar]
- Perone M, Hursh DE. Single-case experimental designs. In: Madden GJ, editor. APA handbook of behavior analysis: Vol. 1. Methods and principles. Washington, DC: American Psychological Association; 2013. pp. 107–126. [Google Scholar]
- Perone M, Kaminski BJ. Conditioned reinforcement of human observing behavior by descriptive and arbitrary verbal stimuli. Journal of the Experimental Analysis of Behavior. 1992;58:557–575. doi: 10.1901/jeab.1992.58-557. [DOI] [PMC free article] [PubMed] [Google Scholar]
- Perone M, Perone CL, Baron A. Inhibition by reinforcement: Effects of reinforcer magnitude and timeout on fixed-ratio pausing. Psychological Record. 1987;37:227–238. doi: 10.1007/BF03394985. [DOI] [Google Scholar]
- Powell RW. The effect of small sequential changes in fixed-ratio size upon the post-reinforcement pause. Journal of the Experimental Analysis of Behavior. 1968;11:589–593. doi: 10.1901/jeab.1968.11-589. [DOI] [PMC free article] [PubMed] [Google Scholar]
- Powell RW. The effect of reinforcement magnitude upon responding under fixed-ratio schedules. Journal of the Experimental Analysis of Behavior. 1969;12:605–608. doi: 10.1901/jeab.1969.12-605. [DOI] [PMC free article] [PubMed] [Google Scholar]
- Sidman M. Tactics of scientific research. New York: Basic Books; 1960. [Google Scholar]
- Simmons JP, Nelson LD, Simonsohn U. False-positive psychology: Undisclosed flexibility in data collection and analysis allows presenting anything as significant. Psychological Science. 2011;22:1359–1366. doi: 10.1177/0956797611417632. [DOI] [PubMed] [Google Scholar]
- Skinner BF. The behavior of organisms. New York: Appleton-Century-Crofts; 1938. [Google Scholar]
- Smith NC. Replication studies: A neglected aspect of psychological research. American Psychologist. 1970;25:970–975. doi: 10.1037/h0029774. [DOI] [Google Scholar]
- Weinberg, T. & Cohen, J. (2014). Baseball’s been very, very good to me: The Minnie Miñoso story [Video file]. Retrieved from http://www.pbs.org/video/wttw-documentaries-baseballs-been-very-very-good-me-minnie-minoso-story/.
- Williams DC, Saunders KJ, Perone M. Extended pausing by humans on multiple fixed-ratio schedules with varied reinforcer magnitude and response requirements. Journal of the Experimental Analysis of Behavior. 2011;95:203–220. doi: 10.1901/jeab.2011.95-203. [DOI] [PMC free article] [PubMed] [Google Scholar]