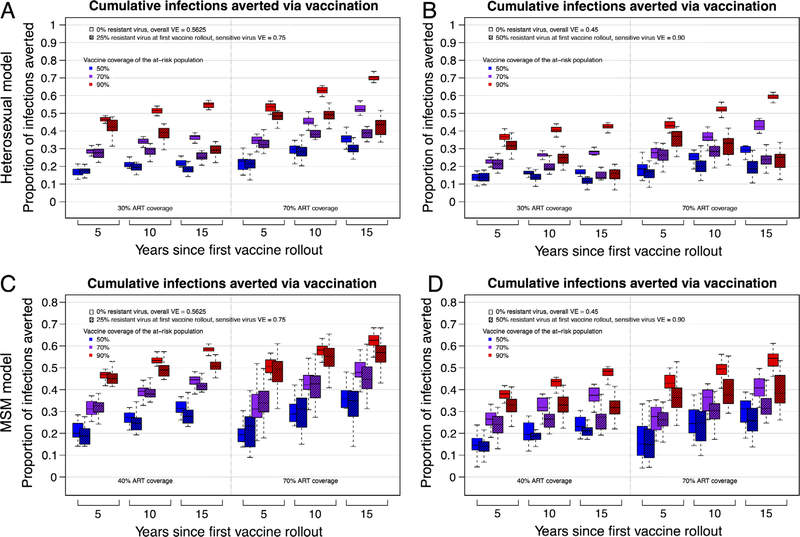
Fig. 3.
The proportion of cumulative HIV infections averted by vaccination. Trends in cumulative infections averted by vaccination (with interquartile ranges) for 20 replicate epidemic simulations from heterosexual (panels A and B) and MSM (panels C and D) HIV epidemic models (comparing epidemic scenarios with and without vaccination programs). Panels A and C depict results from epidemic scenarios with an initial resistant strain (VE = 0) proportion = 0.25 and a sensitive virus VE = 0.75. Panels B and D depict results with initial resistant strain proportion = 0.50 and a sensitive virus VE = 0.90. All solid color boxplots represent epidemic scenarios with a vaccine but without HIV adaptation; the initial overall VE in these scenarios is equal to the overall VE at initial vaccine rollout in the scenarios with HIV adaptation (hashed boxplots, placed immediately to the right of the solid color boxplots). ART coverage was at 30% or 70% for the heterosexual model and 40% or 70% for the MSM model. (See Fig. S1 and Table S5 for equivalent results from heterosexual model scenarios in which a high-risk subgroup is preferentially targeted for vaccination, which leads to substantially decreased overall vaccination coverage but results in similar effects of HIV adaptation on infections averted.)

