Abstract
A photoanthropometric method, which enables an objective description of facial structures, was used to better delineate the craniofacial characteristics of 29 individuals with Williams syndrome (WS; 18 males and 11 females) between the ages of 0 to 10 years, with an average age of 4.0 years. Facial parameters were measured from strict frontal and profile photographic 35-mm slides and compared with other facial measurements from the same face (e.g., palpebral fissure width to bizygomatic diameter). Sixteen photoanthropometric craniofacial indices were developed from 20 measurements (3 from the frontal face, 2 from the eye region, 3 from the nose region, 2 from the mouth region, 4 from the profile face, and 6 from the ear region). Based on our measurements of 29 Williams syndrome individuals, two parameters (e.g. nose length to midface height and palpebral fissure width to bizygomatic diameter) were outside the normal range when compared with photoanthropometric index standards for age established by Stengel-Rutkowski et al. from white control children. Overall, our data supported a high midface height, broad palpebral fissure width, broad interalar distance, short length of back of nose, prominent ears with long narrow conchae, increased chin height, increased inclination of the ears and a narrow bizygomatic diameter in WS patients. These craniofacial parameters (many not previously evaluated in WS patients) may become useful for early detection, and aid in the diagnosis and study of the development of the characteristic face in Williams syndrome subjects.
Keywords: children, craniofacial traits, photoanthropometric variables, Williams syndrome
Williams syndrome (WS) is a multiple congenital anomaly syndrome with an estimated incidence of 1 in 10 000 births and associated with a distinctive face (so-called “elfin facies”) (Preus 1984, Jones 1988, Morris et al. 1988). Cardiovascular disease, particularly supravalvular aortic stenosis or peripheral pulmonary stenosis (Williams et al. 1961, Morris et al. 1988) and hypercalcemia are additional variable clinical findings (Jones & Smith 1975, Jones 1990). The characteristic face of a child with Williams syndrome shows prominent lips with a wide mouth, stellate iridae, strabismus, a broad forehead, periorbital fullness, a short nose with a flattened nasal bridge, epicanthal folds, a long philtrum and prominent cheeks (Jones 1988, Morris et al. 1988, Kotzot et al. 1995). Other common features include short stature, clinodactyly of the fifth digits, mild hallux valgus deformity, a hoarse voice, enamel hypoplasia, renal artery stenosis and urogenital anomalies, hyperacusis and learning impairment (Jones 1988, Kotzot et al. 1995). Rarer features include autism, umbilical hernia, precocious puberty (Scothorn & Butler 1997) and nail hypoplasia. Children with Williams syndrome are frequently described as friendly and loquacious with a “cocktail party personality” (Jones 1988). Recently, patients with Williams syndrome have been reported with a submicroscopic deletion of chromosome 7 using fluorescence in situ hybridization (FISH) and elastin gene probes (Ewart et al. 1993, Lowery et al. 1995, Kotzot et al. 1995).
Materials and methods
The photoanthropometric method used in this study follows the protocol established by Stengel-Rutkowski et al. (1984) and utilized by Butler et al. (1988) in the study of fragile X syndrome and more recently in Prader-Willi syndrome patients (Butler et al. 1995). This methodology enables an objective description of facial structures and allows a comparison of normative standards for age and race. In the current study we analyzed 20 facial parameters including inner canthal distance; palpebral fissure width; bizygomatic diameter; midface height; mouth width; nose length; interalar distance; tragionsubnasal, tragion-ophryon and tragion-chin distances; ear length and width; conchae length and width; nasolabial distance; chin and total face height; ear position; inclination of nasal base and inclination of ear insertion line. Facial parameters were measured to the nearest 0.1 mm with a vernier caliper for frontal and profile facial views of subjects without restraining or supporting the subject’s head, using colored photographic 35-mm slides. The photographs were taken from a distance of over 1.5 m from the subject and projected onto a viewing screen. Several photographic exposures were taken in order to have the best suitable frontal and profile views for analysis.
Twenty-nine Caucasian individuals with WS (18 males and 11 females) were analyzed, with an age range of 0–10 years and an average age of 4.0 years. The diagnosis was confirmed after clinical evaluation and review of medical history by a clinical geneticist. Only patients with classical findings of Williams syndrome (Preus 1984, Jones 1988), particularly those with the typical facies including full lips, broad nasal bridge and tip, anteverted nares, mental deficiency, hoarse voice, congenital heart disease (e.g., supravalvular aortic stenosis), and behavior problems (e.g., loquacious personality), were included in this photoanthropometric study. The diagnosis may be difficult to make in young patients (<2 years of age) with Williams syndrome. Several patients were followed over time in order to establish the diagnosis, and photographs were chosen at an early age. FISH analysis using the elastin probe from chromosome 7 was performed in approximately one-third of the patients, particularly in the younger patients. These patients showed the microdeletion, thus confirming the diagnosis. There appeared to be no differences in the photoanthropometric data between those patients with the chromosome 7 microdeletion and those patients with the clinical diagnosis of Williams syndrome but without FISH analysis.
Facial measurements were compared with other measurements from the face of the same individual and indices developed (e.g., mouth width to bizygomatic diameter). Sixteen indices were developed from the 20 measurements (3 from the frontal face, [total face height, midface height, bizygomatic diameter], 2 from the eye region [inner canthal distance, palpebral fissure width], 3 from the nose region [length of back of nose, inclination of nasal base, interalar distance], 2 from the mouth region (nasolabial distance, mouth width), 4 from the profile face [tragion-ophryon, tragion-subnasal, chin height, tragion-chin], and 6 from the ear region [ear position, inclination of ear insertion, ear length, ear width, conchae length, conchae width]). References used in calculating the ratios of indices in this study were the bizygomatic diameter as a horizontal reference, the midface or total face height as a vertical reference and the tragion-ophryon as a central reference. The measurements were obtained by one observer and repeated measurements were taken by this observer over time with intraobserver variability of less than 10%, which is similar to other reported anthropometric studies (Stengel-Rutkowski et al. 1984, Brandt et al. 1991, Butler & Meaney 1991, Butler et al. 1995). Pearson product moment correlation coefficients with age, chi-square values with Yates’ correction, Z scores, averages and standard deviations were calculated on the photoanthropometric data. Normative data from Stengel-Rutkowski et al. (1984) were used for comparison purposes throughout this study. The coeffcient of variation (i.e., the standard deviation expressed as a percentage of the mean) ranged from 3.5% for tragion-subnasal to tragion-ophryon to 25.5% for ear position to midface height, with the latter index being the only index with a coefficient of variation value greater than 25%. According to the standards of reliability and precision described elsewhere (National Center for Health Statistics 1973, Brandt et al. 1991, Butler et al. 1995), the coeffcient of variation should be less than 25%. Thus, we would conclude that measurement errors did not significantly influence the development of our photoanthropometric indices.
Results and discussion
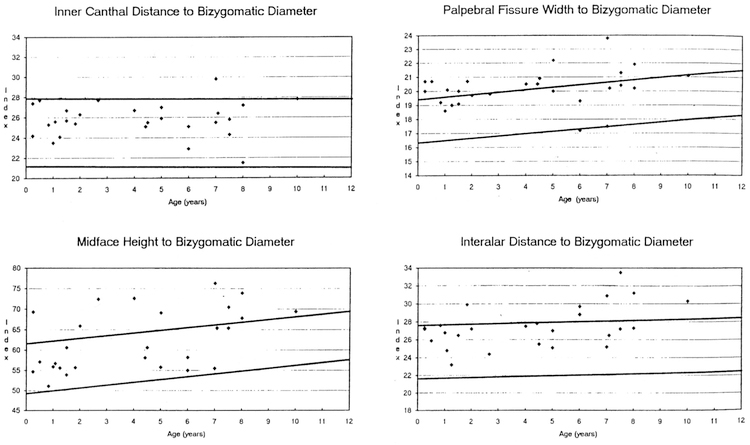
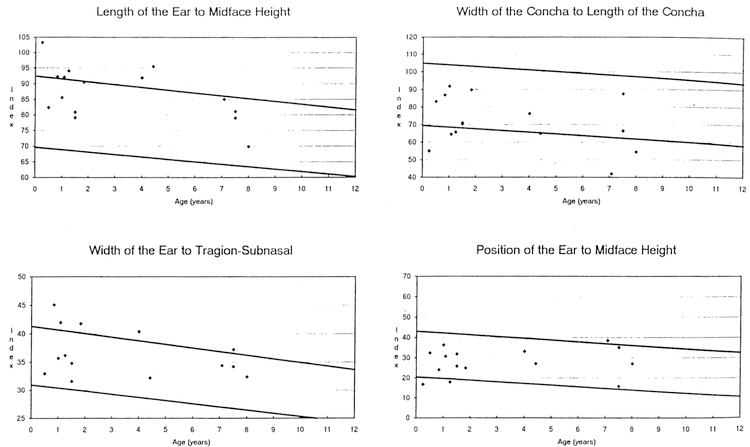
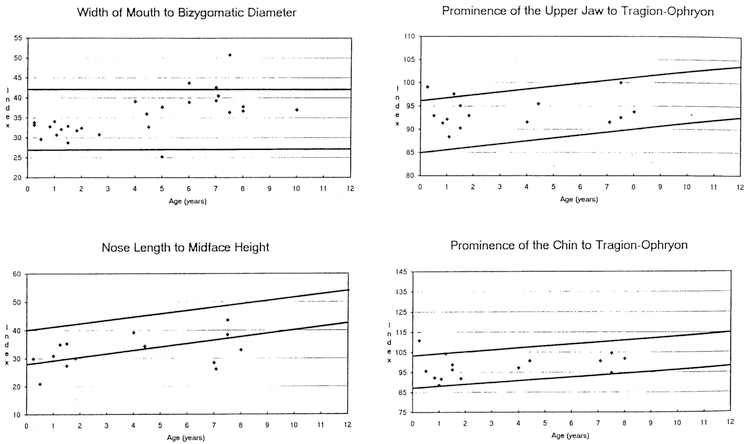
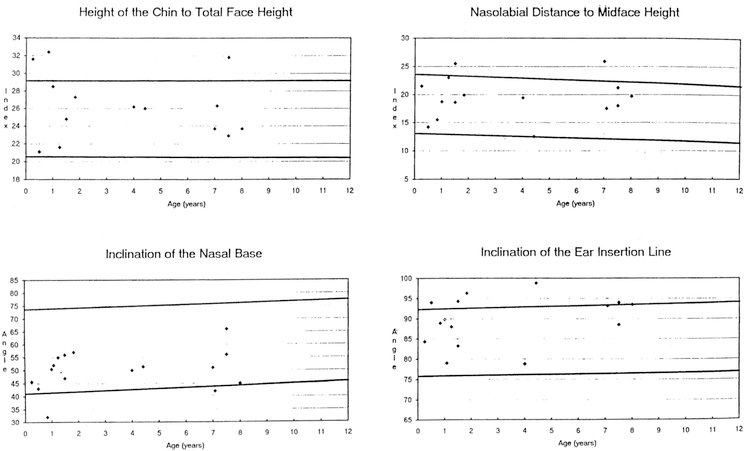
The data from 16 (5 frontals, 11 profiles) craniofacial photoanthropometric indices are shown in Table 1. Based on our measurements of 29 Caucasian WS patients (18 males, 11 females) between the ages of 0–10 years, two Z score mean index measurements were outside the normative range (e.g., the calculated overall •Z scores were –2.45 for nose length to midface height and 2.00 for palpebral fissure width to bizygomatic diameter) when compared with photoanthropometric index standards for age and race established from control children (Stengel-Rutkowski et al. 1984). The following differences were also noted: high midface height (midface height [ophyron-stomion] to bizygomatic diameter [37% of WS patients were greater than or equal to 97th centile], correlation coefficient with age = 0.50 [p <0.01], chi-square =23.23 [p < 0.0011]); large palpebral fissure width (palpebral fissure width to bizygomatic diameter [56% of WS patients were greater than or equal to 97th centile], correlation coefficient with age = 0.25 [p > 0.05], chisquare = 44.05 [p < 0.001]); broad interalar distance (interalar distance to bizygomatic diameter [33% of WS patients were equal to or greater than 97th centile], correlation coefficient with age 0.49 [p <0.01], chi-square= 19.45 [p < 0.001 ]); short length of back of nose (length of the back of the nose [deepest point of the nose root-tip of the nose] to midface height [ophryon-stomion; 43% of WS patients were equal to or less than 3rd centilel, correlation coefficient with age 0.39 [p > 0.05], chisquare = 21.63 [p <0.001]); long ears (ear length to midface height [47% of WS patients were equal to or greater than 97th centile], correlation coemcient with age= –0.54 [p<O.05], chi-square=26.07 [p <0.001]); broad ears (width of ears to tragionsubnasal [36% of WS patients were equal to or greater than 97th centile], correlation coefficient with age= –0.33 [p > 0.05], chi-square= 15.44 [p <0.001]), long narrow conchae (conchae width to conchae length [40% of WS patients were equal to or less than 3rd centile], correlation coefficient with age= –0.36 [p >0.05], chi-square= 19.89 [p <0.001]); increased chin height (height of the chin to total face height [20% of WS patients were equal to or greater than 97th centile], correlation coeffcient with age= –0.01 [p >0.05], chi-square= 4.57 [p < 0.05]); posteriorly rotated ears (inclination of the ear insertion line [47% of WS patients were equal to or greater than 97th centile], correlation coefficient with age = 0.30 [p >0.05], chi-square= 26.07 [p<0.001]). Fig. 1–4 show the photoanthropometric data for the 16 indices grouped by craniofacial regions.
Table 1.
Photoanthropometric data of craniofacial traits in individuals with Williams syndrome (WS)
| Indexa | No. of WS Subjects | Mean | Standard deviation | Overall Z score for WS compared with normative data | % of WS outside normal range |
Chi-square value | Correlation with age for normative groupb | Correlation with age for WS group | |
|---|---|---|---|---|---|---|---|---|---|
| ≥97% | ≤3% | ||||||||
| ICD/BD | 27 | 25.78 | 1.72 | 0.83 | 7.4 | 0 | 0.24 | –0.02 | 0.03 |
| MHF/BD | 27 | 62.31 | 7.44 | 1.34 | 37 | 0 | 23.23*** | 0.30** | 0.50** |
| pFW/BD | 27 | 20.17 | 1.35 | 2.00 | 55.6 | 7.4 | 44.05*** | 0.40*** | 0.25 |
| IAD/BD | 27 | 27.44 | 2.31 | 1.72 | 33.3 | 0 | 19.45*** | 0.06 | 0.49** |
| WM/BD | 27 | 35.46 | 5.30 | 0.98 | 12.5 | 3.7 | 1.57 | 0.07 | 0.63*** |
| NL/MHP | 14 | 32.32 | 5.89 | –2.45 | 0 | 42.9 | 21.63*** | 0.71*** | 0.39 |
| TS/T0 | 15 | 93.68 | 3.25 | 0.56 | 13.3 | 0 | 1.33 | 0.48*** | 0.13 |
| TC/T0 | 15 | 98.01 | 5.96 | –0.26 | 13.3 | 6.7 | 1.33 | 0.52*** | 0.24 |
| EL/MHP | 15 | 86.85 | 8.44 | 1.63 | 46.7 | 0 | 26.07*** | –0.42*** | –0.54* |
| EW/TS | 14 | 36.50 | 4.23 | 1.18 | 35.7 | 0 | 15.44*** | –0.49*** | –0.33 |
| WC/LC | 15 | 71.33 | 14.60 | –1.41 | 0 | 40 | 19.89*** | –0.35*** | –0.36 |
| ND/MHP | 15 | 19.41 | 3.75 | 0.71 | 13.3 | 6.7 | 1.33 | –0.09 | 0.09 |
| CH/TFH | 15 | 26.41 | 4.46 | 0.46 | 20 | 0 | 4.57* | –0.01 | –0.01 |
| INB | 16 | 49.97 | 7.74 | –1.81 | 0 | 12.5 | 1.15 | 0.27** | 0.26 |
| EP/MHP | 15 | 27.83 | 7.09 | –0.02 | 6.7 | 13.3 | 1.33 | –0.42*** | 0.15 |
| IEI | 15 | 89.64 | 6.10 | 0.24 | 46.7 | 0 | 26.07*** | 0.11 | 0.30 |
Explanation of indices: ICD/BD, inner canthal distance to bizygomatic diameter; PPW/BD. palpebral fissure width to bizygomatic diameter; INB, inclination of nasal base: NL/MHP, length of back of nose to midface height (profile); IAD/BD. interalar distance to bizygomatic diameter; TC[TO, prominence of the chin (tragion-tip of chin to tragionophryon); CH[TFH, chin height to total face height; WM/BD. width of mouth to bizygomatic diameter; EL/MHP, ear length to midface height (profile); EW/TS, ear width to tragion-subnasal; WC/LC. width of concha to length of concha: EP/MHP, ear position to midface height (profile); IEI, inclination of ear insertion; MHF/BD, midface height (frontal) to bizygomatic diameter; TS/TO, prominence of upper jaw (tragion-subnasal to tragion-ophryon); ND/MHP, nasolabial distance to midface height (profile).
p <0.05 (2-tailed).
p <0.01 (2-tailed).
p <0.001 (2-tailed).
Fig. 1.
Four photoanthropometric craniofacial indices showing data from Williams syndrome patients representing the inner canthal distance to bizygomatic diameter, midface height to bizygomatic diameter, palpebral fissure width to bizygomatic diameter, and interalar distance to bizygomatic diameter. The solid lines represent the 97th and 3rd centiles for normative data (Stengel-Rutkowski et al. 1984).
Fig. 4.
Four photoanthropometric craniofacial indices showing data from Williams syndrome patients representing ear length to midface height, ear width to tragion-subnasal, conchae width to conchae length, and ear position to midface height. The solid lines represent the 97th and 3rd centiles for normative data (Stengel-Rutkowski et al. 1984).
In comparing correlation coefficient with age between normative and WS data, discrepancies with six indices (interalar distance to bizygomatic diameter, mouth width to bizygomatic diameter, nose length to midface height, tragion-subnasal to tragion-ophryon, tragion-chin to tragion-ophryon, and ear position to midface height) were found. For example, a distinct positive age effect (r = 0.48 [p <0.001]) was reported for tragion-subnasal to tragion-ophryon for the normative data (Stengel-Rutkowski et al. 1984), while the correlation coemcient for our WS data for this index was only 0.13 (p > 0.05). Similarly, the nose length to midface height correlation coemcient was 0.71 (p <0.001) for the normative data and r=0.39 (p>0.05) for our WS data, and the tragion-chin to tragionsubnasal correlation coefficient was 0.52 (p < 0.001 ) for the normative data, whereas it was only 0.24 (p > 0.05) for the WS patients. Conversely, interalar distance to bizygomatic diameter had a significant correlation coefficient for our WS data (r = 0.49 [p <0.01]), while the correlation coeffcient for the normative data was only 0.06 (p > 0.05), and mouth width to bizygomatic diameter correlation coeffcient was 0.63 (p <0.001) for the WS data and r = 0.07 (p>0.05) for the normative data. A distinct negative age effect (r —0.42 [p<0.001]) was observed for ear position to midface height for the normative data, while the correlation coefficient for our WS data for this index was positive (r =0.15 [p >0.05]). The remaining indices showed nearly identical correlations between the normative data and our WS data (e.g., a positive age effect for the inclination of the nasal base for both the normative data [r =0.27 (p <0.01)] and our WS data [r =0.26 (p <0.05)]).
Overall, significant correlations with age were found in our WS patients for four indices (midface height to bizygomatic diameter, interalar distance to bizygomatic diameter, mouth width to bizygomatic diameter, and ear length to midface height), whereas the normative data had significant age correlations for ten measurements (midface height to bizygomatic diameter, palpebral fissure width to bizygomatic diameter, nose length to midface height, tragion-subnasal to tragion-ophryon, tragion-chin to tragion-ophryon, ear length to midface height, ear width to tragion-subnasal, conchae width to conchae length, inclination of nasal base, and ear position to midface height). Correlation and chi-square values for the individual indices for WS and correlation values for the normative group are shown in Table 1.
Our data support a high midface height, broad palpebral fissure width, broad interalar distance, short length of back of nose, prominent ears with long narrow conchae, increased chin height, increased inclination of the ears, and narrow bizygomatic diameter in WS patients. The five measurements that are compared to bizygomatic diameter (inner canthal distance, midface height, palpebral fissure width, interalar distance, and mouth width) all have positive Z scores, indicating larger index values for the WS data than for the normative data reported by Stengel-Rutkowski et al. (1984). This suggests a narrow bizygomatic diameter. However, the values for midface height to bizygomatic diameter (Z score= 1.34), palpebral fissure width to bizygomatic diameter (Z score = 2.00), and interalar distance to bizygomatic diameter (Z score= 1.72) reflect an increase in midface height; palpebral fissure width, and interalar distance.
Though the data indicate an apparent increase in midface height, the Z score for nose length to midface height (–2.45) supports a significantly short nose length in WS patients. Our data also suggest prominent ears (e.g., 47% of our WS patients showed the ear length to midface height index to be greater than or equal to the 97th centile, and 36% of our WS patients showed the ear width to tragion-subnasal index to be greater than or equal to the 97th centile when compared with normative data). In addition, in 40% of WS patients the concha width to concha length index value was less than or equal to the 3rd centile, suggesting a long, narrow concha.
There was no significant difference in the index values between the WS and normative data for mouth width to bizygomatic diameter. There was, however, a difference in age correlation coefficients. The normative group showed a correlation coefficient of 0.07 (p>0.05), while the WS group had a distinct positive correlation with age (r =0.63 [p<0.001]). The average age of the WS patients (4.0 years) could explain the normal values for the mouth width to bizygomatic diameter index identified in our study. As the age of a WS patient increases, the relative width of the mouth appears to increase.
Our photoanthropometric analysis supports the clinical impression of a long philtrum (increased nasolabial distance), a broad nasal bridge (increased inner canthal distance), and a small mandible (decreased tragion-chin distance). The findings of a broad interalar distance, short nose length, broad forehead, narrow bizygomatic diameter, and prominent• ears have been reported elsewhere (Gorlin et al. 1990, Kotzot et al. 1995, Lowery et al. 1995), but the observations of wide palpebral fissures, long, narrow conchae, increased chin height and posteriorly rotated ears are previously unrecognized traits of individuals with WS. These craniofacial parameters (many not previously described in WS patients) may become useful in the early detection of WS patients, although more research is needed to better define the craniofacial structures and features in individuals with WS.
Fig. 2.
Four photoanthropometric craniofacial indices showing data from Williams syndrome patients representing the mouth width to bizygomatic diameter, length of back of nose to midface height, tragion-subnasal to tragion-ophryon, and tragion-tip of chin to tragion-ophryon. The solid lines represent the 97th and 3rd centiles for normative data (Stengel- Rutkowski et al. 1984).
Fig. 3.
Four photoanthropometric craniofacial indices showing data from Williams syndrome patients representing chin height to total face height, inclination of nasal base, nasolabial distance to midface height, and inclination of ear insertion. The solid lines represent the 97th and 3rd centiles for normative data (Stengel-Rutkowski et al. 1984).
Acknowledgements
We thank the Williams syndrome patients who kindly participated in this survey, and we also thank Verna Wyatt for her expert secretarial assistance. This research was partially supported by a grant from the National Institutes of Health (P30-HD15052, M.G.B.).
References
- Brandt JM, Allen GA, Butler MG. Normative standards and patterning of fat and muscle in white and black newborn infants. Dysmorph Clin Genet 1991: 5: 88–96. [PMC free article] [PubMed] [Google Scholar]
- Butler MG, Allen GA, Singh DN, Carpenter NJ, Hall BD. Preliminary communication: photoanthropometric analysis of individuals with fragile X syndrome. Am J Med Genet 1988: 30: 165–168. [DOI] [PMC free article] [PubMed] [Google Scholar]
- Butler MG, Levine GJ, Le JY, Hall BD, Cassidy SB. Photoanthropometric study of craniofacial traits of individuals with Prader-Willi syndrome. Am J Med Genet 1995: 58: 38–45. [DOI] [PMC free article] [PubMed] [Google Scholar]
- Butler MG, Meaney FJ. Standards for selected anthropometric measurements in Prader-Willi syndrome. Pediatrics 1991: 88: 853–860. [PMC free article] [PubMed] [Google Scholar]
- Ewart AK, Morris CA, Atkinson D, Jin W, Sternes K, Spallone P, Stock AD, Leppert M, Keating MT. Hemizygosity at the elastin locus in a development disorder, Williams syndrome. Nat Genet 1993: 5: 11–16. [DOI] [PubMed] [Google Scholar]
- Gorlin RJ, Cohen MM Jr, Levin LS. In: Motulsky AG, Bobrow M, Harper PS, Scriver C, eds. Syndromes of the head and neck, 3rd edn. New York: Oxford University, 1990. [Google Scholar]
- Jones KL. In: Jones KL, ed. Smith’s recognizable patterns of human malformation, 4th edn. Philadelphia: WB Saunders, 1988. [Google Scholar]
- Jones KJ. Williams syndrome: a historical perspective of its evolution, natural history, and etiology. Am J Med Genet (Suppl) 1990: 6: 89–96. [DOI] [PubMed] [Google Scholar]
- Jones KL, Smith PW. The Williams elfin facies syndrome: a new perspective. J Pediatr 1975: 86: 718–723. [DOI] [PubMed] [Google Scholar]
- Kotzot D, Bernasconi F, Breceivic L, Robinson WP, Kiss P, Kosztolanyi G, Lurie IW, Superti-Furga A, Schinzel A. Phenotype of the Williams- Beuren syndrome associated with hemizygosity at the elastin locus. Eur J Pediatr 1995: 154: 477–482. [DOI] [PubMed] [Google Scholar]
- Lowrey MC, Morris CA. Ewart A Brothman LJ, Zhu XL, Leonard CD, Carey JC Keating M, Brothman AR. Strong correlation of elastin deletions, detected by FISH, with Williams syndrome: evaluation of 235 patients. Am J Hum Genet 1995: 57: 49–53. [PMC free article] [PubMed] [Google Scholar]
- Morris CA, Demsey SA. Leonard CO Dilts C Blackburn BL. Natural history of Williams syndrome: physical characteristics. J Pediatr 1988: 1 13: 318–326. [DOI] [PubMed] [Google Scholar]
- National Center for Health Statistics. Selected body measurements of children 6–1 1 years, United States. Vital and health statistics. Series 1 1. No. 123 Washington. DC: US Government Printing Office US Department of Health, Education, and Welfare publication; 1973: 73–1605. [Google Scholar]
- Preus M The Williams syndrome: objective definition and diagnosis. Clin Genet 1984: 25: 422–428. [DOI] [PubMed] [Google Scholar]
- Scothorn DJ, Butler MG. How common is precocious puberty in patients with Williams syndrome? Clin Dysmorphol 1997: 6: 91–93. [PMC free article] [PubMed] [Google Scholar]
- Stengel-Rutkowski S, Schimanek P. Wernheimer A. Anthropometric definition of dysmorphic facial signs. Hum Genet 1984: 67: 272–295. [DOI] [PubMed] [Google Scholar]
- Williams JC, Barratt-Boyes BG. Lowe JB. Supravalvular aortic stenosis. Circulation 1961: 24: 131 1–1318. [DOI] [PubMed] [Google Scholar]


