Abstract
Metabolism has been shown to integrate with epigenetics and transcription to modulate cell fate and function1–3. Beyond meeting bioenergetic and biosynthetic demands to support T-cell differentiation4–8, whether metabolism might control T-cell fate through epigenetic mechanism is unclear. Here through discovery and mechanistic characterization of a small molecule, (aminooxy)-acetic acid (AOA), that reprograms TH17 differentiation toward iTreg cells, we show increased transamination mainly via Got1 leads to elevated 2-hydroxyglutarate (2-HG) level in differentiating TH17 cells. Accumulating 2-HG resulted in hypermethylation of FOXP3 gene locus and inhibited FOXP3 transcription, essential for fate determination towards TH17 cells. Inhibiting conversion of glutamate into alpha-ketoglutaric acid (α-KG) inhibits 2-HG production, reduces methylation of FOXP3 gene locus, and increases FOXP3 expression. This consequently blocks TH17 cell differentiation by antagonizing RORγt function and promotes polarization into iTreg cells. Selective inhibition of Got1 with AOA ameliorated mouse EAE disease in a therapeutic model by regulating TH17/iTreg balance. Targeting a glutamate-dependent metabolic pathway thus represents a novel strategy for developing therapeutics against TH17-mediated autoimmune diseases.
TH17 cells play an important pathogenic role in autoimmune diseases9. Regulatory T cells (Treg) cells restrict TH17 cell function through multiple mechanisms10. The TH17/Treg balance is tightly controlled in vivo to restrict the detrimental effects of TH17 cells10. Despite extensive studies, the mechanisms that modulate the TH17/iTreg differentiation are largely unknown.
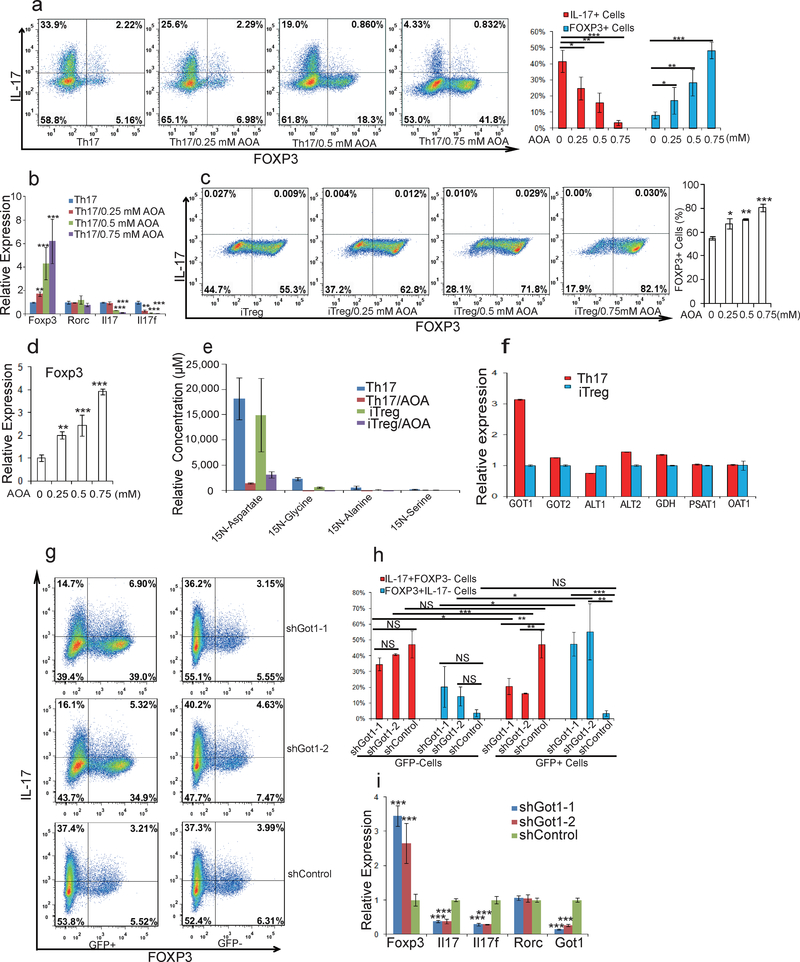
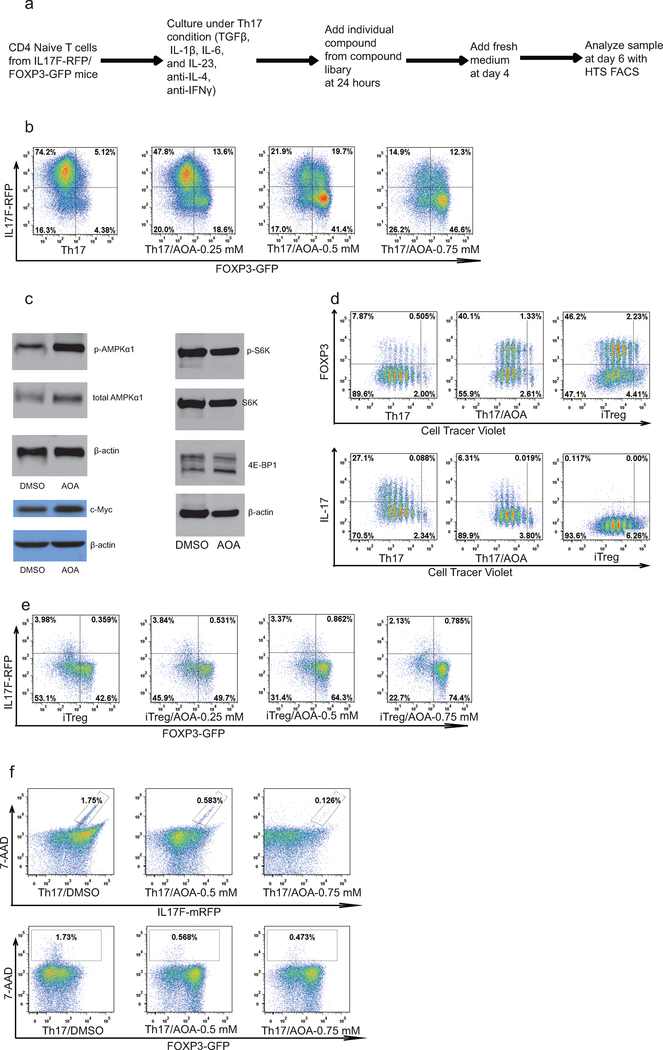
To identify small molecules that reprogram TH17 differentiation toward iTreg cell fate, we screened 10,000 small molecules using CD4+ naïve T cells from IL-17F-RFP/FOXP3-GFP mice cultured under optimal TH17 differentiation conditions (Extended Data Fig1. a) 11. A small molecule, (aminooxy)-acetic acid (AOA), was found to reprogram TH17 induction to iTreg cells in a dose-dependent manner (Fig. 1a and Extended Data Fig. 1b). Notably, AOA treatment increased phosphorylation of AMPKα in TH17 cells, characteristic of Treg cells, without affecting mTOR activity and c-Myc expression (Extended Data Fig. 1c). In addition, AOA treated TH17 cells had a similar slow proliferation rate as iTreg cells (Extended Data Fig 1.d); however, the effect of AOA on cell proliferation did not impair cell survival or the ability of these T cells to differentiate into iTreg cells under TH17 differentiation condition (Fig.1a and b, and Extended Data Fig. 1b, and f). Interestingly, AOA dose-dependently promoted iTreg cell induction even under iTreg conditions (Fig. 1c and Extended Data Fig. 1e), suggesting that AOA may directly regulate FOXP3 expression and the iTreg program. Furthermore, AOA selectively reduced the mRNA level of Il17/Il17f, but not Rorc in TH17 cells and promoted transcription of FOXP3 in TH17 and iTreg cells (Fig. 1b and 1d).
Figure 1.
AOA reprograms TH17 cell differentiation toward iTreg cells by inhibiting Got1. a) AOA reprograms TH17 cell differentiation toward FOXP3+ iTreg T cells. b) mRNA expression in cells from a. c) AOA promotes iTreg cell induction under iTreg condition. d) FOXP3 mRNA expression from cells in c. e) Got1/2 is the major transaminase catalyzing glutamate flux into α-KG. Mean±S.D. of three replicates from a representative experiment was shown. f) Got1 is highly up-regulated under TH17 condition. g) Knockdown of Got1 reduced TH17 cell differentiation and reciprocally increased iTreg cell differentiation. h) Statistics of cell population from f. i) the effect of knockdown of Got1 on gene expression. Representative flow data from five (a) or three (c, and g) independent experiments were shown. Data are presented as mean±S.D. of five (a, right panel), or three (right panel of c, and h) independent experiments. Mean±S.D. of 3 replicates from a representative experiment of three independent experiments was shown in b, d and i. NS=non- significant; *P<0.05; **P<0.01; ***P<0.001 by Student`s t-test.
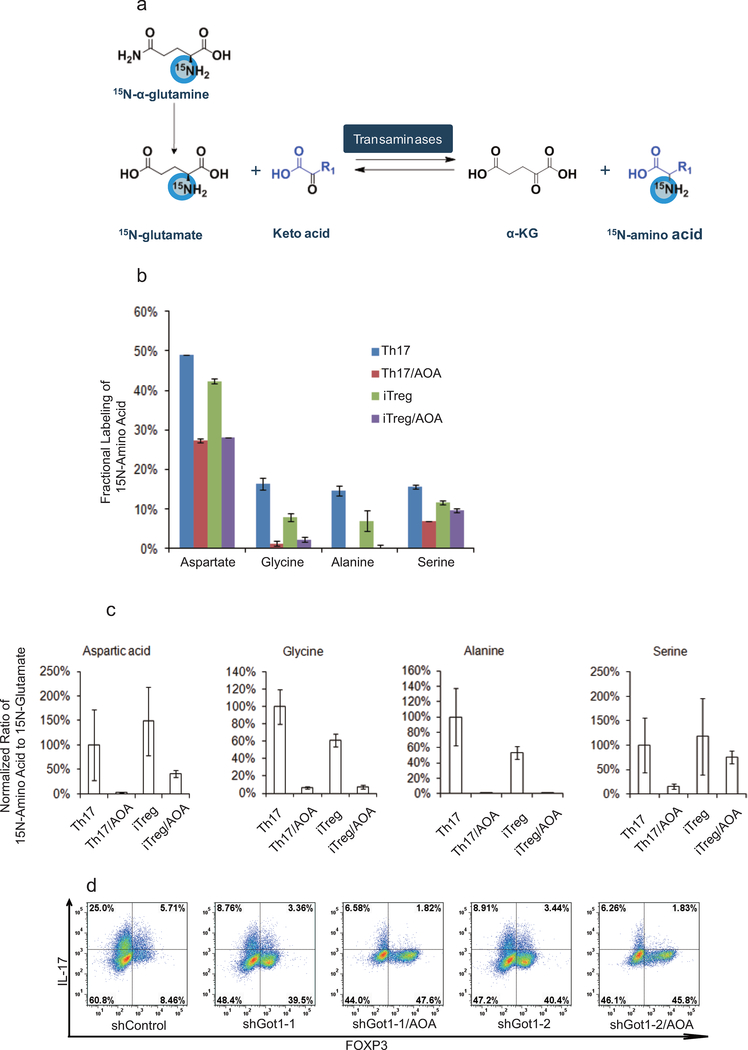
AOA inhibits pyridoxal 5’-phosphate (PLP) -dependent transaminases, which mediate the interconversion of alpha-amino and alpha-keto acids in reductive amination, in which the redox balance of the reaction is maintained by concomitant conversion of glutamate (nitrogen donor) into alpha-ketoglutaric acid (α-KG)12,13. Thus, the PLP/glutamate-dependent transaminase(s) involved in T-cell differentiation can be deduced by measuring stable isotopic label accumulation into various amino-acids for differentiating TH17 cells or iTreg cells fed with 15N-α-glutamine (Extended Data Fig. 2a). To identify the major target of AOA in T-cell differentiation, and determine if TH17 and iTreg cells undergo active yet lineage-distinct transamination processes, T cells differentiated under TH17 or iTreg condition were cultured with 15N-α-glutamine (2 mM) containing medium for 4 hours, and free intracellular 15N-amino acids were analyzed by LC/MS. Interestingly, the concentration of 15N-α-aspartate is 10 fold higher in differentiating TH17 cells and iTreg cells than other detectable 15N-amino acids (Fig. 1e). Moreover, ~50% of the cellular aspartate pool was labeled with 15N, in contrast to the relatively low fractional labeling for a few other amino acids (Extended Data Fig. 2). In addition, the total intracellular 15N-α-aspartate was reduced by 90% or 75% by AOA treatment in differentiating TH17 cells and iTreg cells, respectively (Fig. 1e). These data suggests that a primary fate of the amino group of glutamate in differentiating TH17cells and iTreg cells was for biosynthesis of aspartic acid catalyzed by GOT1/2, and also that GOT1/2 serves as the major transaminase catalyzing conversion of glutamate into α-KG in these cells. Consistently, Got1 was the only transaminase highly and differentially expressed in TH17 and iTreg cells (Fig. 1f), further suggesting an important mechanistic link for Got1 activity in the fate determination of TH17 cell differentiation. shRNA knock-down of Got1 in differentiation TH17 cells inhibit TH17 cell differentiation and reciprocally increased iTreg cell differentiation (Fig. 1g and h), and the effect of Got1-shRNA could not be further increased by AOA (Extended Data Fig. 2d), further confirming that Got1 is the main target of AOA during TH17 cell differentiation.
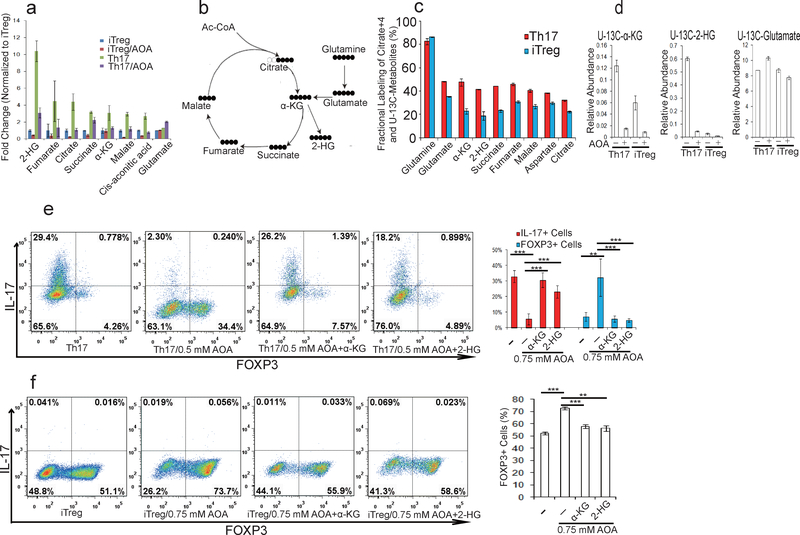
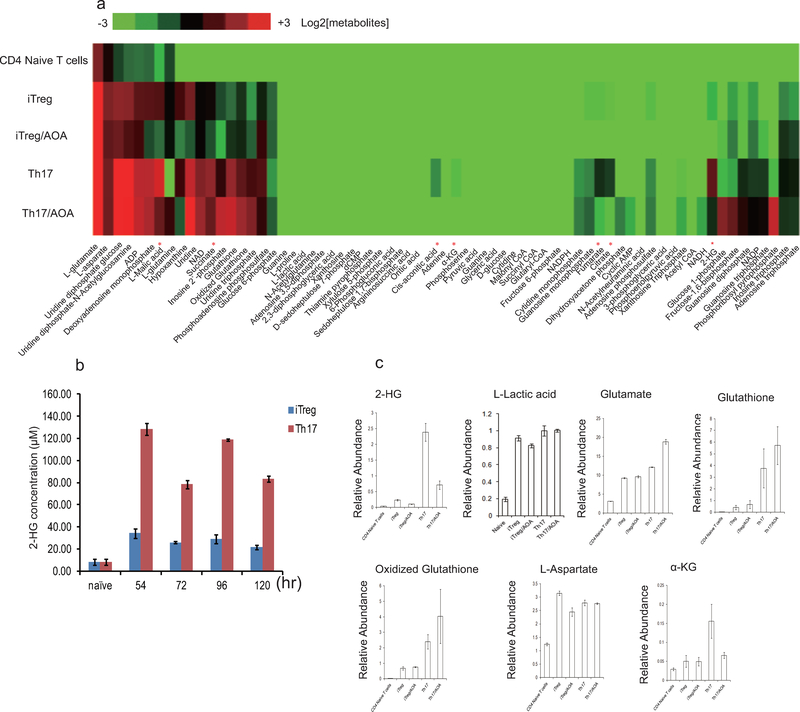
To explore how Got1-dependent transamination regulates TH17 cell differentiation, we profiled intracellular metabolite levels upon AOA treatment by LC/MS metabolomics in differentiating TH17 and iTreg cells (day 2.5). Differentiating TH17 cells showed slight elevation of several TCA cycle intermediates, such as α-KG, succinate, fumarate, malate, and citrate than differentiating iTreg cells, and their abundance was reduced partially by AOA in both differentiating conditions (Fig. 2a and Extended Data Fig 3). Notably, among all the metabolites detected, 2-hydroxyglutarate (2-HG), which is the direct product of error-prone dehydrogenase activity on the substrate α-KG, exhibits the most significantly elevated level in TH17 cells relative to iTreg cells (Fig.2a). Differentiating TH17 cells maintained ~5–10-fold greater levels of 2-HG compared to iTreg cells along the differentiation timeline (Fig. 2a and Extended Data Fig. 3) with intracellular levels quantitated to be approximately 0.2 mM. Indeed, AOA reduced the steady-state levels of 2-HG by 75% and 50% in differentiating TH17 and iTreg cells, respectively (Fig. 2a and Extended Data Fig. 3b), suggesting that 2-HG synthesized from transamination-driven α-KG in differentiating TH17 and iTreg cells contributes significantly to the total 2-HG pool. Notably, AOA treatment did not affect L-lactic acid level in cells, indicating AOA treatment did not affect glycolysis (Extended Data Fig. 3).
Figure 2.
2-HG derived from glutamine/glutamate is highly elevated under TH17 condition, and facilitates TH17 cell differentiation. a) The relative abundance of significantly changing metabolites from Extended Data Figure 3a was normalized to that in iTreg cells. b) Schematic of labeling patterns for U-13C glutamine feed for TCA cycle intermediates. c) U-13C-Glutamine labeling shows that carbon of glutamine enters into TCA cycle and is responsible for 2-HG synthesis. d) Abundance of 2-HG+5 and α-KG+5 (normalized to intracellular U-13C-glutamine). e) Exogenously added α-KG and 2-HG rescued the effects of AOA on TH17 cell differentiation. f) Cell-permeable dimethyl esters of α-KG, 2-HG rescued the effects of AOA on iTreg cell differentiation. Mean±S.D. of three replicates from a representative data of three (a) or two independent experiments (c and d) are presented in a, c, and d. Representative flow data from 3 independent experiments were shown in e and f. Mean±S.D.(n=3) of three independent experiments is presented in right panel of e and f. *P<0.05; **P<0.01; ***P<0.001 by Student`s t-test.
To further confirm that conversion of total cellular glutamate into α-KG drives altered 2-HG levels, differentiating TH17 and iTreg cells were cultured with a uniformly 13C-labeled glutamine ([U-13C-Gln]) for 4 hours, and then intracellular metabolites and isotopologues were analyzed by LC/MS (Fig. 2b). With more than 80% of the intracellular glutamine pool labeled, fractional labeling of U-13C-2-HG, U-13C-α-KG, and TCA cycle intermediates was higher in TH17 cells compared to iTreg cells (Fig. 2c), suggesting that more glutamine/glutamate carbon contributes to the TCA cycle and 2-HG synthesis in differentiating TH17 cells than in iTreg cells. Notably, newly synthesized 2-HG was >30 fold higher in TH17 cells than in iTreg cells, while newly synthesized α-KG is ~three fold higher in TH17 cells than in iTreg cells (Fig. 2d). As expected, de novo synthesis of both a-KG and 2-HG in iTreg and TH17 cells was inhibited by AOA, which provides the metabolic confirmation for the decrease in the total pool as a function of AOA treatment (Fig. 2d).
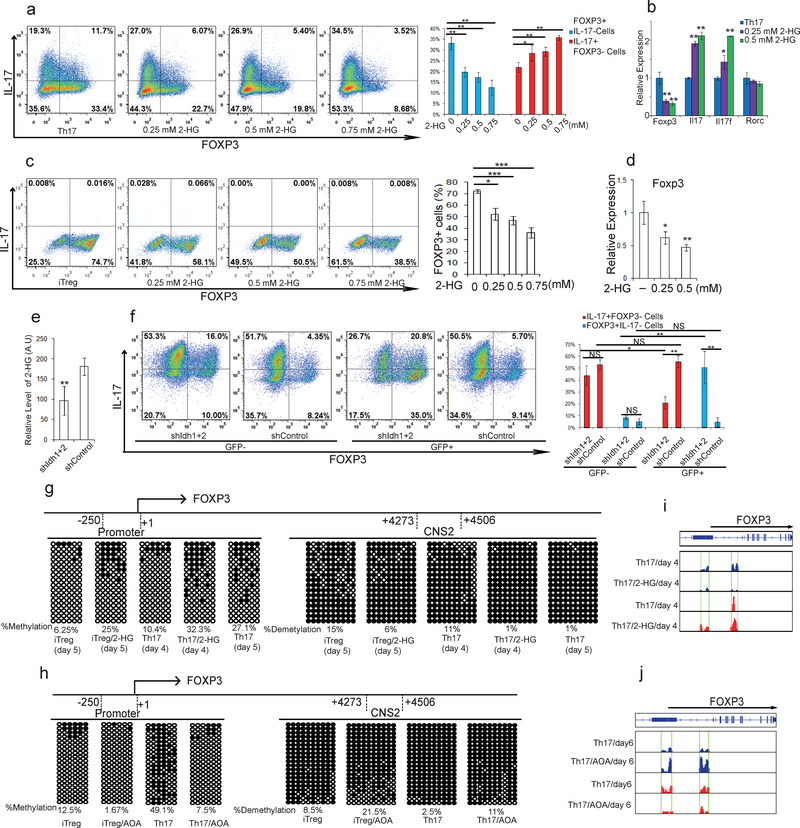
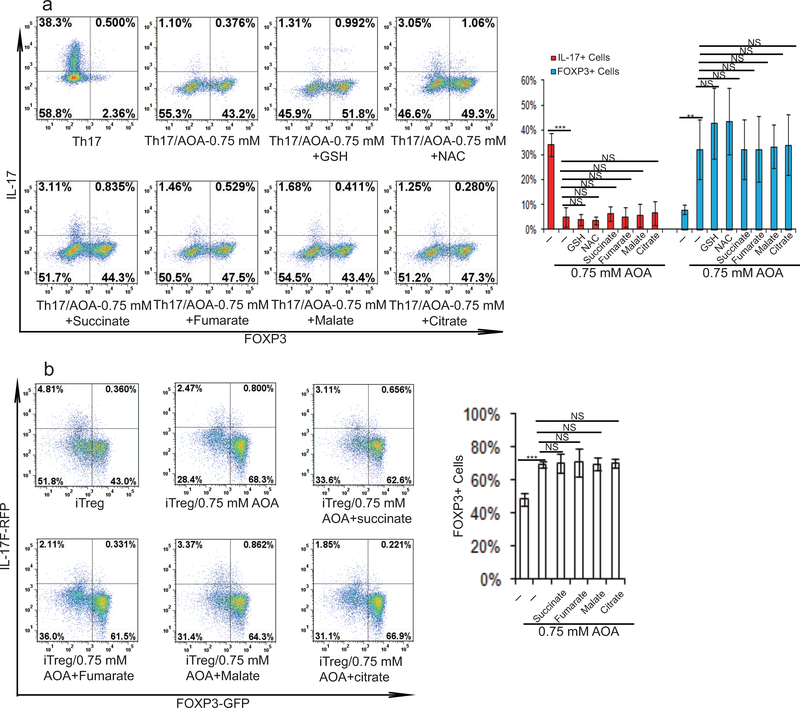
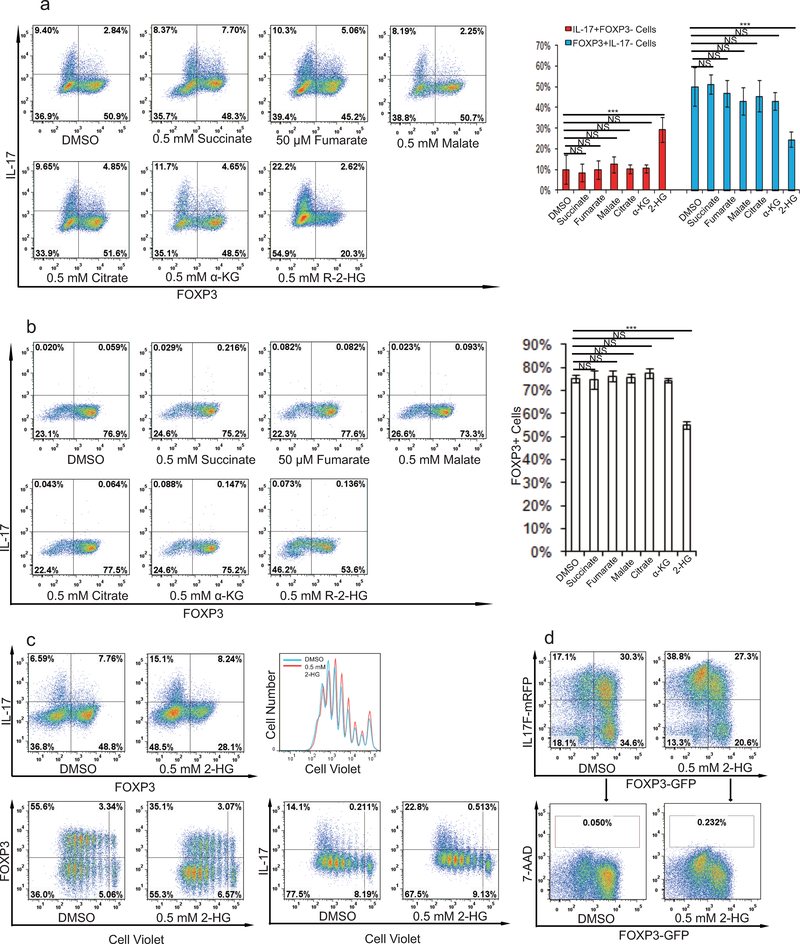
To further determine the functional importance of metabolites downstream of glutamate and α-KG in specifying TH17/iTreg cell fate, cell permeable α-KG, 2-HG, succinate, fumarate, malate, citrate, NAC, and GSH were individually added to AOA-containing TH17 culture or iTreg culture conditions. Among all the metabolites examined, only dimethyl-α-KG (DMKG) and R-2-HG (DMR2-HG) rescued the inhibitory effect of AOA on TH17 differentiation or reversed its enhancing effect on iTreg differentiation (Fig. 2e, 2f and Extended Data Fig. 4). Moreover, dimethyl R-2-HG, but not α-KG – the precursor of 2-HG, directly (in the absence of AOA) promoted TH17 cell differentiation by up-regulating IL-17/IL-17F expression and down-regulating FOXP3 expression in a dose-dependent manner without affecting cell survival or proliferation (Fig. 3a and Extended Data Fig. 5a, 5c, 5d), suggesting that 2-HG regulates TH17 cell differentiation independent of cell proliferation. Similarly, dimethyl R-2-HG, but not α-KG, inhibited FOXP3 expression under iTreg condition (Fig. 3c, Extended Data Fig. 5b). One possibility that distinguishes 2-HG and α-KG in normal TH17 and iTreg differentiation in the absence of AOA is that the generation of 2-HG, but not α-KG, may represent a rate-limiting step in glutamate metabolism that dictates the fate of differentiating T cells. These results showed that central carbon metabolism involving α-KG and its downstream metabolites (i.e., 2-HG) is not simply metabolomics phenomena, but rather is a functional effector of the naïve T-cell specification and its response to AOA.
Figure 3.
2-HG promotes TH17 cell differentiation by promoting methylation of FOXP3 locus. a, Dimethyl R-2-HG promoted TH17 cell differentiation. b, mRNA expression from cells in a. c, Dimethyl 2-HG inhibited iTreg cell differentiation. d, FOXP3 mRNA from cells in c. e, Knockdown of IDH1/2 decreased 2-HG production in TH17 culture. f, Knockdown of IDH1/2 suppressed TH17 cell differentiation and reciprocally promoted iTreg cell differentiation. g, Exogenous dimethyl R-2-HG promotes methylation of FOXP3 locus during TH17 or iTreg cell differentiation. h, AOA promoted hypomethylation of FOXP3 locus. In g and h,  , methylated cytosine;
  , demethylated cytosine. i and j) The effect of 2-HG or AOA on hydroxymethylation/ methylation at FOXP3 locus examined by (h)MeDIP-seq. Peaks of 5hmC (blue) or 5mC peaks (red) at FOXP3 locus were shown. In g-j, Male mice were used due to the X-chromosome inactivation. Flow data from a representative experiment were shown in a, c, and f. The experiments were repeated at least three times. Bar graph in right panel of a, c, f are mean±S.D. of three independent experiments. Bar graph in e (n=12) is combination of four independent experiments, and presented as mean±S.D.. Mean±S.D. of 3 replicates from a representative experiment of three independent experiments is presented in b and d. NS=non-significant; *P<0.05; **P<0.01; ***P<0.001 by Student`s t-test.
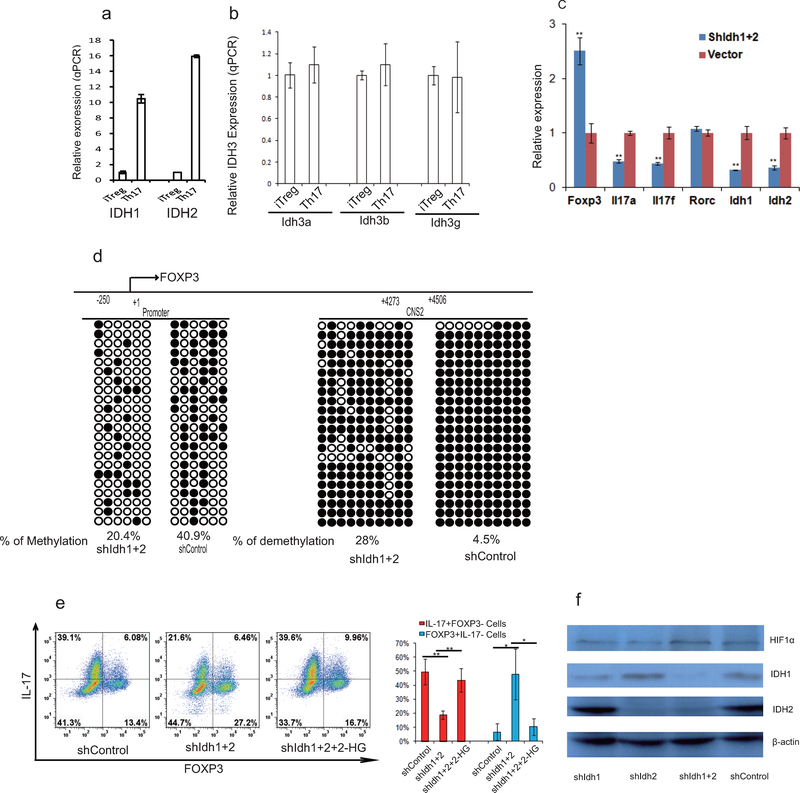
2-HG had been shown to be produced via wild-type (WT) IDH1 and IDH2-mediated metabolism14,15. Consistently, IDH1 and 2 are highly expressed in differentiating TH17 cells (Extended Data Fig. 6a, 6b and data not shown). Knock-down of both IDH1 and IDH2 in differentiating TH17 cells decreased 2-HG production and reduced IL-17/17F expression and reciprocally increased FOXP3 expression (Fig. 3e, 3f and Extended Data Figure 6c) without affecting Rorc mRNA expression or HIF1α protein expression (Extended Data Fig 6c and 6f). The effect of IDH1/2 knock-down on TH17 cell differentiation can be rescued by adding exogenous 2-HG (Extended Data Fig 6e). The data thus suggested that α-KG/2-HG accumulated under TH17 differentiation condition promote TH17 cell differentiation.
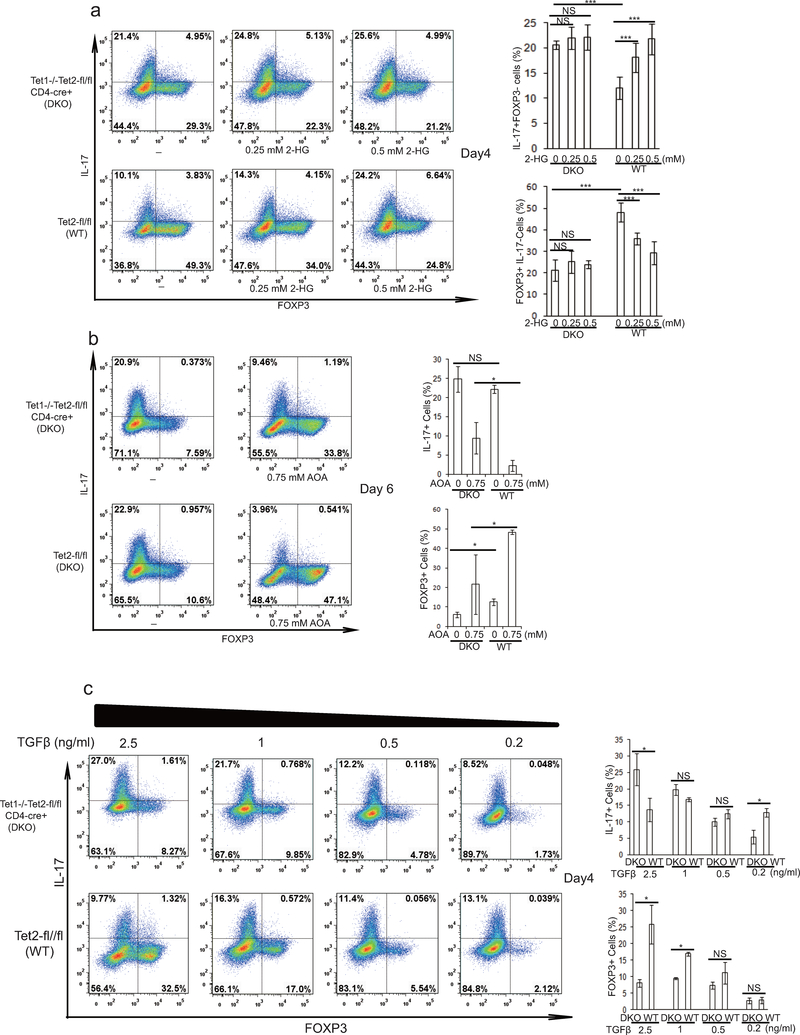
R-2-HG suppressed FOXP3 transcription in both TH17 and iTreg cells, and increased transcription of Il17/Il17f mRNA, but not Rorc in differentiating TH17 cells, indicating R-2-HG might indirectly promote TH17 cell differentiation through down regulation of Foxp316 (Fig. 3a–d). R-2-HG is an antagonist of Tet1–3, which regulate FOXP3 expression redundantly through demethylating FOXP3 promoter and its intronic CpG island. Similar to 2-HG treatment, Tet1 and Tet2 DKO (hereafter DKO) dramatically increased percentage of IL-17+/FOXP3- cells, and decreased percentage of IL-17-/FOXP3+ cells (Extended Data Fig.7a), confirming that Tet1/2 also control FOXP3 expression during TH17 cell differentiation. Consistently, 2-HG treatment promoted TH17 cell differentiation in WT T cells, but the effect was largely abrogated in Tet1/2 DKO T cells (Extended Data Fig.7a). In addition, Tet1/2 DKO partially diminished the effect of AOA on TH17 cell differentiation (Extended Data Fig 7b), possibly due to that all three Tet proteins function redundantly to regulate FOXP3 expression17,18. These data collectively suggest that 2-HG and AOA regulate TH17 differentiation at least in part through targeting Tet1/2. Consistently, recent study also showed that Tet1/2 DKO in T cells resulted in unstable Treg cells that were prone to be converted into TH17 cells, and caused inflammation in multiple organs17. Interestingly, reduced TGFβ concentration (therefore reduced recruitment of Tet1/2 to FOXP3 locus17) largely abrogated the promoting effect of Tet1/2 DKO on TH17 cell differentiation, further confirming the role of Tet1/2 in FOXP3 expression during TH17 cell differentiation (Extended Data Fig 7c).
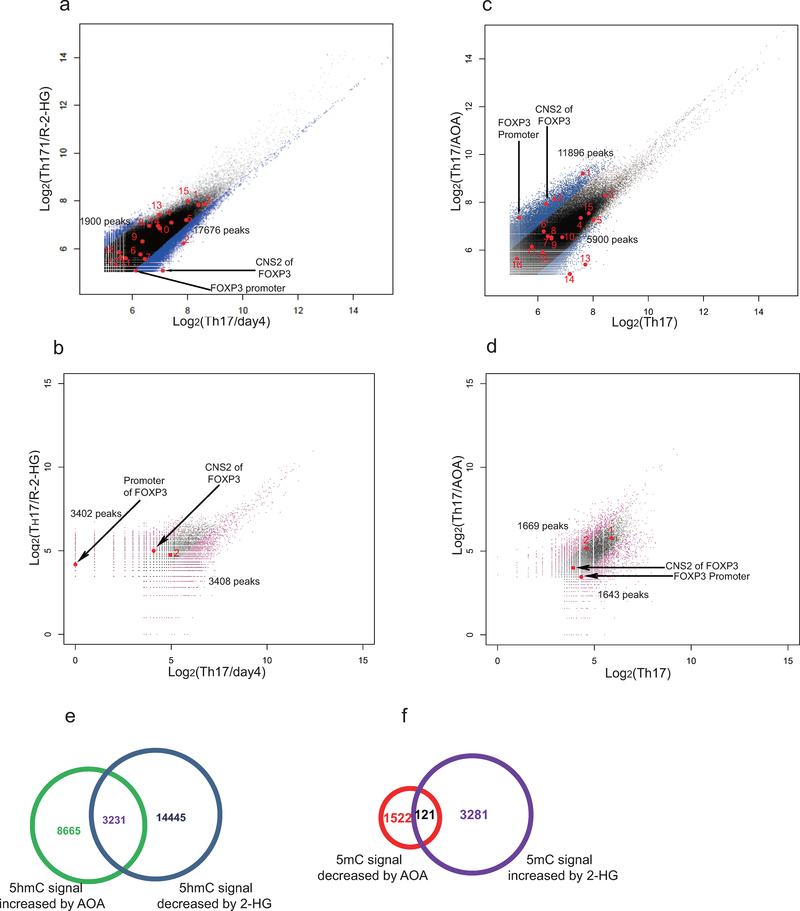
To further investigate the role of 2-HG and Tet proteins in TH17 cell differentiation, we next examined the methylation status of the FOXP3 promoter and CpG island by bisufite sequencing in TH17 cells and iTreg cells19. Consistent with previous studies, FOXP3 promoter is hypomethylated in iTreg cells, and its intronic CpG island exhibits partial DNA demethylation in iTreg cells19. Surprisingly, we found these regions are also hypomethylated in differentiating TH17 cells, very similar to iTreg cells, but are hypermethylated in fully differentiated TH17 cells (Fig. 3g). Strikingly, 2-HG dramatically increased methylation level of these regions in both differentiating TH17 cells and iTreg cells (Fig. 3g). Conversely, knockdown of IDH1/2 reduced methylation level at FOXP3 promoter and CNS2 regions (Extended Data Fig. 6d). Similarly, AOA treatment dramatically decreased methylation level at the FOXP3 gene locus in both TH17 and iTreg cultures (Fig. 3h). Genome wide distribution of 5-methylcytosine (5mC) and 5-hydroxymethylcytosine (5hmC) were then analyzed by hMeDIP-seq or MeDIP-seq, respectively. In total, 330,582 peaks were enriched with 5hmC in TH17 cells. 2-HG treatment resulted in reduced 5hmC signal at 17,676 peaks, among which 3402 sites also exhibited increased 5mC signal, including Foxp3 locus (Fig. 3i and Extended Data Figure 8a, and b). In contrast, AOA treatment increased 5hmC signal at 11,896 sites, among which 1643 peaks exhibits reduced 5mC signals (Extended Data Figure 8c and d). Consistently, AOA treatment increased 5hmC signal at both FOXP3 promoter and CNS2 region, decreased 5mC signal at FOXP3 promoter (Fig 3j, and Extended Data Figure 8c, d), but not the CNS2 region, likely because the changes were too subtle and not detectable as CNS2 region is always hypermethylated in iTreg cell (70–80%)19. Notably, neither 2-HG nor AOA changed 5hmC signal or 5mC signal at other important lineage-specific gene loci, such as Il4/5/10/13, Rorc, Tbx21 (Extended Data Figure 8). Interestingly, 5hmC and 5mC at 121 sites (97 genes, including non-coding RNAs) were found to be affected by both AOA and 2-HG, many of which are FOXP3 direct targets, such as Foxp1, Bach2 (Extended Data Fig 8e–f, Extended Data Table 1), indicating changes in 5hmC and 5mC at these targets may be caused indirectly by FOXP3 expression. These epigenetics analysis, together with gene expression data, strongly suggest that AOA and 2-HG regulate TH17 cell differentiation indirectly through altering Foxp3 expression, but not other T-lineage related genes.
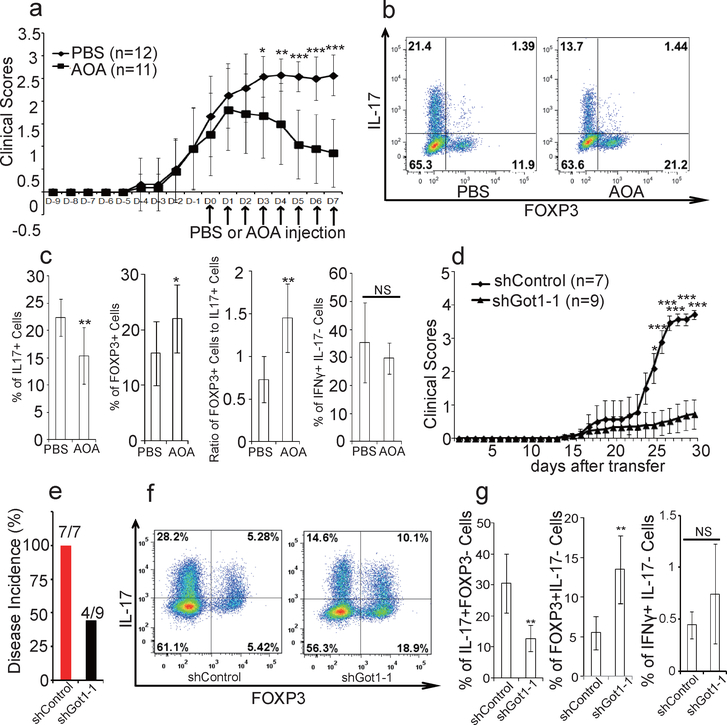
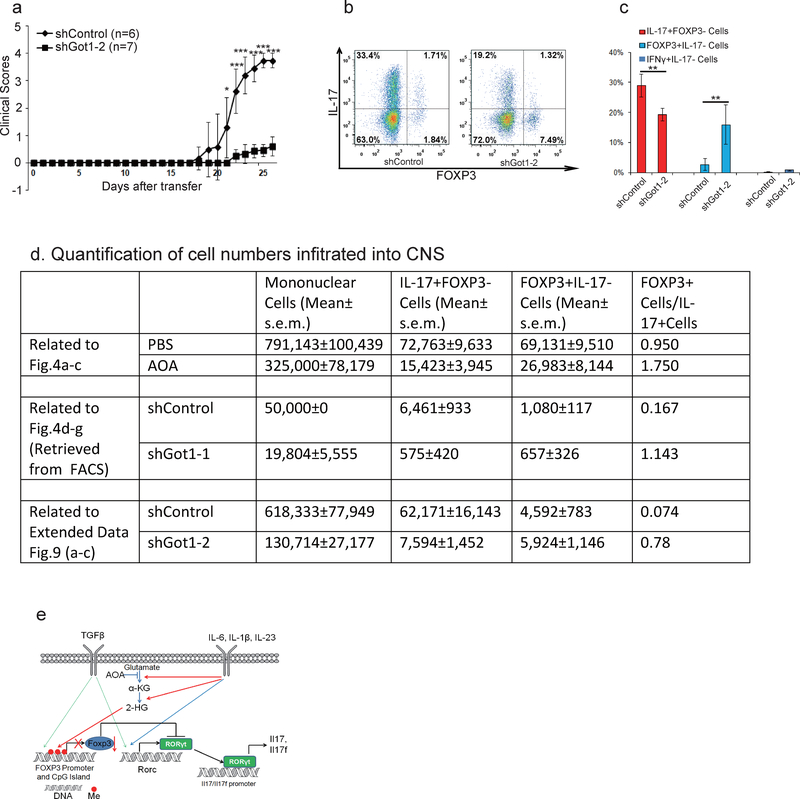
To examine the functional relevance of our findings, experimental autoimmune encephalomyelitis (EAE) was induced as described20. AOA or control vehicle was injected daily intraperitoneally after most mice developed apparent diseases. Remarkably, AOA administration caused a significant recovery from EAE diseases in this therapeutic disease model (Fig. 4a). Also, total number of mononuclear cells infiltrating into CNS was markedly reduced in AOA treated mice compared to control mice (Extended data Figure 9d). Importantly, AOA treatment significantly reduced the percentage of IL-17 producing T cells and increased the percentage of FOXP3+ T cells (p<0.01) without affecting the percentage of IFNү+ cells (P>0.05) in the central nervous system (CNS) (Fig. 4b and 4c). The ratio of FOXP3+ cells to IL17+ cells is much higher in AOA-treated mice than in control mice (Fig. 4c). To further investigate the physiological significance of Got1 in vivo, adoptive transfer model using CD4 naïve T cells from 2D2 mice (constitutively expressing MOG35–55 specific T-cell antigen receptors21) was performed. The cells undergoing TH17differentiation were infected with virus containing shGot1 or control shRNA and Thy1.1 (CD90.1), and the infected cells were then transferred into wild type mice. In this TH17 polarized transfer EAE model, diseases severity, as well as the total number of mononuclear cells infiltrating into CNS were significantly reduced in mice receiving Got1 knockdown cells than those receiving control shRNA infected cells (Fig 4d, e, Extended Data Figure 9a, 9d). The percentage of IL-17 producing T cells and FOXP3+Treg cells infiltrating into CNS were significantly decreased and increased, respectively by Got1 knockdown, while IFNү+ T cells were not readily detectable (Fig 4f, g, and Extended Data Figure 9). Our study thus demonstrates that selectively targeting the glutamate metabolic pathway could alter the balance of TH17/Treg cells both in vitro and in vivo, and may represent a novel strategy for addressing TH17-mediated autoimmune diseases.
Figure 4.
AOA produced significant recovery from EAE diseases mainly through targeting Got1. a-c, AOA ameliorated mouse EAE diseases, and disease scores were recorded in a. b, the representative flow data of T cells (gated on Thy1.1+) infiltrated into CNS. c, statistics of each population from b, n=11 (control), n=10 (AOA). The results in a-c are combinations of two experiments. d-g, TH17 polarized adoptive transfer EAE showed that knockdown of Got1 ameliorated mice EAE diseases. The disease score was recorded in d, and disease incidence is in e. CNS infiltrated T cells were analyzed (Gated on Thy1.1+ cells), and representative flow data were shown in f. The statistics for CNS infiltrated T cells is in g. d-g was from one representative experiment of two experiments. The data in a, c, g were presented as mean±S.D. The disease score in d is represented as mean±s.e.m. NS=non-significant; *P<0.05; **P<0.01; ***P<0.001 by Student`s t-test.
In summary, we showed that increased transamination via Got1 leads to much greater accumulation of 2-HG in differentiating TH17 cells than in iTreg cells, which promoted the methylation of FOXP3 gene locus and silenced FOXP3 gene expression. Interestingly, we found that 2-HG levels in differentiating TH17 cells (e.g., 0.1–0.4 mM) were much lower than that in cancer cells harboring IDH1/2 mutations (≥1 mM). Nonetheless, endogenous 2-HG accumulations under TH17 condition and experiments with exogenously added 2-HG in TH17 culture correlate well with hypermethylation of FOXP3 gene locus and reduced mRNA and protein level of FOXP3 in fully differentiated TH17 cells, suggesting different cell types may exhibit differential sensitivity to 2-HG level. Manipulating a single step in a glutamate metabolic pathway could change TH17 cell fate by affecting methylation of FOXP3 gene locus, and ameliorate mouse EAE disease by regulating TH17/iTreg balance, highlighting the importance of cellular metabolism in T-cell fate determination.
Materials and Methods
Reagents and cell culture
T cells were cultured in Advanced RPMI 1640 (Invitrogen, #12633) supplemented with 10% FBS (invitrogen), penicillin-streptomycin (Invitrogen), 55 μM β-mercaptoethanol, and 2 mM glutamine.
T-cell differentiation
CD4 naïve T cells (CD4+CD25-CD62highCD44low) were sorted from IL-17F-RFP/FOXP3-GFP mice, which were characterized previously or wide-type C57/BL6 mice (6–10 weeks old male or female mice were used unless specified). 0.4 million cells were plated into 48 wells coated with anti-mouse CD3 (clone 145–2C11, eBioscience) (2 μg/ml) and anti-mouse CD28 (clone 37.51, eBioscience) (1 μg/ml). The differentiation for T cells are as followed: 0.5 ng/ml (or indicated) TGFβ, 200 U/ml mouse IL-2, 2 μg/ml anti-IFNү and 2 μg/ml anti-mouse IL4 for iTreg, 2.5 ng/ml TGFβ, 10 ng/ml mouse IL-1β, 10 ng/ml mouse IL-6, 10 ng/ml mouse IL-23, 2 μg/ml anti-mouse IFNү, and anti-mouse IL-4 for TH17. All the cytokines are from R&D systems. The cells were supplemented with new medium at day 4. In cases with which small-molecule compounds present, fresh medium containing the same concentration of compounds was used. When necessary, the individual metabolite was added into the T-cell culture 6 hours later after initial cell plating. On day 6, the cells were analyzed for IL17F-RFP and FOXP3-GFP or the cells were collected and restimulated for 4–6 hours with PMA, inomycin, and Golgi-stop for intracellular staining in absence of indicated compounds.
Antibodies
Anti-IDH2 was from Abcam (# ab131263), anti-IDH1 was from Cell Signaling Technology (#8137S), and anti-HIF1α is from Novus biologicals (#NB100–105). Anti-mouse CD3 (clone 145–2C11, cat#16–0031), anti-mouse CD28 (clone 37.51, cat#16–0281), anti-mouse IFNγ (Clone XMG1.2,Cat#16–7311), anti-mouse IL-4(Clone 11B11, cat#16–7041), anti-mouse FOXP3 (clone FJK-16s, cat#17–5773) are from eBioscience. Anti-mouse CD4 (clone RM4–5, Cat#550954), anti-mouse CD25 (clone 7D4, Cat#558642), anti-mouse CD44 (Clone IM7, Cat#559250), anti-mouse CD62L (clone MEL-14, Cat#560507), anti-mouse IL-17 (clone TC11–18H10, Cat#559502), anti-mouse IFNγ (clone XMG1.2, Cat#561040, for staining) and anti-CD90.1 (Thy1.1) (clone OX-7, cat#561406) were from BD Bioscience.
mRNA expression analysis by qRT-PCR
At the end of differentiation (day 6), T cells were re-stimulated with plate-coated anti-CD3 and anti-CD28 for 5 hours in absence of any small-molecule compounds or metabolites. qRT-PCR was performed to evaluate mRNA expression of FOXP3, Il17, Il17f, and Rorc. For differentiating TH17 or iTreg cells, cells were collected on day 2.5 or at the indicated time for mRNA expression analysis. The expression was normalized to β-actin. All primers are listed in Extended Data.
Intracellular metabolomics/broad profiling
CD4 naïve T cells, differentiating TH17 cells (day 2.5), and iTreg cells (day 2.5) were collected. A solution of 80/20 MeOH/H2O was used to extract intracellular metabolites. The extracted samples were analyzed with LC/MS metabolomics. 200 ng/mL of extraction standard (L-glutamic acid-13C5–15N-d5) was added into samples, and the peak value for each metabolite was normalized to extraction standard. The data were transformed into Log2 and clustered. Cell extracts obtained as described above were analyzed for relative abundance of 13C and 15N metabolites by liquid chromatography-triple quadrupole mass spectrometry (LC-MS) using scheduled selective reaction monitoring (SRM) for each metabolite of interest, with the detector set to negative mode22. Quantitation of intracellular 2HG was conducted as described (Kernesky et al., Blood 2015, 125(2) 296–303)
U-13C glutamine or 15N-α-glutamine flux analysis
CD4 naïve T cells, differentiating TH17 or iTreg cells (68 hours) were incubated with fresh media prior to labeling. The cells were then cultured for 4 hours at 37 °C with medium where the glutamine was replaced with the corresponding stable isotope label: 2 mM U-13C glutamine or 2 mM 15N-α-glutamine for 4 hours at 37 °C. The cells were quickly collected and quickly washed with PBS, pelleted, and snap frozen in liquid nitrogen. The frozen samples were kept in −80 °C until extraction. Cell extracts were prepared by first adding 80/20 MeOH/H2O at −60 °C to the frozen pellets and collecting the supernatant after centrifugation at 4 °C. The extracted samples were analyzed by high-resolution liquid-chromatography–mass spectrometry. Unlabeled glutamine-fed cells were used as background.
For negative mode metabolomics: Cell extracts obtained as described above were analyzed for relative abundance of metabolites by liquid chromatography-triple quadrupole mass spectrometry (LC-MS) using scheduled selective reaction monitoring (SRM) for each metabolite of interest, with the detector set to negative mode22. Prior to injection, dried extracts were reconstituted in LC-MS grade water. LC separation was achieved by reverse-phase ion-pairing chromatography as described23.
For amino acid profiling: The U-HPLC system consisted of a Thermo Fisher Scientific (San Jose, USA) U-HPLC pumping system, coupled to an autosampler and degasser. Chromatographic separation of the intracellular metabolites was achieved by usage of a reversed phase Atlantis T3 (3 μm, 2.1mm ID × 150mm) column (Waters, Eschborn, Germany) and by implementation of a gradient elution program. The elution gradient was carried out with a binary solvent system consisting of 0.1% formic acid and 0.025% heptafluorobutyric acid in water (Solvent A) and in acetonitrile (Solvent B) at a constant flow rate of 400 μL min−1. The linear gradient employed was as follows: 0–4 min increase from 0 to 30% B, 4–6 min from 30 to 35% B, 6–6.1 min from 35 to 100% B and hold at 100% B for 5min, followed by 5 min of re-equilibration. The column oven temperature was maintained at 25 °C and sample volumes of 10 μL were injected. HRAM data was acquired using a QExactive™ Orbitrap mass spectrometer (Thermo Fisher Scientific), which was equipped with a heated electrospray ionization source (HESI-II), operated in positive mode. Ionization source working parameters were optimized; the heater temperature was set to 300 °C, ion spray voltage was set to 3500 V. An m/z scan range from 70 to 700 was chosen and the resolution was set at 70,000. The automatic gain control (AGC) target was set at 1e6 and the maximum injection time was 250 ms. Instrument control and acquisition was carried out by Xcalibur 2.2 software (Thermo Fisher Scientific).
Methylation analysis by bisulfite sequencing
The method is the same as described. Briefly, genomic DNA was purified with Blood & Cell Culture DNA Midi Kit (Qiagen). Bisufite conversion of genomic DAN was performed using Epitect bisulfite kit (Qiagen), according to the manufacture’s instruction. The primers used to amplify the FOXP3 promoter and its intronic CpG island are the exactly same described and listed in supplementary material. The PCR product was run on 2% agarose, purified and cloned using TOPO® TA Cloning® Kit with PCR®4. Clones are picked for Sanger sequencing.
Retrovirus preparation and T-cell infection
ShRNAs (synthesized DNA oligos) after annealing were cloned into PMKO.1-GFP retrovirus or PMKO.1-Thy1.1-mRFP vector. The plasmids and pCL-ECO (1:1) were transfected into 293T cells (ATCC, Cat#CRL-3216, mycoplasma test was performed to confirm it is negative) with Fugene HD4 (Promega). The medium was changed 6 hours after transfection, and the cells were further cultured for 48–72 hours. The supernatant was then collected and filtered using 45-μm filters. The supernatant containing the viruses was added into pre-activated CD4 T cells (20 hours after initial plating). The cells were spin-infected at 1000g for 2 hours and cultured in incubator for another 2 hours. The cells were washed and cultured under TH17 condition for an additional 4 days. New medium was added if necessary. At day 5, the cells are collected for sorting GFP+ cells and GFP- cells. Sorted cells was further cultured until day 6, and re-stimulated for intracellular staining or mRNA analysis, as described above.
Mouse EAE model
EAE was induced by immunizing mice (12 weeks old, 11–12 female C57BL/6 mice/group) twice with 300 μg of MOG35–55 peptide (amino acids 35–55; MEVGWYRSPFSROVHLYRNGK) emulsified in complete Freund`s adjuvant, followed by pertussis toxin injection and analyzed as described20. The disease scores were assigned on a scale of 0–5 as follows: 0, none; 1, limp tail or waddling gait with tail tonicity; 2, wobbly gait; 3, hind limb paralysis; 4, hind limb and forelimb paralysis; 5, death. When the disease phenotype is very obvious (average score>1), PBS or AOA (750 μg/mice) was intraperitoneal (i.p.) injection every day (Mice were randomly assigned to treatment groups, and scored in a blinded manner). After 8 days of administration of AOA or PBS, the mice were anesthetized, and cells infiltrated into brain and spinal cord were collected for analysis. For adoptive transfer EAE, CD4 naive T cells isolated from 2D2 mice (https://www.jax.org/strain/006912) were cultured under TH17 condition for 20 hours, and then the cells were infected with virus containing shGot1 or control shRNA and a cell surface protein, Thy1.1+ (which does not express in C57BL/6 background mice). At the end of differentiation, the cells were purified, and 6×10⁷ cells were i.p. injected into wild type C57BL/6 recipient mice (8–10 weeks old female mice). The recipient mice were irradiated with sublethal X-ray (5 Gy) prior to cells injection. PTX (500 ng/mouse) was i.p. injected later on the day of transfer and two days later. The disease was scored daily thereafter as above. Mice were randomly assigned to treatment groups, and scored in a blinded manner. Experimental groups were unblinded to treatment assignment at the end of the experiments to ensure experimenter bias was not introduced. At the end of experiment, the mice were sacrificed for analysis of CNS infiltrated T cells. The representative result from two independent experiments was shown. Mice that did not develop symptoms of EAE were not excluded from the analysis. Power analysis was used to calculate the sample size. 4 mice per group is enough for calculation, here we used 11–12 in active EAE, or 7–9 mice in adoptive transfer EAE to get more confident data set. When indicated, the statistical significance was determined by Student`s t test (*, p< 0.05; **, p< 0.01; ***, p< 0.001). All animal work was approved by the institutional IACUC committee.
Mice
Tet1tm1.1Jae/J (JAX #017358, Tet1+/−), B6.129S-Tet2tm1.1Iaai/J (JAX #017573, Tet2fl/fl), and Tg (Cd4-cre)1Cwi/BfluJ (JAX #017336, Cd4Cre) mice were purchased from Jackson Lab. We first got Tet1+/−Tet2fl/fl-Cd4Cre+, then mated them to generate Tet1−/−Tet2-fl/fl-Cd4Cre+ mice. 2D2 mice (https://www.jax.org/strain/006912) were purchased from Jax.
MeDIP-seq/hMeDIP-seq
DNA was purified from differentiating TH17 cells (absence or in presence of R-2-HG), or TH17 cells at the end of differentiation (absence or in presence of AOA), and sheared into 200–500bp fragments using Covaris S2 sonicator. DNA fragments were then end-repaired, adenylated, and adapter added using Nextflex CHIP-seq preparation kit (Bioo scentific) following the manufacturès protocol. The ligated DNA was then denatured into single strand DNA for CHIP (chromatin immunoprecipitation). The CHIP was done by incubating the DNA with anti-5mC or 5hmC (from Active motif) following manufacturès protocol. After CHIP, the eluted DNA was PCR amplified and sequenced on Hiseq-2500.
Data Analysis for (h)MeDIP-seq
Raw FASTQ Reads are trimmed using the fastq-mcf program to remove any Illumina adapter sequence. Trimmed reads are aligned to the genome assembly of Mus musculus reference genome (NCBI37/ mm9) using Bowtie2 (Ref 1). 5-hmC and 5-mC peak identification was performed with MACS (Ref 2) using nonduplicate reads from each immunoprecipitation sample and its corresponding input control sample. Parameters were as follows: effective genome size = 1.87e+09; band width = 200; ranges for calculating regional lambda are: peak_region, 1,000, 5,000, 10,000; and Benjamini-Hochberg Q value cutoff = 0.01 to identify confident peaks. Read counts of all peak regions were extracted from each samples by bedtools multicov (Ref 3) and used for further analysis of quantitative changes. Peak regions with greater than 30 read count in all 5hmC sample or 10 in 5mC samples are kept. Each region for each sample is scored by the read count in this region normalized by the total number of mapped reads in each sample. The difference is computed as peak region intensity between samples as log2 fold change. Peak region annotation is performed with Homer tools suite to identify genomic features and associated genes based on distance to the nearest TSS. Peak region intensity of larger than 2 fold difference for 5hmC or 1.8 fold for 5mC were highlighted in scatter plot. Normalized pileup files are converted to bigwig (http://genome.ucsc.edu/goldenpath/help/bigWig.html) for visualization in IGV (1. http://genomebiology.biomedcentral.com/articles/10.1186/gb-2009–10-3-r25; 2. http://genomebiology.biomedcentral.com/articles/10.1186/gb-2008–9-9-r137; 3. http://bioinformatics.oxfordjournals.org/content/26/6/841.short)
Data availability
The NCBI SRC accession number for the MeDIP/hMeDIP experiments reported in this manuscript is BioProject PRJNA360149.
Extended Data
Extended Data Figure 1.
AOA reprograms TH17 cell differentiation toward ITreg cells. a. Screening procedure showing how the screening was conducted. b. Effects of AOA on TH17 cell differentiation. c, The effect of AOA on mTOR, AMPK, and c-Myc. Differentiating TH17 cells (with or without 0.75 mM AOA) were collected for analyzing p-AMPK1a, mTOR downstream signaling proteins, S6K, 4E-BP1 or c-Myc. d, The effect of AOA on the proliferation of TH17 cells. CD4 naive T cells were labeled with cell tracer violet, and then cultured under TH17 condition or ITreg condition (the same condition as TH17 condition except without IL-1β, IL-6 and IL-23). At the end of experiment, the cells were analyzed by intracellular staining. e) AOA promoted ITreg cell differentiation. f) AOA did not affect the survival of TH17 cell culture. The cells were differentiated under TH17 condition with or without AOA. At the end of differentiation, the cells were collected for analysis immediately after 7-AAD was added into cell culture.
Extended Data Figure 2.
15N-labeling analysis showed that Got1 mediates the majority of transamination and represents the main target for AOA in TH17 cells. a) Schematic of how 15N-α-glutamine was metabolized in transamination reaction. b) The ratios of 15N-labeled amino acids to their respective intracellular amino acid pool (related to Fig. 1f). Differentiating TH17 cells or iTreg cells (68 hours) were fed with 2 mM 15N-α-glutamine for 4 hours. The cells were collected for intracellular metabolites analysis. The ratios of 15N labeled aspartate, glycine, alanine, serine to their total respective amino acid pools were calculated. c, AOA, as a pan-tranaminase inhibitor, inhibited de novo synthesis for several amino acids (via transamination) in both cell types in addition to aspartate. The ratio of 15N-amino acid to 15N-glutamate was calculated, and this ratio was further normalized to that in TH17 cells to reflect that AOA inhibited de novo synthesis for several amino acids. Although, AOA indeed inhibited de novo synthesis for several amino acids (via transamination) in both cell types, our rescue results clearly showed (in figure 2f and 2g) that dimethyl α-KG can largely rescued the effect of AOA on both TH17 and iTreg cell differentiation. Thus, from a metabolic perspective, AOÀs effect can be largely attributed to its inhibitory effect on α-KG formation (carbon metabolism), rather than its inhibitory effect on amino acid synthesis (nitrogen metabolism). Therefore, we are focusing on carbon metabolism of glutamate in this study. d, Got1 is the main target for AOA in TH17 cells. Differentiating TH17 cells were infected with retrovirus containing shRNA against Got1 or control shRNA. The GFP+ cells were then purified on day 3, and further cultured under TH17 condition with/or without AOA. At the end of differentiation (day 6), the cells were collected for analysis of FOXP3 and IL-17 by intracellular staining. It is clear that AOA can further inhibit TH17 cell differentiation, however, the effect is quite subtle, which supported the conclusion that Got1 is the main target for AOA under TH17 condition. Bar Graphs in b and c are mean±S.D. of 3 technical replicates from a representative experiment. Representative flow data are presented in d, the experiment was repeated twice.
Extended Data Figure 3.
Metabolic profiling of TH17 cells and iTreg cells. a) Intracellular metabolites profiling of differentiating TH17 cells and iTreg cells performed by LC/MS.
* refer to the metabolites with differential abundance between TH17 cells and iTreg cell, which is inhibited by AOA. b) 2-HG concentration is much higher in differentiating TH17 cells than IiTreg cells along differentiation time line. c) AOA significantly increased 2-HG, while does not affect the level of L-Lactic acid, glutathione, oxidized glutathione, L- aspartate, slightly decrease α-KG, slightly increase glutamate related to Extended Data Fig. 3a. The relative levels of 2-HG, L-lactic acid, L-glutamate, glutathione, oxidized glutathione, L-aspartate and α-KG from Extended Data Fig.3a were re-plotted in c. The data shown in b and c are mean±S.D. of three replicates from a representative experiment of three independent experiments.
Extended Data Figure 4.
Exogenously added α-KG and 2-HG rescued the effects of AOA on TH17 and iTreg cell differentiation related to Fig. 2f and 2g. a), Cell-permeable dimethyl esters of succinate, fumarate, malate, citrate, NAC or GSH, did not rescue the inhibitory effects of AOA on TH17 cell differentiation. Cell-permeable metabolites (0.75 mM α-KG, 0.5 mM 2-HG, 0.5 mM succinate, 50 μM fumarate, 0.5 mM malate, 0.5 mM citrate, 1 mM NAC, and 1 mM GSH) were individually added to differentiating TH17 cells in the presence of AOA. At the end of differentiation (day 6), the cells were re-stimulated and analyzed by intracellular staining of FOXP3 and IL-17. b) Cell-permeable dimethyl esters of α-KG, 2-HG, but not succinate, fumarate, malate or citrate rescued the effects of AOA on iTreg cell differentiation. Cell permeable metabolites (0.5 mM succinate, 50 μM fumarate, 0.5 mM malate, 0.5 mM citrate) were individually added to differentiating iTreg cells in the presence of AOA. At the end of differentiation (day 5), the cells were directly analyzed for FOXP3-GFP. The representative flow data from 3 independent experiments were shown in a and b (left panel). Bar graphs in the right panel of a and b are mean±S.D. of 3 independent experiments. NS=non-significant; *P<0.05; **P<0.01; ***P<0.001 by Student`s t-test.
Extended Data Figure 5.
The effect of cell-permeable metabolites (α-KG, 2-HG, citrate, succinate, fumarate, malate) on the differentiation of TH17 or iTreg cells. a) Indicated dimethyl metabolites were added into TH17 culture, and the cells were analyzed on day 4 by intracellular staining of FOXP3 and IL-17. b) The indicated metabolites were added into iTreg culture, and the cells were analyzed on day 5 by intracellular staining of FOXP3 and IL-17. c, and d, 2-HG did not affect cell proliferation and survival. c, CD4 naive T cells were labeled with cell tracer violet according to manufacturès protocol. The cells were then differentiated under TH17 condition. The cells were then stimulated and collected for intracellular staining at day 4. The example flow data was plotted in different format. d, CD4 naive T cells from double reporter mice were differentiated under TH17 condition, and live cells were analyzed at day 4. 7-AAD was added right before analysis. The representative flow data from three independent experiments are shown in a and b (right panel). Bar graph in the right panel of a and b are mean±S.D. of three independent experiments. NS=non-significant; *P<0.05; **P<0.01; ***P<0.001 by Student`s t-test.
Extended Data Figure 6.
Differentiating TH17 cells highly expressed IDH1 and IDH2, and shRNA against IDH1 or IDH2 effectively suppressed the expression of IDH1 and IDH2, decreased DNA methylation at FOXP3 locus, and suppressed TH17 cell differentiation. a) Differentiating TH17 cells or iTreg cells (day 3) were collected for mRNA expression analysis. All expression levels were normalized to β-actin, and the expression level of each enzyme was normalized to that in differentiating iTreg cells. b) Differentiated TH17 cells and iTreg cells have similar expression of IDH3. The experiment was done exactly in a. Expression of IDH3 subunits was normalized to β-actin, and further plotted as relative level to that gene expression in iTreg cells. c. Knockdown of IDH1 and/or IDH2 efficiently suppressed the mRNA expression of IDH1 and IDH2, and Il17a, Il17f, and increases FOXP3 mRNA expression. Infected cells (GFP+ cells) containing shRNA against IDH1 or 2 were FACS sorted and re-stimulated with anti-CD3 and anti-CD28 for mRNA expression analysis. Expression was normalized to β-actin. d, knockdown of IDH1 and 2 decreased methylation level at FOXP3 locus. Differentiating TH17 cells were infected with retrovirus containing ShGot1 or control shRNA. At the end of differentiation (day 6), the GFP+ cells were collected for DNA methylation analysis of FOXP3 promoter and its intronic CpG island by bisulfate sequencing.  , methylated cytosine;
  , demethylated cytosine; male mice were used due to X-chromosome inactivation. e, KD of IDH1/2 suppressed TH17 cell differentiation, which can be reversed by adding back R-2-HG. R-2-HG was added into differentiating TH17 cells at 6 hr. The cells were infected with retrovirus containing shRNA, GFP+ cells were purified at day 3 for further culture under TH17 condition, and R-2-HG was added into the culture till the end of experiments. Then, the cells were collected for analysis of FOXP3 and IL-17. f, KD of IDH1 or 2 has very minimal effect on HIF1α expression. Differentiating TH17 cells were infected with retrovirus containing shRNA or shGot1. The cells were then purified at the end of experiment for analyzing IDH1, IDH2, and HIF1α expression. Mean±S.D.(n=3) of three technical replicates from a representative experiments of three experiments were shown in a, b, and c. Bar graph in e (n=3) is mean±S.D. of three independent experiments. *P<0.05; **P<0.01; ***P<0.001 by Student`s t-test.
Extended Data Figure 7.
Tet1/2 controls FOXP3 expression during TH17 cell differentiation. a, Tet1/2 DKO promoted TH17 cell differentiation, and largely abrogated the promoting effect of R-2-HG on TH17 cell differentiation in WT T cells. CD4 naive T cells from Tet1/2 DKO or control mice were differentiated under TH17 condition with or without R-2-HG. At day 4, the cells were collected for analysis of FOXP3 and IL-17 by intracellular staining. Our result clearly showed that Tet1/2 DKO accelerated TH17 cells differentiation, consistent with previous study showing that Tet1/2 DKO regulatory T cells can be more easily and efficiently converted into TH17 cells1. b, Tet1/2 DKO partially diminished the inhibitory effect of AOA on TH17 Cell differentiation. CD4 naive T cells from Tet1/2 DKO or control mice were differentiated under TH17 condition with or without AOA. At the end of differentiation (day 6), the cells were collected for analysis of FOXP3 and IL-17. c) Reduced TGFβ concentration largely abolished the effect of Tet1/2 DKO on TH17 cell differentiation, and Tet1/2 DKO even decreased IL-17 expression when TGFβ concentration is low enough, indicating Tet1/2 proteins have a dual function in the fate determination of TH17 cell differentiation. CD4 naive T cells derived from Tet1/2 DKO mice or control mice were differentiated under TH17 condition with varied concentration of TGFβ. The cells were collected for intracellular analysis at day 4. Previous study showed that Tet2 positively regulate TH17 differentiation by binding to the Il17 gene locus. However, our studies showed that Tet1/2 DKO T cells enhanced TH17 differentiation, as determined by increased IL-17 and reduced FOXP3 expression at day 4 in TH17 culture. Considering that the Tet enzyme activity is very sensitive to various exogenous stimuli as described before2. We speculate that the discrepancy between our studies and Ichiyama et al’s study could be caused by different culture condition, in which our TH17 polarizing condition yielded high amount of FOXP3 even at later stage of TH17 differentiation (day 4). To test this possibility, we reduced the amount of TGFβ used in our cultures, consistent with Ichiyama et al’s finding, Tet1/2 DKO caused a significant reduction of TH17 differentiation when TGFβ concentration is low enough (Extended Data Fig 7c). A possible explanation is that high TGFβ condition induced strong and persistent activation of Smad3 and STAT5, which then recruit Tet proteins as reported to the Foxp3 gene locus and promote its expression by inducing or maintaining the demethylation status1, whereas at low TGFβ condition, the recruitment of Tet enzymes to the Il17 gene locus plays a dominant role in regulating TH17 differentiation. Our study thus identified dual-functions of Tet proteins in fate determination of TH17 differentiation. In summary, the role of Tet1/2 during TH17 cell differentiation is dynamic and dependent on the interplay between these targets. When FOXP3 expression is high (due to high TGFβ level or at early stage of TH17 cell differentiation), Tet1/2 proteins suppress IL-17 expression indirectly through increased FOXP3 expression. When FOXP3 expression is low (due to low TGFβ level, therefore much less Tet1–2 will be recruited to FOXP3 locus or at the very late stage of TH17 cell differentiation due to the selective antagonistic effect of the accumulated 2-HG on FOXP3 expression), Tet1–2 positively regulate TH17 cell differentiation. Representative flow data from five (a), three (b) or two (c) independent experiments are shown. Bar graph in right panel of a (n=5) or b (n=3) is combination of five (a) or three (b) independent experiments and presented as mean±S.D. Mean±S.D. of 3 technical replicates (n=3) from a representative experiment of two independent experiments is shown in right panel of c. NS=non-significant, *P<0.05; **P<0.01; ***P<0.001 by Student`s t-test.
Extended Data Figure 8.
AOA and R-2-HG selectively affected DNA hydroxymethylation and methylation at FOXP3 locus, but not other important lineage specific signature gene loci examined by (h)MeDIP-seq. a, and b, Exogenous addition of dimethyl R-2-HG selectively decreases 5hmC signal and increase 5mC signal at FOXP3 locus. DNA extracted from differentiating TH17 cells (day 4) in the absence or presence of 0.75 mM dimethyl R-2-HG were immunoprecipitated with antibodies to 5hmC (a) or 5 mC (b), followed by deep sequencing. The sequence data were analyzed as described in method, and differential peaks from hMeDIP were plotted in a. 5hmC peaks located in FOXP3 conservative region or in other conservative regions at Il4, Il5, Il13, Il10, IFNγ, Rorc, etc. were highlighted. Peak 1,2,11 were located in Gata3; peak 3 in Rorc, peak 4 in Il4, peak 5,16 in Il10, peak 6 in IFNγ, peak 7 and 10 in Il5, peak 8, and 9 in Tbx21, peak 12 in Il13, peak 13,15 in Il17a, peak 14 in Il17f. Among 330, 582 peaks detected, R-2-HG decreased 5hmC signal in 17,676 peaks, however, R-2-HG did not decrease DNA hydroxymethylation at Il4, Il5, Il10, Il13, Il17a/f, IFNγ, Rorc, Tbx21 loci. b, Further analysis of 5mC signal in these 17,676 peaks, 3,402 peaks exhibited increased 5mC signal. Apparently, R-2-HG indeed selectively decreased 5hmC signal and increased 5mC signal at FOXP3 promoter and CNS2 region, but did not affect 5hmC or 5mC signal at IFNg, Il4/5/10/13, Il17a/f, Tbx21, Rorc. Notably, exogenous dimethyl R-2-HG did not affect 5hmC or 5mC signal only at FOXP3 locus, rather it had a more broad effect at many loci. c, and d, AOA treatment selectively affect DNA hydroxymethylation and methylation at FOXP3 locus. DNA extracted from TH17 culture in the absence or presence of 0.75 mM AOA were immunoprecipitated with antibodies to 5hmC (c) or 5mC (d), followed by deep sequencing. The sequence data were analyzed as described, and differential peaks were plotted. 5hmC peaks located in FOXP3 conservative region or in other conservative regions at Il4, Il5,Il13, Il10, IFNγ, Rorc, etc. were highlighted, the labels are the same as in a. Among 330, 582 peaks detected, AOA increased 5hmC signal in 11,896 peaks. Consistently, AOA increase hydroxymethylation at FOXP3 promoter and CNS2 region, but AOA did not affect DNA hydroxymethylation at IFNү, Il4, Il5, Il10, Il13, Rorc, Tbx21, etc. Notably, AOA treatment reduced 5hmC signal at Il17a/f loci, probably due to the antagonistic effect of FOXP3 on Rorүt to recruit Tet proteins to Il17a/f loci. d, Further analysis of 5mC signal in these 11,896 peaks, 1643 peaks exhibited increased 5mC signal. Apparently, AOA indeed decreased 5mC signal at FOXP3 promoter. Notably, the changes in 5mC signal at FOXP3 CNS2 region was unable to be detected, probably due to the fact that CNS2 region is largely methylated (around 70–80% of it is methylated in iTregs), and changes in 5mC is more subtle and difficult to be detected than 5hmC. Notably, both AOA and 2-HG affected 5hmC signal, but not 5mC signal at Gata3, indicating that AOA and 2-HG indeed have a minimal effect on DNA methylation at Gata3 locus. However, Gata3 expression is not regulated by DNA hydroxymethylation as shown in previous study, therefore 2-HG and AOA are unlikely to affect Gata3 expression. e, 17,676 peaks with increased 5hmC signal by AOA (from a, blue) is overlapped with 11,896 peaks with decreased 5hmC signal by 2-HG (from c, green). f, 3402 peaks with increased 5mC by 2-HG (from b, purple) overlapped with 1643 peaks with decreased 5mC signal by AOA (from d, red). These epigenetics analysis clearly showed that the effect of AOA and 2-HG on Foxp3 vs. other T-lineage related genes is highly selective, despite their more broad effects on genome-wide DNA methylation and hydroxymethylation. Although demethylation at FOXP3 locus promotes FOXP3 expression, expression of many other genes is not regulated by DNA demethylation, such as Rorc, Gata33. Treatment of T cells with AOA under TH17 condition stabilizes FOXP3 expression, while not having much effect on the expression of other lineage-specific transcription factors, such as Gata3, Rorc. FOXP3 can antagonize the function of RORγt to suppress expression of TH17 signature genes as well as recruit Dnmt1 to the gene loci of proinflammatory cytokines or signature genes to promote methylation at these loci, suppressing their expression4. In addition, FOXP3 functions as both a transcriptional activator to directly activate its target genes required for ITreg cell differentiation/function, and a transcriptional repressor to directly suppress the genes associated with effector T cell function, resulting in ITreg cell fate5.
Extended Data Figure 9.
KD of Got1 using 2nd shRNA targeting Got1 ameliorated mouse EAE disease in TH17 polarized adoptive transfer EAE (related to Figure 4). The disease score was recorded in a and presented as mean±S.D. *P<0.05; **P<0.01; ***P<0.001 by Student`s t-test. CNS infiltrated T cells were analyzed (Gated on Thy1.1+ cells), and representative flow data were shown in b. The statistics for CNS infiltrated T cells is in c and presented as mean±S.D. *P<0.05; **P<0.01; ***P<0.001 by Student`s t-test. d, Quantification of cell number infiltrated into CNS regions. e, Diagram shows our working mechanistic model. The cell number in Fig 4d–g was retrieved from the FACS data. In this experiment, we did not count the number of individual populations, but we did notice that the total cells infiltrating into the CNS was reduced by shGot1 KD, based on our flow cytometry data that recovery of shGot1 group cells were below 50,000 cells, while every control mice recovered more than 50,000 cells. Thus, for mice receiving T cells infected with shRNA control virus, cell number was calculated from FACS-acquired 50,000 total live cells (this group of mice have much higher number of total infiltrated cells, and we stopped acquiring after the live cells reached 50,000 threshold during FACS running). Mice receiving T cells infected with Got1 shRNA virus have much less cells infiltrated into CNS, and harvested cells from CNS did not reach 50,000 threshold when run out all the samples during FACS running, therefore, the cell numbers represent all the cells infiltrated into CNS region. Despite not very accurate, shGot1 decreased total absolute number of cells infiltrated into CNS. For other two EAE experiments, we counted cell numbers right after we isolated cells from CNS.
Supplementary Material
Footnotes
The authors declare no competing financial interests.
Readers are welcome to comment on the online version of the paper. Publishers note: Springer Nature remains neutral with regard to jurisdictional claims in published maps and institutional affiliations.
Reference
- 1.Wellen KE & Thompson CB, A two-way street: reciprocal regulation of metabolism and signalling. Nat Rev Mol Cell Biol 13 (4), 270–276 (2012). [DOI] [PubMed] [Google Scholar]
- 2.Lu C & Thompson CB, Metabolic regulation of epigenetics. Cell Metab 16 (1), 9–17 (2012). [DOI] [PMC free article] [PubMed] [Google Scholar]
- 3.Kaelin WG Jr. & McKnight SL, Influence of metabolism on epigenetics and disease. Cell 153 (1), 56–69 (2013). [DOI] [PMC free article] [PubMed] [Google Scholar]
- 4.Pearce EL, Poffenberger MC, Chang CH, & Jones RG, Fueling immunity: insights into metabolism and lymphocyte function. Science 342 (6155), 1242454 (2013). [DOI] [PMC free article] [PubMed] [Google Scholar]
- 5.Pearce EL & Pearce EJ, Metabolic pathways in immune cell activation and quiescence. Immunity 38 (4), 633–643 (2013). [DOI] [PMC free article] [PubMed] [Google Scholar]
- 6.Wang R & Green DR, Metabolic checkpoints in activated T cells. Nat Immunol 13 (10), 907–915 (2012). [DOI] [PubMed] [Google Scholar]
- 7.Shi LZ et al. , HIF1alpha-dependent glycolytic pathway orchestrates a metabolic checkpoint for the differentiation of TH17 and Treg cells. J Exp Med 208 (7), 1367–1376 (2011). [DOI] [PMC free article] [PubMed] [Google Scholar]
- 8.Berod L et al. , De novo fatty acid synthesis controls the fate between regulatory T and T helper 17 cells. Nat Med (2014). [DOI] [PubMed] [Google Scholar]
- 9.Dong C, TH17 cells in development: an updated view of their molecular identity and genetic programming. Nat Rev Immunol 8 (5), 337–348 (2008). [DOI] [PubMed] [Google Scholar]
- 10.Littman DR & Rudensky AY, Th17 and regulatory T cells in mediating and restraining inflammation. Cell 140 (6), 845–858. [DOI] [PubMed] [Google Scholar]
- 11.Yang XO et al. , Molecular antagonism and plasticity of regulatory and inflammatory T cell programs. Immunity 29 (1), 44–56 (2008). [DOI] [PMC free article] [PubMed] [Google Scholar]
- 12.DeBerardinis RJ et al. , Beyond aerobic glycolysis: transformed cells can engage in glutamine metabolism that exceeds the requirement for protein and nucleotide synthesis. Proc Natl Acad Sci U S A 104 (49), 19345–19350 (2007). [DOI] [PMC free article] [PubMed] [Google Scholar]
- 13.Son J et al. , Glutamine supports pancreatic cancer growth through a KRAS-regulated metabolic pathway. Nature 496 (7443), 101–105 (2013). [DOI] [PMC free article] [PubMed] [Google Scholar]
- 14.Wise DR et al. , Hypoxia promotes isocitrate dehydrogenase-dependent carboxylation of alpha-ketoglutarate to citrate to support cell growth and viability. Proc Natl Acad Sci U S A 108 (49), 19611–19616 (2011). [DOI] [PMC free article] [PubMed] [Google Scholar]
- 15.Terunuma A et al. , MYC-driven accumulation of 2-hydroxyglutarate is associated with breast cancer prognosis. J Clin Invest 124 (1), 398–412 (2014). [DOI] [PMC free article] [PubMed] [Google Scholar]
- 16.Zhou L et al. , TGF-beta-induced Foxp3 inhibits T(H)17 cell differentiation by antagonizing RORgammat function. Nature 453 (7192), 236–240 (2008). [DOI] [PMC free article] [PubMed] [Google Scholar]
- 17.Yang R et al. , Hydrogen Sulfide Promotes Tet1- and Tet2-Mediated Foxp3 Demethylation to Drive Regulatory T Cell Differentiation and Maintain Immune Homeostasis. Immunity 43 (2), 251–263 (2015). [DOI] [PMC free article] [PubMed] [Google Scholar]
- 18.Yue X et al. , Control of Foxp3 stability through modulation of TET activity. J Exp Med 213 (3), 377–397 (2016). [DOI] [PMC free article] [PubMed] [Google Scholar]
- 19.Kim HP & Leonard WJ, CREB/ATF-dependent T cell receptor-induced FoxP3 gene expression: a role for DNA methylation. J Exp Med 204 (7), 1543–1551 (2007). [DOI] [PMC free article] [PubMed] [Google Scholar]
- 20.Xu T et al. , Ursolic acid suppresses interleukin-17 (IL-17) production by selectively antagonizing the function of RORgamma t protein. J Biol Chem 286 (26), 22707–22710 (2011). [DOI] [PMC free article] [PubMed] [Google Scholar]
- 21.Bettelli E et al. , Myelin oligodendrocyte glycoprotein-specific T cell receptor transgenic mice develop spontaneous autoimmune optic neuritis. J Exp Med 197 (9), 1073–1081 (2003). [DOI] [PMC free article] [PubMed] [Google Scholar]
- 22.Munger J et al. , Systems-level metabolic flux profiling identifies fatty acid synthesis as a target for antiviral therapy. Nat Biotechnol 26 (10), 1179–1186 (2008). [DOI] [PMC free article] [PubMed] [Google Scholar]
- 23.Buescher JM, Moco S, Sauer U, & Zamboni N, Ultrahigh performance liquid chromatography-tandem mass spectrometry method for fast and robust quantification of anionic and aromatic metabolites. Anal Chem 82 (11), 4403–4412 (2010). [DOI] [PubMed] [Google Scholar]
Associated Data
This section collects any data citations, data availability statements, or supplementary materials included in this article.
Supplementary Materials
Data Availability Statement
The NCBI SRC accession number for the MeDIP/hMeDIP experiments reported in this manuscript is BioProject PRJNA360149.


