

Summary
Objective:
Osteophyte formation is a critical part of the degeneration of a joint with osteoarthritis (OA). While often qualitatively described, few studies have succeeded in quantifying osteophyte growth over time. Using computed tomography (CT) image data from a longitudinal, observational study of thumb carpometacarpal (CMC) OA, our aim was to quantify osteophyte growth volume and location over a three-year period in men and women.
Method:
Ninety patients with early thumb OA were recruited and assessed at baseline, 1.5 years, and 3 years with CT imaging. Osteophyte volume and location on the trapezium and first metacarpal were determined using a library of 46 healthy subjects as a nonarthritic reference database.
Results:
There was a significant increase in osteophyte volume for women and men over the three-year follow-up in the trapezium (86.8mm3 to 120.5mm3 and 165.1mm3 to 235.3mm3, means respectively) and in the proximal metacarpal (63mm3 to 80.4mm3, and 115.8mm3 to 161.7mm3, respectively). The location of osteophyte initiation and growth was consistent across subjects and was located in non-opposing regions on the trapezium and first metacarpal. Osteophyte growth occurred about the radial and ulnar margins of the trapezial facet, while on the proximal metacarpal, growth occurred principally about the volar and dorsal margins of the facet.
Conclusion:
Osteophyte growth occurred in early thumb osteoarthritis over three years. Growth was localized in specific, non-opposing regions on the trapezium and metacarpal, raising intriguing questions about the triggers for their formation, whether the mechanisms are mechanical, biological or a combination of both.
Keywords: thumb, carpometacarpal, osteophytes, growth, volume
Introduction
Osteophytes are a sign of advancing joint degeneration in thumb carpometacarpal (CMC) osteoarthritis (OA), appearing radiographically with changes in joint space width and subchondral sclerosis1–3. Osteophytes may be an important clinical metric of OA disease progression. Osteophytes have been shown to better predict knee pain than joint space narrowing, which is currently the only validated measure of osteoarthritis disease progression4. Similarly, in a study of patients with hip osteoarthritis, patients who had radiographic evidence of OA but were pain-free had no broad signal changes in bone detected by MRI, while in a second group with persistent pain broad signal changes could be detected5. The authors proposed an association between bone signal changes on MRI and joint pain in the progression of hip OA5. Other studies have corroborated the association of pain with OA progression, as assessed by bony changes6–8, suggesting the pathophysiology of OA progression and joint pain may be due primarily to bony changes9. A recent study by Kroon et al. found that thumb pain was more strongly linked to osteophyte formation than to soft tissue inflammation, leading the authors to speculate that thumb OA may be a phenotype distinct from finger OA6.
Typically described as bony outgrowths, osteophytes are in fact osteochondral exostoses formed by cells in activated periosteum and/or synovium at the joint margins, which then proliferate, differentiate into chondrocytes, hypertrophy, and mineralize via endochondral ossification 10–12. Morphologically, mature osteophytes contain trabecular bone and marrow that is contiguous with the pre-existing subchondral bone, and they are capped with fibrocartilage11,13. Altered joint mechanics14–16 and aberrant biochemical signaling17,18 have each been proposed as initial triggers, however, it is likely both are involved. Osteophytes also alter joint surface area and shape, with implications of reducing articular contact stress at the joint due to increased surface area and motion at the joint due to impingement of the protruding osteophytes19–21.
Osteophytes reportedly form in a characteristic pattern in thumb CMC OA, which was initially described by North and Rutledge22 as part of an anatomic study of joint shape and trapeziometacarpal degeneration. Analyzing explanted trapeziae and metacarpals from 67 embalmed cadavers, they noted that osteophyte formation was earliest and “most severe” on the radial and ulnar margins of the trapezial articular facet, while metacarpal osteophytes appeared later and were most typically found on the dorsal and volar margins of the metacarpal facet. They depicted trapezial osteophytes as initially appearing at Eaton/Littler1 Stage II, growing in size and scope to eventually encircle the articular surface by Stage IV. Their description of metacarpal osteophytes was less detailed, noting only that they did not occur until Eaton/Littler Stage IV, late in the disease process. Subsequent authors have echoed aspects of North and Rutledge’s findings 3,23,24, with some suggesting that that there may be other patterns of degeneration24.
North and Rutledge’s22 work was important because it largely formed the basis for our current understanding of osteophyte evolution in thumb CMC OA. However, it is limited in that the study design was cross-sectional (of necessity) and the descriptions of osteophyte growth results were qualitative and generalized. It would be a significant advance to have longitudinal quantitative data on osteophyte size and location from patients repeatedly sampled as their joints deteriorated and their OA progressed. Moreover, North and Rutledge did not stratify their findings by sex, despite the fact that thumb CMC OA is substantially more prevalent in women than men25,26. It would be interesting to know if there were sex-related differences in the pattern and/or rate of osteophyte development. A more nuanced understanding of osteophyte growth and morphology should provide insight into their origin and role in the pathogenesis of thumb CMC OA.
The specific aims of this study were to quantify the volume and location of periarticular thumb CMC osteophytes as they emerge and grow during early OA development (i.e., in the first three years after presentation), and to determine if osteophyte volume differs between women and men. To accomplish these aims we utilized data from an ongoing longitudinal, CT image-based observational study of thumb CMC biomechanics and OA progression, in which thumb kinematics and CMC joint pathology were serially evaluated at the time of study enrollment (time 0), and at 1.5-year follow-up intervals. We hypothesized that there would be significant osteophyte growth over the three-year follow-up period and that volume growth would be proportionally greater in women than in men.
Methods
Study Subjects
After obtaining IRB approvals at Rhode Island Hospital and at Stanford University, 90 patients with early thumb CMC OA (early OA) and 46 healthy volunteers (non-OA) (Table 1) were recruited, consented, and enrolled into a large observational study on the role of biomechanics in thumb CMC OA progression (R01AR059185)27–36. The early OA cohort were patients who presented with basilar thumb pain and no or minimal radiographic changes (primarily modified Eaton Stage 0/1) . Hand-directed histories and physical exams were performed by board certified orthopedic hand surgeons, which included measurements of body mass index (BMI), tenderness to palpation (TTP) and the grind test (GT). Non-OA subjects were eligible if they had no history of thumb pain or radiographic evidence of CMC OA. Exclusion criteria for both cohorts included pre-existing conditions that could influence CMC joint morphology or function (e.g., traumatic injury, inflammatory arthritis, hand or thumb surgery, etc.). In the early OA cohort, examinations were scheduled at enrollment (baseline), and at 1.5 and 3-year follow-up visits. The trapeziae (TPM) and first metacarpals (MC1) of the non-OA subjects were used as a reference library to calculate osteophyte bone volumes described below.
Table 1.
Baseline cohort demographics (mean±SD) and physical examination (positive tenderness to palpation (TTP), positive grind test (GT)), reported as a percentage (%) within each cohort and sex. The values listed for the non-OA are those of the healthy reference library.
| Cohort | Sex | n | Age (yrs.) | BMI | TTP (%) | GT (%) |
|---|---|---|---|---|---|---|
| non-OA | Women | 25 | 41.9 ± 17.5 | 28.1 ± 7.1 | 0 | 0 |
| Men | 21 | 40.3 ± 19.0 | 25.2 ±3.7 | 0 | 0 | |
| OA | Women | 47 | 53.4 ± 5.9 | 25.9 ±5.8 | 62 | 17 |
| Men | 43 | 60.3 ±7.3 | 28.1 ±4.3 | 70 | 40 |
At each examination, posteroanterior, lateral, Robert’s, and stress view radiographs were acquired of the thumb. OA disease progression was determined by experienced hand surgeons (one at each study site) using a modified version of the 1987 Eaton-Glickel1,2 classification in which early-stage disease (Eaton I) was refined, subluxation was eliminated as a measure of progressive radiographic deterioration, and all four available radiographic views were included3. The modified Eaton classification addresses mild disease by designating normal contour and joint space as stage 0, and minimal joint findings as stage 1. Consistent with the Eaton-Glickel criteria, “joint debris” was used to define stages 2 and 3 (<2mm and >2mm, respectively), while stage 4 in the modified classification includes severe TMC disease plus sacaphotrapezoid and/or scaphotrapezial involvement, not just scaphotrapezial disease. The modified Eaton classification was reported to have a slightly higher ICC (0.83) amongst reviewers than the Eaton-Glickel classification (0.73)3.
CT Imaging
At each exam, the wrists and thumbs of the affected hands of the early OA subjects and the dominant hands of the non-OA subjects were CT-scanned in a braced neutral position (Rolyan® Original, Patterson Medical, Bolingbrook, IL) and in 11 additional range-of-motion or task-related positions 27, 28, 31, 37. Only CT images from the braced neutral scans were analyzed in this study. The scans were acquired with a 16-slice clinical scanner (GE LightSpeed 16, GE Medical, Milwaukee, WI) at tube settings for the neutral scan of 80kVp and 80mA. The resulting 3-D volume images had a resolution of 0.39mm × 0.39mm × 0.625mm. The mean effective radiation exposure for each 12-scan CT imaging session was 0.323 mSv, which is equivalent to less than two months of naturally occurring background radiation (3 mSv/year)38.
CT Imaging processing and data analysis
Digital bone models of the outer cortical surfaces of the trapeziae (TPM) and first metacarpals (MC1) were generated from the CT image volume via semi-automated segmentation with minimal smoothing (smoothing factor 0.030) (Mimics v12-20, Materialise, Leuven, Belgium). Models of the trapezium (OATPM) and first metacarpal (OAMC1, Figure 1A) bones were generated from the enrollment (time 0), year 1.5, and year 3 follow-up CT scans for the early OA cohort, and from the enrollment (time 0) CT scan for the non-OA cohort.
Figure 1.

Schematic of the algorithm for computing osteophyte growth volume and growth locations. Bone models of the first metacarpal (OAMC1) and trapezium (OATPM) for each patient at baseline (A) were fit with the entire library of non-OA bones. The non-OA bones with the lowest dissimilarity measures were identified as the patient’s reference bones (CkTPM and CjMC1, B). Boolean subtraction was applied and the resulting volume was trimmed by cross-sectional planes (STPM and SMC1, B) to generate the models of CMC osteophytes for the MC1 (OPMC1) and for the TPM (OPTPM)(C). To compute osteophyte volume and growth by location, the osteophyte models were segmented at intervals of 5° (Sθ, C) about the CMC (OPθMC1 and OPθTPM, D).
Osteophyte volumes for the trapezium (OPTPM) and first metacarpal (OPMC1, Figure 1C) were defined by intersecting (Boolean subtraction) the reference bone models and the early OA bone models at each time point. Specifically, the reference trapezium and first metacarpal models were selected for each early OA patient via least squares superimposition (rotation, translation, and scaling)39 of bone models from the non-OA cohort to the time 0 bone models from the early OA cohort, with local dysmorphologies excluded to optimize alignment of the overall bone shapes40–42. Each baseline early OA bone was fit with all 46 of the corresponding non-OA bones (trapezium and MC1) and the non-OA bone that yielded the smallest dissimilarity measure was selected as the reference bone (CkTPM and CjMC1, Figure 1B). A reference library of bone models was used because we did not want to assume that the time 0 early OA bones were pathology free and we did not have contralateral CT images to use as a healthy reference43. Rigid registration to each time 0 bone model was performed for all follow-up time points (Geomagic Wrap® 2017, 3D Systems, SC, USA). Boolean subtraction was used to generate closed surface models of the portions of the early OA bones that fell outside of the reference bone models. The closed surface models were truncated to limit analysis to the margins of the articular surfaces. The trapezial models were truncated with a cross-sectional plane (STPM, Figure 1B) that was located at the geometric centroid of the trapezium and aligned with the trapezial coordinate system, whose origin was located at the inflection point of the articular surface34. The MC1 models were truncated similarly, with a cross-sectional plane (SMC1, Figure 1B) offset from the MC1 coordinate system by the same distance as the corresponding trapezial centroid to coordinate system. To assess variations in bone shape that could potentially generate “false osteophytes” (e.g., an unusual bony prominence), this same process of registration and Boolean subtraction was used on each of the non-OA bone models.
Osteophyte volume was computed by integrating 44 the non-intersecting volumes (OPTPM and OPMC1, Figure 1C). To account for the greater bone size in men than in women, the osteophyte volumes of the trapezium (TPM OPvolnorm) and the proximal first metacarpal (MC1 OPvolnorm) were normalized by the subject’s total bone volumes at each time point and reported as a percentage (%) of total bone volume. To identify locations of differential osteophyte growth around the perimeter of the articular surface, the osteophyte growth models were divided into 72 five-degree (5°) arc segments (Sθ, Figure 1C) and the volume of each segment was calculated separately (OPθTPM and OPθMC1, Figure 1D). To describe the locations of osteophyte growth, the segmental osteophyte volumes were normalized by total bone volume and computed as a function of angular direction, where the key directions of 0°, 90°, 180°, 270° corresponded to volar, radial, dorsal, and ulnar, respectively, based upon the trapezial and MC1 coordinate systems34. Normalized growth locations were pooled for women and men as differences in the shape of the TPM and MC1, other than size, have not been reported45. The computed non-intersecting volumes of the non-OA cohort are provided for descriptive comparisons with the osteophyte volume and locations for the early OA cohort.
Statistical Analysis
This study is a secondary analysis of data collected for an ongoing, longitudinal, CT image-based observational study designed to identify the biomechanical predictors of thumb CMC OA initiation and progression (R01AR059185) 27–36 Differences in total bone volume, osteophyte volume, normalized osteophyte volume, and CMC OA radiographic progression were evaluated with mixed models that included random intercepts for subjects and fixed effects for time (modeled as a categorical variable with baseline, year 1.5, and year 3 as levels), sex (modeled as a dichotomous variable with male and female as levels), and the two-way time X sex interaction (Proc GLIMMIX in SAS version 9.4, SAS Institute Inc., Cary, NC). Mixed models were chosen as they allow appropriate handling of data structures associated with repeated measurements and maximize the information from subjects with missing observations. To satisfy the assumption of normality, bone volume, osteophyte volume, and normalized osteophyte volume were logarithmically transformed after examination of their distributions and model residuals. Classical sandwich estimators were used to protect against model misspecification. The Holm test was used for multiple comparisons, maintaining a 2-tailed familywise alpha at 0.05. Adjusted p-values and model-based means and 95% confidence intervals (CIs) are reported. Curves of normalized (as a percent of total bone volume) osteophyte segmental volume are plotted as a function of location about the joint circumference and reported with descriptive statistics (median, 25th percentile, and 75th percentile) at each time point.
Results
CMC OA progression was demonstrated radiographically, as the modified Eaton staging increased by approximately 8/10ths of a stage in women and men over the three-year study period (Table 2, P<0.0001 for both).
Table 2.
Modified Eaton radiographic classification3 at baseline and each follow-up exam, reported as a percentage (%) within each cohort, sex and time point. The values listed for the non-OA are those of the healthy reference library.
| Women | Men | |||||||||||||
|---|---|---|---|---|---|---|---|---|---|---|---|---|---|---|
| 0 | 1 | 2 | 3 | 4 | mean | n | 0 | 1 | 2 | 3 | 4 | mean | n | |
| non-OA | 84 | 16 | 0 | 0 | 0 | 0.16 | 25 | 95 | 5 | 0 | 0 | 0 | 0.05 | 21 |
| OA 0 yr | 38 | 62 | 0 | 0 | 0 | 0.62 | 47 | 19 | 79 | 2 | 0 | 0 | 0.84 | 43 |
| OA 1.5 yr | 29 | 40 | 26 | 5 | 0 | 1.07 | 42 | 7 | 43 | 40 | 10 | 0 | 1.52 | 42 |
| OA 3 yr | 17 | 45 | 19 | 17 | 2 | 1.43 | 42 | 15 | 28 | 33 | 23 | 0 | 1.64 | 39 |
From baseline (time 0) to the three-year follow-up time point, mean TPM total bone volume increased by approximately 4% for men and women (P<0.0001 for both) (Figure 2B, Table 3). Over this same three-year period there were also significant but smaller increases in MC1 total bone volume (1% in women and 3% in men; P=0.02 and P<0.0001, respectively) (Figure 2A). Total bone volume of the TPM and MC1 remained significantly larger in men than women (P<0.0001, for both).
Figure 2.

Total bone volume and osteophyte volume (OP) of the first metacarpal (MC1) (A and C) and the trapezium (TPM) (B and D) significantly increased over the three-year follow-up in women and men. At the three-year follow-up, total bone volume and osteophyte volume were significantly larger in men than in women. Model-based means and with their 95% CIs are plotted.
Table 3.
Minimum, maximum, median, 25th percentile, and 75th percentile of total bone volumes (mm3) of the trapezium (TPM) and first metacarpal (MC1). The values listed for the non-OA are those of the healthy reference library.
| Women | Men | |||||||||||
|---|---|---|---|---|---|---|---|---|---|---|---|---|
| TPM | min | max | median | 25th% | 75th% | n | min | max | median | 25th% | 75th% | n |
| non-OA | 1230.7 | 2682.1 | 1753.4 | 1332.1 | 2207.9 | 25 | 1775.8 | 3500.6 | 2472.4 | 1914.5 | 3013.1 | 21 |
| OA 0 yr | 1219.8 | 2549.2 | 1822.6 | 1457.0 | 2115.9 | 47 | 1942.8 | 3944.0 | 2829.3 | 2243.8 | 3328.7 | 43 |
| OA 1.5 yr | 1328.2 | 2554.4 | 1845.9 | 1475.8 | 2145.1 | 42 | 1986.5 | 3672.5 | 2892.9 | 2317.0 | 3314.6 | 42 |
| OA 3 yr | 1367.1 | 2708.1 | 1888.4 | 1488.3 | 2213.0 | 42 | 1998.5 | 3772.4 | 2921.8 | 2337.6 | 3405.9 | 39 |
| MC1 | min | max | median | 25th% | 75th% | n | min | max | median | 25th% | 75th% | n |
| non-OA | 2642.4 | 6881.7 | 4423.9 | 3307.4 | 5787.0 | 25 | 4575.7 | 8042.6 | 6188.9 | 4891.9 | 7352.9 | 21 |
| OA 0 yr | 3345.7 | 6274.1 | 4387.2 | 3665.2 | 5161.0 | 47 | 4589.7 | 8523.4 | 6725.7 | 5610.9 | 7752.4 | 43 |
| OA 1.5 yr | 3359.3 | 5958.5 | 4406.3 | 3682.6 | 5109.7 | 42 | 4605.5 | 8660.8 | 6786.8 | 5713.6 | 7780.3 | 42 |
| OA 3 yr | 3366.6 | 6289.7 | 4429.6 | 3686.3 | 5140.2 | 42 | 4771.6 | 8719.3 | 6799.3 | 5766.8 | 7877.3 | 39 |
The mean volume of osteophytes rimming the trapezial CMC facet at baseline was 86.8 mm3 in women (4.9% of total bone volume) and 165.1 mm3 in men (6% of total bone volume) (Figure 2D, Table 4). Similarly, mean osteophyte volume around the CMC facet of the MC1 was 63 mm3 in women (1% of total bone volume) and 116 mm3 in men (1.7% of total bone volume) at baseline) (Figure 2C, Table 4). By the three-year follow-up, mean TPM osteophyte volume increased significantly in women and men, to 120.5 mm3 and 235 mm3, respectively (P<0.0001 for both) (Figure 2D, Table 4). MC1 mean osteophyte volume also increased significantly in men and women, to 80.4 mm3 and 161.7 mm3, respectively, at the three-year follow-up (P=0.008 and P=0.0005, respectively) (Figure 2C, Table 4). At the three-year follow up, osteophyte volume for the TPM and MC1 remained significantly larger in men than women (P<0.0001 and P=0.0007, respectively).
Table 4.
Minimum, maximum, median, 5th percentile, and 75th percentile of osteophyte volume (mm3) of the trapezium (TPM) and first metacarpal (MC1). The values listed for the non-OA are those of the healthy reference library and represent volumes associated with variations in bone shapes across that cohort.
| Women | Men | |||||||||||
|---|---|---|---|---|---|---|---|---|---|---|---|---|
| TPM | min | max | median | 25th% | 75th% | n | min | max | median | 25th% | 75th% | n |
| non-OA | 36.8 | 117.2 | 59.2 | 39.3 | 92.6 | 25 | 60.6 | 163.5 | 109.1 | 69.3 | 136.7 | 21 |
| OA 0 yr | 38.5 | 414.9 | 79.7 | 21.2 | 176.7 | 47 | 59.9 | 802.5 | 163.3 | 25.2 | 364.9 | 43 |
| OA 1.5 yr | 36.3 | 279.9 | 100.4 | 35.5 | 210.9 | 42 | 58.2 | 719.5 | 187.0 | 61.6 | 383.1 | 42 |
| OA 3 yr | 46.0 | 357.8 | 108.4 | 35.0 | 239.1 | 42 | 62.7 | 764.4 | 236.0 | 65.3 | 461.3 | 39 |
| MC1 | min | max | median | 25th% | 75th% | n | min | max | median | 25th% | 75th% | n |
| non-OA | 6.3 | 116.1 | 43.2 | 16.6 | 82.3 | 25 | 34.3 | 224.2 | 72.2 | 29.2 | 138.6 | 21 |
| OA 0 yr | 10.6 | 381.4 | 59.0 | 4.7 | 155.5 | 47 | 29.2 | 560.5 | 119.7 | 24.1 | 260.7 | 43 |
| OA 1.5 yr | 4.7 | 402.8 | 79.1 | 7.3 | 195.3 | 42 | 20.9 | 607.7 | 149.3 | 35.5 | 309.1 | 42 |
| OA 3 yr | 6.6 | 400.1 | 83.7 | 9.5 | 201.1 | 42 | 13.7 | 460.6 | 176.8 | 54.8 | 335.0 | 39 |
After normalizing by total bone volume, osteophyte volumes remained significantly greater at the three-year follow-up than at baseline in women and men for the TPM and MC1 (TPM: P<0.0001 for women and men, MC1: P=0.01 and P=0.0009, respectively) (Figure 3). While the size of the osteophyte volumes as a percentage of total bone volume was consistently larger in men than in women throughout the study, these differences were not statistically significant for either the TPM or MC1 at the three-year follow-up (P=0.12 and P=0.49).
Figure 3.
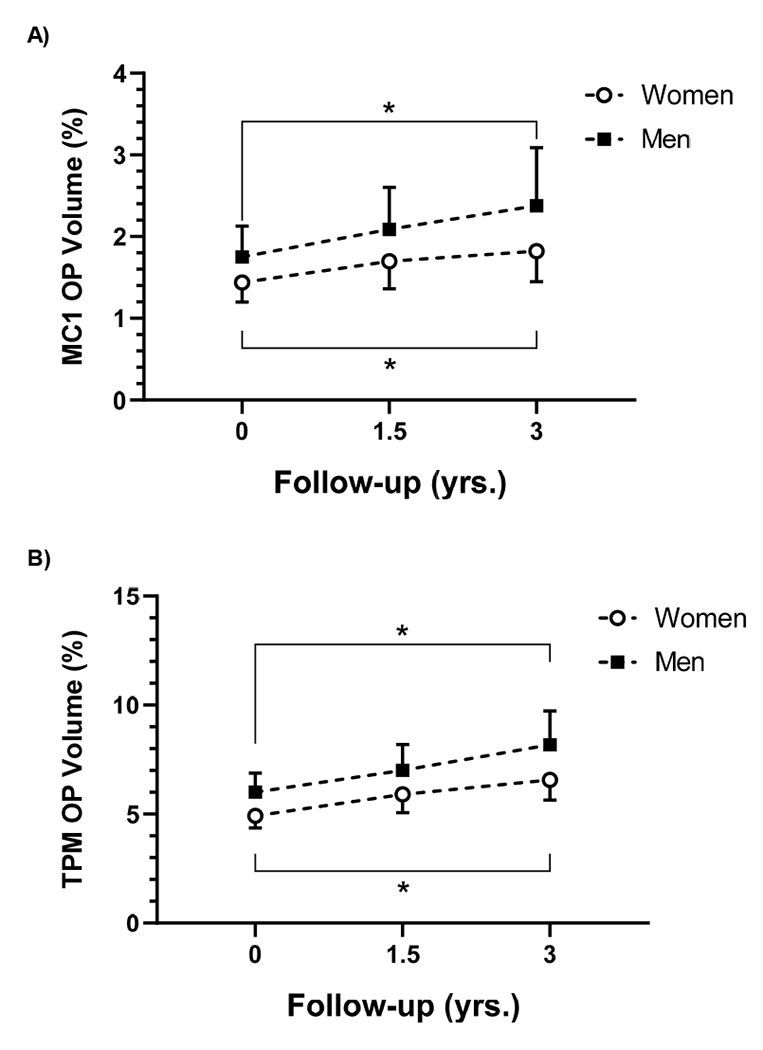
Osteophyte volume (OP) as a percentage of total bone volume increased significantly in women and men over the three-year follow up in the MC1 (A) and TPM (B). While men tended to have larger normalized OP volumes then women at all time points, the differences were not statistically significant. Model-based means and with their 95% CIs are plotted.
Osteophytes formed and grew in consistent, non-opposing patterns about the TPM and MC1 (Figure 4). Osteophyte formation was greatest on the radial and ulnar margins of the trapezial articular facet throughout the three-year observation period of the study (Figure 4B), and it was greatest on the dorsal and volar (beak) margins of the MC1 articular facet (Figure 4A). There was minimal osteophyte formation on the volar and dorsal margins of the TPM and minimal osteophyte formation on the radial and ulnar margins of the MC1 over the three-year course of the study. The minimal osteophyte volumes on these margins were comparable in magnitude to the normal variations in the bone shape of the non-OA subjects at these same margins.
Figure 4.

Osteophyte growth on the first metacarpal (MC1) (A) and on the trapezium (TPM) (B) progressed in non-opposing locations from 0 to 1.5 to 3 yrs. Osteophytes are described by their volume within 5° sections (Sectional OPvol) about each respective facet, normalized by total bone volume (%), and plotted as a function of location within a 360° arc. Locations are labeled by anatomical direction (volar (V), radial (R), dorsal (D), and ulnar (U)). The median (solid lines) and 75th percentile (dotted lines) OP volumes for the early OA cohort, pooled across men and women, are plotted for each follow-up time point. The median (solid line), 25th percentile, and 75th percentile (gray band) curves of the non-OA represent the volume of bone associated with shape variations within the reference library.
Discussion
In this study, osteophyte growth at the CMC joint in patients with early thumb CMC osteoarthritis was quantified using serial CT images acquired as part of a longitudinal study of CMC biomechanics and OA progression. Over the three-year observation period, significant osteophyte growth occurred. Osteophyte volume was greater in men than women, which was expected given that, on average, men have larger carpal bones than women.46 After normalizing for bone size, we did expect osteophyte growth to be greater in women than men, given the higher prevalence of thumb OA in women. However, we found no statistical sex-related differences in osteophyte volume. On the contrary, the normalized osteophyte volumes tended to be consistently greater in men (Figure 3A and 3B).
Our most interesting finding was the pattern of osteophyte growth. In our early OA patients, osteophytes formed and grew in highly localized non-opposing regions on each bone: on the ulnar and radial margins of the trapezial articular facet, and on the dorsal and volar margins of the MC1 facet. Growth locations did not differ between women and men. These findings are consistent with those described by North and Rutledge22. In the cadavers they identified as having Eaton Stage II disease, which is relatively early-stage, North and Rutledge described osteophyte formation on the radial and ulnar margins of the trapezium. With more advanced degeneration they depicted osteophytes expanding to encircle the trapezial facet. Our patients were recruited into the study at modified Eaton Stage 0/1, and by year three had, on average, not yet advanced to the point where their osteophyte growth encircled the facet. Osteophyte formation on the volar and dorsal aspect of the trapezium was minimal μ essentially comparable to that in the non-OA subjects (Figure 4) – suggesting they had not reached the level of pathology of North and Rutledge’s Stage III trapeziae. It is reassuring that the same general osteophyte patterning was obtained with two different experimental designs: North and Rutledge’s 22 cross-sectional analysis of cadaver specimens and our longitudinal study.
Our results are also generally consistent with those of Buckland-Wright et al.47, who radiographically studied osteophyte progression in patients with hand OA. They found that osteophytes at the thumb CMC joints were the largest compared to those of any other joint in the hand. Additionally, they found a high prevalence (≥17%) in the thumb CMC joint, and osteophytes on the radial and ulnar margins of the trapeziae. Buckland-Wright’s findings differ from ours in that they identified osteophytes on the radial and ulnar margins of the MC1, and they did not see significant progression over the 18-month duration of their study. Buckland-Wright et al. studied patients with long-standing disease (mean duration 11.6 ± 10 yrs), while we specifically recruited patients with early-stage disease, and this is likely one contributing factor to the differences in the findings. A potentially larger factor that remains to be more thoroughly examined is the correlation, or lack thereof, in defining osteophyte size and location on radiographs as opposed to 3D reconstructions from CT images.
The fact that osteophytes first form in consistent, non-opposing regions of the trapezium and MC1 is intriguing (Figure 4). Identifying the mechanism behind this could advance our understanding of the etiology and progression of OA. Potential mechanisms include altered mechanical stress at ligament and/or capsular insertions, altered contact stress, or variation in responsive cell populations. The stabilizing ligamentous structures of the CMC joint have been described48–51. The volar ligaments include the superficial and deep anterior oblique ligaments (AOL) and the ulnar collateral ligament. The dorsal ligaments include the dorsal trapeziometacarpal ligament, posterior oblique ligament, dorsal central ligament, and the dorsal radial ligament (DRL). The DRL originates from the dorsoradial tubercle of the trapezium and inserts on the dorsal edge of the first metacarpal base48. It is the widest, thickest, and shortest of the stabilizing ligaments, and thus postulated to play an important role in joint stabilization 48 as it also sustained the greatest ultimate load50. While there has been debate, the dorsal ligaments are now generally believed to act as the primary restraints to several movements51–53, including posterior shear, translation, and dislocation, with the volar AOL ligament serving as a thin tension band to support the dorsal restraints54. Regardless of the stabilizing role assigned to the ligaments, we postulate that they are the least likely explanation of the patterned growth because the insertion sites generally oppose one another across the CMC joint, which is not consistent with our observation of osteophyte growth at non-opposing locations.
On the TPM and MC1, osteophytes formed in regions with similar bony topology – at the margins of the apexes of the concave portions of the articular surfaces. This was first described by North and Rutledge22. We would describe these locations as having high convex curvature relative to the margins of the articular facets. Considering that stresses are developed in bones during activities, it is possible that the stresses developed in these bone regions yield higher bone strains than the concave regions of the rims of the articular facet, given their unique shape and location. If so, this would suggest an intriguing mechanism for osteophyte formation. A more detailed analysis, such as finite element modeling, could potentially shed light on the likelihood of this mechanism.
The net effect of non-opposing osteophyte formation, which exaggerates the normal saddle joint contour, may also result in a greater constraint of overall joint motion and increased mechanical stability of the joint itself. This could conceivably be answered with a well-designed cadaver study. It is also possible that osteophytes develop in specific areas due to differences in cell populations or tissue responsiveness to loading, but we have been unable to locate any information that details cell type by locations in these bones.
The rate of osteophyte growth increased with time (Figure 3). At year 3, osteophyte volume was approximately 6.4% and 8.2% of total TPM volume and 1.8% and 2.4% of the MC1 in women and men, respectively. While these values are a relatively small percentage of total bone volume, osteophyte growth was localized so the dimensions of the osteophytes at year three were typically in the range of a millimeter or greater. This is generally consistent with radiographically moderate (Stage II-III / Stage 2-3) thumb CMC OA 2,3 Mean osteophyte volumes tended to be larger in men than women, even after normalizing for the effects of bone size. This is surprising, given that the prevalence of thumb CMC OA is greater in women than men 25,55–57 in some reports by a ratio of ~2:1 25,26. It is also possible that this trend is simply an artifact of our sample populations since men were on average seven years older than the women. Additional studies will be needed to confirm (or refute) this observation.
When interpreting our findings, it should be noted that this study focused on reporting the growth and location of osteophytes only about the thumb CMC joint. We did not examine changes at the two other joints of the trapezium nor the distal joint of the first metacarpal. In our initial data analysis, we noted changes across the entire surface of both bones, therefore we truncated our bone models with cross-sectioning planes (Figure 1B) to focus this study on the CMC joint. Schneider et al. used time 0 image data from a subset of our study subjects to characterize morphological changes via statistical shape modeling32. They found that the trapeziae and first metacarpals in early OA patients were shorter and wider than healthy controls, and that their articular surfaces were wider and deeper. The morphological changes across the entire bones that may occur with disease progression remain to be examined.
The chief limitation of this study is that we did not have an age- and sex-matched group of healthy controls for comparison with our OA cohort, so we cannot definitively rule out the possibility that the changes we documented were associated with aging as opposed to osteoarthritis. However, when viewed in the context of the numerous animal and human studies that have examined osteophytes in OA, we think it is most likely that the bony changes we measured reflect OA progression16,58–60. A second limitation is that our Boolean subtraction approach to quantifying bone changes cannot automatically differentiate bone shape from minor osteophytes. However, we do not consider this insurmountable because the bone changes seen in the non-OA cohort are substantially smaller than those computed for the patients with early OA (refer to non-OAs in Table 4). Finally, factors confounding or correlating with osteophyte formation were not examined. Studies in animals and humans have reported that increased osteophyte formation is associated with decreased joint ROM and increased joint stability 15,21. Joint space narrowing has also been associated with osteophyte formation4. In the thumb CMC joint, the saddle-shaped geometry of the healthy joint and the subsequent changes in the shape of the joint space with OA progression 24 can confound the calculation of joint space narrowing. Future analyses will be needed to examine these relations with osteophyte growth at the CMC joint.
Acknowledgments
Role of funding sources
Research reported in this publication was supported by the National Institute of Arthritis and Musculoskeletal and Skin Diseases of the National Institutes of Health under Award Number R01 AR059185. The content is solely the responsibility of the authors and does not necessarily represent the official views of the National Institutes of Health.
Footnotes
Publisher's Disclaimer: This is a PDF file of an unedited manuscript that has been accepted for publication. As a service to our customers we are providing this early version of the manuscript. The manuscript will undergo copyediting, typesetting, and review of the resulting proof before it is published in its final citable form. Please note that during the production process errors may be discovered which could affect the content, and all legal disclaimers that apply to the journal pertain.
Conflict of interest
We declare no conflict of interests.
References
- 1.Eaton RG, Littler JW. Ligament reconstruction for the painful thumb carpometacarpal joint. J Bone Joint Surg Am. 1973;55(8):1655–1666. [PubMed] [Google Scholar]
- 2.Eaton RG, Glickel SZ. Trapeziometacarpal osteoarthritis. Staging as a rationale for treatment. Hand Clin. 1987;3(4):455–471. [PubMed] [Google Scholar]
- 3.Ladd AL, Messana JM, Berger AJ, Weiss A-PC. Correlation of clinical disease severity to radiographic thumb osteoarthritis index. J Hand Surg Am. 2015;40(3):474–482. doi: 10.1016/j.jhsa.2014.11.021 [DOI] [PMC free article] [PubMed] [Google Scholar]
- 4.Cicuttini FM, Baker J, Hart DJ, Spector TD. Association of pain with radiological changes in different compartments and views of the knee joint. Osteoarthr Cartil. 1996;4(2):143–147. [DOI] [PubMed] [Google Scholar]
- 5.Kamimura M Joint Pain Undergoes a Transition in Accordance with Signal Changes of Bones Detected by MRI in Hip Osteoarthritis. The Open Rheumatology Journal. 2013;7(1):67–74. doi: 10.2174/1874312920130823002 [DOI] [PMC free article] [PubMed] [Google Scholar]
- 6.Kroon FPB, van Beest S, Ermurat S, Kortekaas MC, Bloem JL, Reijnierse M, et al. In thumb base osteoarthritis structural damage is more strongly associated with pain than synovitis. Osteoarthr Cartil. 2018;26(9):1196–1202. doi: 10.1016/j.joca.2018.04.009 [DOI] [PubMed] [Google Scholar]
- 7.Kato H Knee Joint Pain Potentially Due to Bone Alterations in a Knee Osteoarthritis Patient. American Journal of Case Reports. 2014;15:534–537. doi: 10.12659/AJCR.891233 [DOI] [PMC free article] [PubMed] [Google Scholar]
- 8.Komatsu M, Kamimura M, Nakamura Y, Mukaiyama K, Ikegami S, Hayashi M, et al. Bony findings detected by MRI may reflect the pathophysiology of osteoarthritis with thumb carpometacarpal joint pain. Int J Rheum Dis. 2017;20(12):1950–1957. doi: 10.1111/1756-185X.12781 [DOI] [PubMed] [Google Scholar]
- 9.Kamimura M, Nakamura Y, Uchiyama S, Ikegami S, Mukaiyama K, Kato H. The Pathophysiology and Progression of Hip Osteoarthritis Accompanied with Joint Pain are Potentially Due to Bone Alterations - Follow-up Study of Hip OA Patients. Open Rheumatol J. 2014;8:46–53. doi: 10.2174/1874312901408010046 [DOI] [PMC free article] [PubMed] [Google Scholar]
- 10.Moskowitz RW, Goldberg VM. Osteophyte evolution: studies in an experimental partial meniscectomy model. J Rheumatol. 1987;14 Spec No:116–118. [PubMed] [Google Scholar]
- 11.van der Kraan PM, van den Berg WB. Osteophytes: relevance and biology. Osteoarthr Cartil. 2007;15(3):237–244. doi: 10.1016/j.joca.2006.11.006 [DOI] [PubMed] [Google Scholar]
- 12.Menkes CJ, Lane NE. Are osteophytes good or bad? Osteoarthr Cartil. 2004;12 Suppl A:S53–54. [DOI] [PubMed] [Google Scholar]
- 13.Wong SHJ, Chiu KY, Yan CH. Review Article: Osteophytes. J Orthop Surg (Hong Kong).2016;24(3):403–410. doi: 10.1177/1602400327 [DOI] [PubMed] [Google Scholar]
- 14.Nagaosa Y, Lanyon P, Doherty M. Characterisation of size and direction of osteophyte in knee osteoarthritis: a radiographic study. Ann Rheum Dis. 2002;61(4):319–324. doi: 10.1136/ard.61.4.319 [DOI] [PMC free article] [PubMed] [Google Scholar]
- 15.Pottenger LA, Phillips FM, Draganich LF. The effect of marginal osteophytes on reduction of varus-valgus instability in osteoarthritic knees. Arthritis Rheum. 1990;33(6):853–858. [DOI] [PubMed] [Google Scholar]
- 16.Felson DT, Gale DR, Elon Gale M, Niu J, Hunter DJ, Goggins J, et al. Osteophytes and progression of knee osteoarthritis. Rheumatology (Oxford). 2005;44(1):100–104. doi: 10.1093/rheumatology/keh411 [DOI] [PubMed] [Google Scholar]
- 17.Uchino M, Izumi T, Tominaga T, Wakita R, Minehara H, Sekiguchi M, et al. Growth factor expression in the osteophytes of the human femoral head in osteoarthritis. Clin Orthop Relat Res. 2000;(377):119–125. [DOI] [PubMed] [Google Scholar]
- 18.van Beuningen HM, Glansbeek HL, van der Kraan PM, van den Berg WB. Osteoarthritis419 like changes in the murine knee joint resulting from intra-articular transforming growth factor-beta injections. Osteoarthr Cartil. 2000;8(1):25–33. doi: 10.1053/joca.1999.0267 [DOI] [PubMed] [Google Scholar]
- 19.Brandt KD. Osteophytes in osteoarthritis. Clinical aspects. Osteoarthr Cartil. 1999;7(3):334–335. doi: 10.1053/joca.1998.0187 [DOI] [PubMed] [Google Scholar]
- 20.Ritter MA, Harty LD, Davis KE, Meding JB, Berend ME. Predicting range of motion after total knee arthroplasty. Clustering, log-linear regression, and regression tree analysis. Bone Joint Surg Am. 2003;85-A(7):1278–1285. [DOI] [PubMed] [Google Scholar]
- 21.Hsia AW, Anderson MJ, Heffner MA, Lagmay EP, Zavodovskaya R, Christiansen BA. Osteophyte formation after ACL rupture in mice is associated with joint restabilization and loss of range of motion. J Orthop Res. 2017;35(3):466–473. doi: 10.1002/jor.23252 [DOI] [PMC free article] [PubMed] [Google Scholar]
- 22.North ER, Rutledge WM. The trapezium-thumb metacarpal joint: the relationship of joint shape and degenerative joint disease. Hand. 1983;15(2):201–206. [DOI] [PubMed] [Google Scholar]
- 23.Pellegrini VD. Osteoarthritis of the trapeziometacarpal joint: The pathophysiology of articular cartilage degeneration. I. Anatomy and pathology of the aging joint. The Journal of Hand Surgery. 1991;16(6):967–974. doi: 10.1016/S0363-5023(10)80054-1 [DOI] [PubMed] [Google Scholar]
- 24.Van Nortwick S, Berger A, Cheng R, Lee J, Ladd AL. Trapezial topography in thumb carpometacarpal arthritis. J Wrist Surg. 2013;2(3):263–270. doi: 10.1055/s-0033-1350088 [DOI] [PMC free article] [PubMed] [Google Scholar]
- 25.Dahaghin S, Bierma-Zeinstra SMA, Ginai AZ, Pols HAP, Hazes JMW, Koes BW. Prevalence and pattern of radiographic hand osteoarthritis and association with pain and disability (the Rotterdam study). Ann Rheum Dis. 2005;438 64(5):682–687. doi: 10.1136/ard.2004.023564 [DOI] [PMC free article] [PubMed] [Google Scholar]
- 26.Sodha S, Ring D, Zurakowski D, Jupiter JB. Prevalence of osteoarthrosis of the trapeziometacarpal joint. J Bone Joint Surg Am. 2005;87(12):2614–2618. doi: 10.2106/JBJS.E.00104 [DOI] [PubMed] [Google Scholar]
- 27.Crisco JJ, Halilaj E, Moore DC, Patel T, Weiss A-PC, Ladd AL. In Vivo kinematics of the trapeziometacarpal joint during thumb extension-flexion and abduction-adduction. J Hand Surg Am. 2015;40(2):289–296. doi: 10.1016/j.jhsa.2014.10.062 [DOI] [PMC free article] [PubMed] [Google Scholar]
- 28.Halilaj E, Rainbow MJ, Got C, Schwartz JB, Moore DC, Weiss A-PC, et al. In vivo kinematics of the thumb carpometacarpal joint during three isometric functional tasks. Clin Orthop Relat Res. 2014;472(4):1114–1122. doi: 10.1007/s11999-013-3063-y [DOI] [PMC free article] [PubMed] [Google Scholar]
- 29.Halilaj E, Moore DC, Patel TK, Laidlaw DH, Ladd AL, Weiss A-PC, et al. Older asymptomatic women exhibit patterns of thumb carpometacarpal joint space narrowing that precede changes associated with early osteoarthritis. J Biomech. 2015;48(13):3643–3649. doi: 10.1016/j.jbiomech.2015.08.010 [DOI] [PMC free article] [PubMed] [Google Scholar]
- 30.Crisco JJ, Patel T, Halilaj E, Moore DC. The Envelope of Physiological Motion of the First Carpometacarpal Joint. J Biomech Eng. 2015;137(10):101002. doi: 10.1115/1.4031117 [DOI] [PMC free article] [PubMed] [Google Scholar]
- 31.Halilaj E, Laidlaw DH, Moore DC, Crisco JJ. How Do Sex, Age, and Osteoarthritis Affect Cartilage Thickness at the Thumb Carpometacarpal Joint? Insights from Subject-Specific Cartilage Modeling In: Tavares JMRS, Luo X, Li S, eds. Bio-Imaging and Visualization for Patient-Customized Simulations. Lecture Notes in Computational Vision and Biomechanics. Cham, Switzerland: Springer International Publishing; 2014:103–111. doi: 10.1007/978-3-319-03590-1_9 [DOI] [Google Scholar]
- 32.Schneider MTY, Zhang J, Walker CG, Crisco JJ, Weiss A-PC, Ladd AL, et al. Early morphologic changes in trapeziometacarpal joint bones with osteoarthritis. Osteoarthritis and Cartilage. 2018;26(10):1338–1344. doi: 10.1016/j.joca.2018.06.008 [DOI] [PMC free article] [PubMed] [Google Scholar]
- 33.McQuillan TJ, Kenney D, Crisco JJ, Weiss A-P, Ladd AL. Weaker Functional Pinch Strength Is Associated With Early Thumb Carpometacarpal Osteoarthritis. Clin Orthop Relat Res. 2016;474(2):557–561. doi: 10.1007/s11999-015-4599-9 [DOI] [PMC free article] [PubMed] [Google Scholar]
- 34.Halilaj E, Rainbow MJ, Got CJ, Moore DC, Crisco JJ. A thumb carpometacarpal joint coordinate system based on articular surface geometry. J Biomech. 2013;46(5):1031–1034. doi: 10.1016/j.jbiomech.2012.12.002 [DOI] [PMC free article] [PubMed] [Google Scholar]
- 35.Halilaj E, Moore DC, Patel TK, Ladd AL, Weiss A-PC, Crisco JJ. Early osteoarthritis of the trapeziometacarpal joint is not associated with joint instability during typical isometric loading. J Orthop Res. 2015;33(11):1639–1645. doi: 10.1002/jor.22936 [DOI] [PMC free article] [PubMed] [Google Scholar]
- 36.McQuillan TJ, Vora MM, Kenney DE, Crisco JJ, Weiss A-PC, Ebert KA, et al. The AUSCAN and PRWHE Demonstrate Comparable Internal Consistency and Validity in Patients With Early Thumb Carpometacarpal Osteoarthritis. Hand (N 475 Y). 2018;13(6):652–658. doi: 10.1177/1558944717729217 [DOI] [PMC free article] [PubMed] [Google Scholar]
- 37.Halilaj E, Moore DC, Patel TK, Ladd AL, Weiss A-PC, Crisco JJ. Early osteoarthritis of the trapeziometacarpal joint is not associated with joint instability during typical isometric loading. J Orthop Res. 2015;33(11):1639–1645. doi: 10.1002/jor.22936 [DOI] [PMC free article] [PubMed] [Google Scholar]
- 38.Biswas D, Bible JE, Bohan M, Simpson AK, Whang PG, Grauer JN. Radiation exposure from musculoskeletal computerized tomographic scans. J Bone Joint Surg Am. 2009;91(8):1882–1889. doi: 10.2106/JBJS.H.01199 [DOI] [PubMed] [Google Scholar]
- 39.Manu. nonrigidICP. MATLAB Central File Exchange. https://www.mathworks.com/matlabcentral/fileexchange/41396-nonrigidicp Published 2019. Accessed March 1, 2019.
- 40.Claes P, Daniels K, Walters M, Clement J, Vandermeulen D, Suetens P. Dysmorphometrics: the modelling of morphological abnormalities. Theor Biol Med Model. 2012;9:5. doi: 10.1186/1742-4682-9-5 [DOI] [PMC free article] [PubMed] [Google Scholar]
- 41.Morton A An Approach to Quantifying Osteophyte Formation with OA Progression of the Thumb Carpometacarpal Joint. Unpublished study. [Google Scholar]
- 42.Van Haver A, Mahieu P, Claessens T, Li H, Pattyn C, Verdonk P, et al. A statistical shape model of trochlear dysplasia of the knee. The Knee. 2014;21(2):518–523. doi: 10.1016/j.knee.2013.11.016 [DOI] [PubMed] [Google Scholar]
- 43.Oura K, Moritomo H, Kataoka T, Oka K, Murase T, Sugamoto K, et al. Three-dimensional analysis of osteophyte formation on distal radius following scaphoid nonunion. J Orthop Sci. 2017;22(1):50–55. doi: 10.1016/j.jos.2016.06.018 [DOI] [PubMed] [Google Scholar]
- 44.Eberly D, Lancaster J, Alyassin A. On gray scale image measurements: II. Surface area and volume. CVGIP: Graphical Models and Image Processing. 1991;53(6):550–562. doi: 10.1016/1049-9652(91)90005-5 [DOI] [Google Scholar]
- 45.Schneider MTY, Zhang J, Crisco JJ, Weiss APC, Ladd AL, Nielsen P, et al. Men and women have similarly shaped carpometacarpal joint bones. J Biomech. 2015;48(12):3420–3426. doi: 10.1016/j.jbiomech.2015.05.031 [DOI] [PMC free article] [PubMed] [Google Scholar]
- 46.Crisco JJ, Coburn JC, Moore DC, Upal MA. Carpal bone size and scaling in men versus in women. J Hand Surg Am. 2005;30(1):35–42. doi: 10.1016/j.jhsa.2004.08.012 [DOI] [PubMed] [Google Scholar]
- 47.Buckland-Wright JC, Macfarlane DG, Lynch JA. Osteophytes in the osteoarthritic hand: their incidence, size, distribution, and progression. Ann Rheum Dis. 1991;50(9):627–630. [DOI] [PMC free article] [PubMed] [Google Scholar]
- 48.Bettinger PC, Linscheid RL, Berger RA, Cooney WP, An KN. An anatomic study of the stabilizing ligaments of the trapezium and trapeziometacarpal joint. J Hand Surg [Am]. 1999;24:786–798. [DOI] [PubMed] [Google Scholar]
- 49.Pellegrini VD. Pathomechanics of the thumb trapeziometacarpal 510 joint. Hand Clin. 2001;17:175–184, vii–viii. [PubMed] [Google Scholar]
- 50.Bettinger PC, Berger RA. Functional ligamentous anatomy of the trapezium and trapeziometacarpal joint (gross and arthroscopic). Hand Clin. 2001;17(2):151–168, vii. [PubMed] [Google Scholar]
- 51.Ladd AL, Lee J, Hagert E. Macroscopic and Microscopic Analysis of the Thumb Carpometacarpal Ligaments: A Cadaveric Study of Ligament Anatomy and Histology. The Journal of Bone & Joint Surgery. 2012;94(16):1468–1477. doi: 10.2106/JBJS.K.00329 [DOI] [PMC free article] [PubMed] [Google Scholar]
- 52.Hagert E, Lee J, Ladd AL. Innervation patterns of thumb trapeziometacarpal joint ligaments. J Hand Surg Am. 2012;37(4):706–714.e1. doi: 10.1016/j.jhsa.2011.12.038 [DOI] [PubMed] [Google Scholar]
- 53.Halilaj E, Rainbow MJ, Moore DC, Laidlaw DH, Weiss A-PC, Ladd AL, et al. In vivo recruitment patterns in the anterior oblique and dorsoradial ligaments of the first carpometacarpal joint. J Biomech. 2015;48(10):1893–1898. doi: 10.1016/j.jbiomech.2015.04.028 [DOI] [PMC free article] [PubMed] [Google Scholar]
- 54.Zhang AY, Van Nortwick S, Hagert E, Yao J, Ladd AL. Thumb carpometacarpal ligaments inside and out: a comparative study of arthroscopic and gross anatomy from the robert a. Chase hand and upper limb center at stanford university. J Wrist Surg. 2013;2(1):55–62. doi: 10.1055/s-0033-1333683 [DOI] [PMC free article] [PubMed] [Google Scholar]
- 55.Haara MM, Heliövaara M, Kröger H, Arokoski JPA, Manninen P, Kärkkäinen A, et al. Osteoarthritis in the carpometacarpal joint of the thumb. Prevalence and associations with disability and mortality. J Bone Joint Surg Am. 2004;86-A(7):1452–1457. [DOI] [PubMed] [Google Scholar]
- 56.Kellgren JH, Lawrence JS. Osteo-arthrosis and disk degeneration in an urban population. Ann Rheum Dis. 1958;17(4):388–397. [DOI] [PMC free article] [PubMed] [Google Scholar]
- 57.Haugen IK, Englund M, Aliabadi P, Niu J, Clancy M, Kvien TK, et al. Prevalence, incidence and progression of hand osteoarthritis in the general population: the Framingham Osteoarthritis Study. Ann Rheum Dis. 2011;70(9):1581–1586. doi: 10.1136/ard.2011.150078 [DOI] [PMC free article] [PubMed] [Google Scholar]
- 58.Turmezei TD, Poole KES. Computed Tomography of Subchondral Bone and Osteophytesin Hip Osteoarthritis: the Shape of Things to Come? Front Endocrinol (Lausanne). 2011;2. doi: 10.3389/fendo.2011.00097 [DOI] [PMC free article] [PubMed] [Google Scholar]
- 59.Bechtold TE, Saunders C, Decker RS, Um H-B, Cottingham N, Salhab I, et al. Osteophyte formation and matrix mineralization in a TMJ osteoarthritis mouse model are associated with ectopic hedgehog signaling. Matrix Biol. 2016;52–54:339–354. doi: 10.1016/j.matbio.2016.03.001 [DOI] [PMC free article] [PubMed] [Google Scholar]
- 60.Junker S, Krumbholz G, Frommer KW, Rehart S, Steinmeyer J, Rickert M, et al. Differentiation of osteophyte types in osteoarthritis - proposal of a histological classification. Joint Bone Spine. 2016;83(1):63–67. doi: 10.1016/j.jbspin.2015.04.008 [DOI] [PubMed] [Google Scholar]