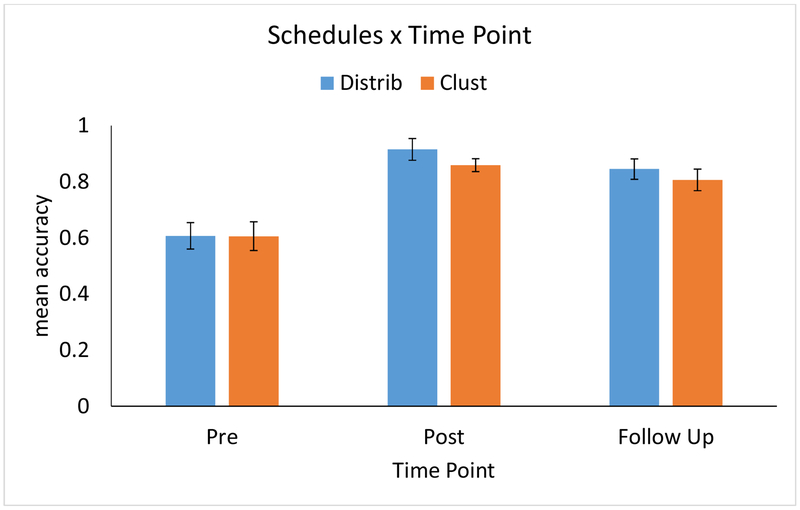
Figure B2.
Effect of schedules across Pre, Post, and Follow-up, plotting raw data (mean accuracy). Error bars reflect standard error of the mean (N = 11). For a depiction of the LMEM analysis results, which control for covariates, refer to Figure 6 in the text.

