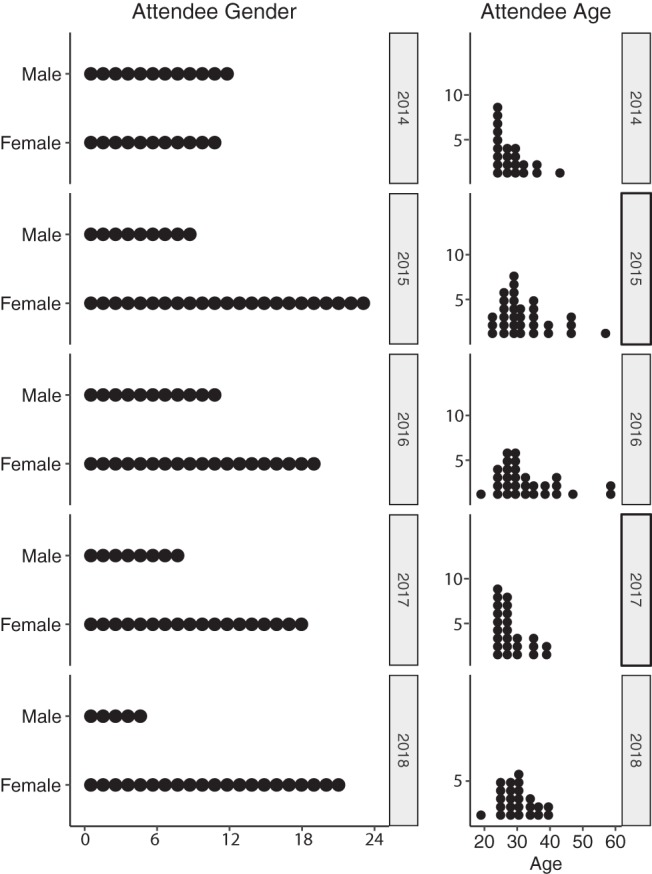
FIG 2.

Distributions of EDAMAME learner sex and age (in years), 2014 to 2018. Data were collected and summarized from pre- and postworkshop assessments. One participant is shown by one dot, and the numbers of participants are on the x axis in the left panel and the y axis in the right panel.
