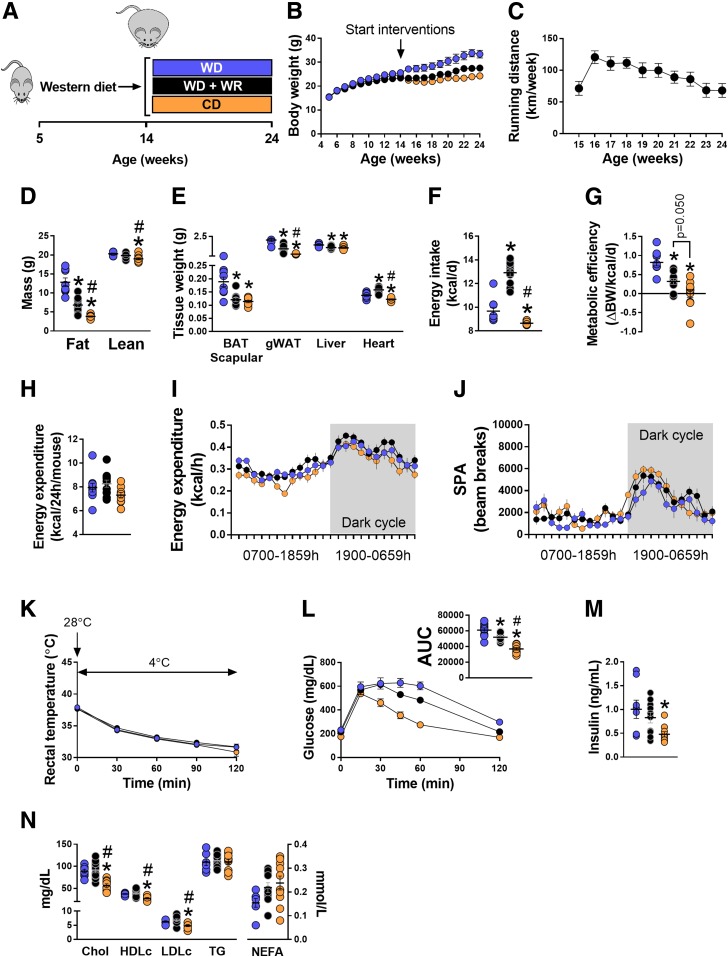
Figure 4.
Effects of voluntary exercise and low-fat diet on energy homeostasis and glucose tolerance in mice with diet-induced obesity. A: Experimental design. Five-week-old mice were fed a WD for 9 weeks. Thereafter, animals were allocated to one of the following groups: WD, WD+WR, and switched from a WD to a CD (n = 9–11/group). B and C: Weekly body weights and weekly running distance (n = 9–11/group). Running wheels were connected to a Sunding bicycle computer (SD-548B; Dongguan Sunding Electron Co., TangXia, DongGuan, China) for determination of weekly running distance. Odometers were checked daily and reset every week. D: Fat mass and lean mass via EchoMRI (n = 9–11/group). E: Organ/tissue weights (n = 9–11/group). F and G: Energy intake and metabolic efficiency (n = 9–11/group). H: Total EE assessed via metabolic cages. Data are presented as kcal/h/mouse (n = 8–11/group). I and J: Mean 24-h EE and spontaneous physical activity (SPA) tracings via metabolic chambers. Dark cycle is shaded in gray (n = 8–11/group). K: Acute CTT. Baseline rectal temperature measurements were recorded in home cages (28°C). Thereafter, mice were placed in environmental cold chambers (4°C) and rectal temperature measurements were taken every 30 min for 120 min (n = 5–9/group). L: GTT with glucose AUC (n = 9–11/group). M and N: Plasma insulin, cholesterol, and lipid concentrations (n = 8–10/group). Data are means ± SE. *P < 0.05 vs. WD; #P < 0.05 vs. WD+WR. BW, body weight; Chol, total cholesterol; d, day; HDLc, HDL cholesterol; LDLc, LDL cholesterol; NEFA, nonesterified fatty acid.

