

Abstract
There is wide variance among individuals in the fraction of insulin cleared by the liver (20% to 80%). Hepatic insulin clearance is 67% lower in African Americans than European Americans. Clearance is also lower in African American children 7–13 years of age. Lower hepatic insulin clearance will result in peripheral hyperinsulinemia: this exacerbates insulin resistance, which stresses the β-cells, possibly resulting in their ultimate failure and onset of type 2 diabetes. We hypothesize that lower insulin clearance can be a primary cause of type 2 diabetes in at-risk individuals.
Introduction
The underlying cause(s) of type 2 diabetes remain in debate, even today. Years ago, this debate was highly contentious. Methodology to measure insulin action either in vivo or in vitro induced some to promote insulin resistance as the primary cause of type 2 diabetes (1). It was clearly demonstrated that most type 2 patients were profoundly insulin resistant, as were those at risk for the disease (2). To maintain glucose tolerance, insulin resistance requires enhanced β-cell function, often reflected in elevated plasma insulin in those at risk for the disease (3). Obesity per se, a strong risk factor for type 2 diabetes, is also associated with and likely causative for insulin resistance (4). Thus, a significant body of researchers has put enormous energy into understanding mechanisms underlying insulin resistance at the cellular level, investigating factors such as receptor number or affinity (5,6), defects in insulin signaling in skeletal muscle (7) and liver (8), and recently mitochondrial dysfunction (9). Other systemic factors that can contribute include neural mechanisms (10) as well as glucotoxicity and lipotoxicity (11). It is not possible to overestimate the energy and treasure that has been put forth to understand insulin resistance in those at risk for diabetes at the systemic and cellular levels. Clearly the body of investigators studying this problem deserve our gratitude and congratulations for the insights that have emerged from their studies.
Despite this great effort, there is not yet a consensus that insulin resistance per se is the primary cause underlying type 2 diabetes. In fact, many obese individuals are resistant to insulin equally to those with diabetes, yet significant numbers of very insulin-resistant individuals do not have the disease (12). In addition, few signals for insulin resistance per se have emerged from genome-wide association studies of type 2 diabetes. According to the latest reports, a total of 403 genetic variants are increasing the risk of type 2 diabetes, and these gene variants explain about 20% of the risk. The effect of insulin resistance on the risk is mainly “acquired” in the sense that lifestyle factors, including, e.g., “unhealthy diet” and lack of exercise, negatively affect insulin sensitivity (13,14). Therefore, to understand the pathogenesis of type 2 diabetes, factors other than insulin resistance per se—namely, β-cell function and insulin clearance—must be considered.
β-Cell Failure
The explicit role of β-cell failure in type 2 diabetes has long been controversial. One improvement in understanding emerged from the definition of the “disposition index” (15), which explained the progress of diabetes as being due to reduction in the ability of the β-cells to compensate for insulin resistance (16,17) (see Fig. 1A). There is little debate now that both insulin resistance, possibly environmental/lifestyle-related, and β-cell failure, possibly genetic, contribute to the pathogenesis of the disease. Of course, the underlying causes of these particular defects remain obscure and under intensive study.
Figure 1.

A: Ethnic differences in the relationship between insulin sensitivity and insulin response in normal glucose tolerance (NGT) cohorts. Scatter plot of insulin sensitivity vs. acute insulin response (AIRg) measured in NGT (healthy) African, Caucasian, and East Asian cohorts. Each circle represents one study cohort. Circle area is proportional to cohort sample size. The solid line is the curve calculated in the meta-analysis [ln(AIRg) = –0.915 × ln(SI) – 2.82]. The dashed line is the curve of Kahn et al. (17) describing healthy individuals who were primarily Caucasian [ln(AIRg) = –1.0 × ln(SI) – 3.80]. Adapted with permission from Kodama et al. (16). B: Fasting insulin may increase under conditions associated with the progression of diabetes. However, longitudinal data supporting this latter supposition are not available. FBS, fasting blood glucose. Adapted with permission from Pories et al. (19). C: Correlation between the nocturnal area under the curve (AUC) of nonesterified fatty acids (NEFA) and AIRg; n = 8. Individual animals are represented by the same geometrical shapes; gray shapes indicate week 8 when animals received nocturnal injections of GS-9667; P < 0.01. Adapted with permission from Broussard et al. (21).
Hypersecretion
Barbara Corkey suggested, in a highly influential publication (18), that hypersecretion of insulin and the resulting hyperinsulinemia might be a cause of diabetes. This was consistent with data showing increased fasting insulin levels as severity of disease progresses, from normal to impaired glucose tolerance, to type 2 diabetes itself (Fig. 1B) (19). However, the data in Fig. 1B are not longitudinal, leaving open the question of whether there is a progression of hyperinsulinemia as disease progresses.
Part of Dr. Corkey’s theory that hyperinsulinemia is due to hypersecretion depends upon the argument that the signal between insulin resistance per se and increased insulin, as is reflected in the hyperbolic curve (Fig. 1A), is not known (18).
We have performed a series of experiments that support the concept that the signal between insulin resistance and hyperinsulinemia could be nocturnal free fatty acids (FFA) (Fig. 1C) (20). When we reversed the increase in FFA that occurs at night (21), hyperinsulinemic compensation was reversed. Whether nighttime FFA is part of or all of the signal responsible for hyperinsulinemic compensation for insulin resistance requires further study. Interestingly, this leads to a double-edged sword hypothesis, whereby the rise in nocturnal FFA is at least partly responsible for hyperinsulinemia, but FFA also induce insulin resistance (22). That we do not know the feedback signal between insulin resistance and islet function does not necessarily support the concept of hypersecretion; clearly, more research needs to be done in this important area to identify this as-yet-unknown signal. When the feedback signal between insulin-sensitive tissues and β-cell response (the “compensatrin”) is identified, it will be possible to address the question of whether the increased compensatrin can account for the putative hypersecretion of insulin in those at risk for type 2 diabetes. Until then, we must regard the concept that hypersecretion by the β-cells results in hyperinsulinemia as unproven, allowing us to consider other factors that can lead to hyperinsulinemia.
Insulin Clearance
The concentration of any soluble molecule in blood is determined by a balance between release and disappearance. With regard to many hormones, the release from a gland into the bloodstream, as well as the disappearance from the bloodstream, occur in different tissues. Often, binding to albumin will have a significant effect on the disappearance rate. Insulin, as is well known, has a unique and somewhat peculiar pattern of disappearance. Insulin is soluble in blood and is secreted entirely by the β-cells of the pancreas. However, when insulin is released into the abdominal portal vein via the pancreatic veins, it immediately enters the liver. We know that only a fraction of the newly secreted insulin enters the general circulation, as about half of the secreted insulin is cleared by the liver and never enters the systemic circulation (23).
The late Dr. Robert Turner posed the following question to me some decades ago, speaking in evolutionary terms: why is such a large fraction of secreted insulin cleared during the hormone’s first passage through the liver? That is, is there a teleological “reason” for this strange evolutionary design in terms of protection of the organism?
Insulin clearance has been studied for many years by outstanding investigators. Dr. Sonia Najjar, in particular, has investigated the specific roles of CEACAM1 and IDE in the degradation of insulin in the rodent model (24). It has been demonstrated that hepatic insulin clearance is impaired in mice with liver-specific CEACAM1 inactivation (L-SACC1) or global mutation (Cc1−/−) and hyperinsulinemia and insulin resistance are promoted (24,25). Furthermore, hepatic CEACAM1 levels decreased in humans with insulin resistance, obesity, and fatty liver disease (26). Our group has also been interested in insulin clearance, although our investigations have been done in a large animal, i.e., the dog, to explore the role of insulin clearance in metabolic regulation. Consistent with Dr. Najjar’s data, we showed that metabolic clearance rate as well as CEACAM1-P/ CEACAM1 and IDE gene and protein expressions decreased in the fat-fed dog (27). Insulin clearance has, in fact, been identified as a highly heritable trait in genome-wide linkage analysis (14). We believe our studies have revealed interesting information regarding physiological regulation of day-to-day insulin clearance, which may lead to a new and provocative hypothesis regarding the pathogenesis of type 2 diabetes (see below).
Accurate Measurement of Insulin Clearance
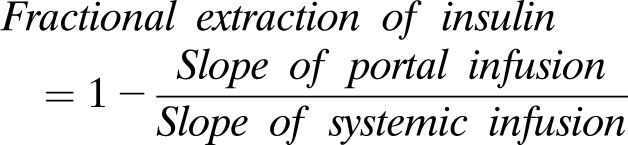
While insulin is substantially cleared by liver, its cosecreted protein, C-peptide, is not (28). Many years ago, Phillip Eaton and David Schade introduced a model-based methodology for estimating insulin clearance (29). Although this method was validated in the canine model (30), it requires assumed values for C-peptide clearance in humans (31). We introduced an alternative, more direct method for assessing insulin clearance that is applicable to the canine. In our method, we compare the infusion of insulin into the systemic circulation of the animal, with infusion directly into the abdominal portal vein. The latter infusion is done at twice the rate, thus yielding a similar systemic insulin level, as about half the insulin infused into the portal vein is degraded on first pass and does not reach the systemic circulation (32). The result of dose-response infusion is represented in Fig. 2. Note the lesser slope of the line relating insulin infusion rate to resulting plasma insulin concentration with intraportal insulin infusion, due to the first-pass clearance of insulin by the liver. With this direct infusion method, it is possible to obtain a quantitative value for insulin clearance by the liver alone; the percent fractional disappearance is calculated as:
 |
Using this direct measurement, we were surprised to discover that even in a population of normal animals, there was a remarkable variance in first-pass hepatic insulin extraction, varying over a 3.5-fold range: from 22% to 77%, with a 20% coefficient of variation among individuals (33). Statistical analysis and repeated measurements support the reproducibility of this measurement in a single individual, with a measurement coefficient of variation of 3–12% (33). Thus, direct measures of insulin clearance revealed that this parameter is highly variable, even in a normal population. To further understand this variability, we applied a similar portal/peripheral infusion technique to animals rendered insulin resistant by a high-fat diet. Twelve weeks on such a diet lowered fractional insulin clearance from 60% to 44% (20). Our experiments showed first that insulin clearance is highly variable in a normal population and second that environmental factors, such as diet, can change clearance in a predictable fashion. We have also shown that fasting insulin levels and insulin sensitivity correlate strongly with first-pass hepatic extraction (33). Thus, hyperinsulinemia in a prediabetes population (cf. above, Fig. 1B) is very likely due to variation in insulin clearance rates.
Figure 2.

Paired portal/peripheral insulin infusion (PPII) clamp for measuring first-pass hepatic insulin extraction. A: Insulin profile during the PPII experiments. For portal infusion protocol (white circles), insulin 1 = 3.0 pmol ⋅ kg−1 ⋅ min−1, insulin 2 = 6.0 pmol ⋅ kg−1 ⋅ min−1, and insulin 3 = 9.0 pmol ⋅ kg−1 ⋅ min−1. For peripheral infusion protocol (black quares), insulin 1 = 1.5 pmol ⋅ kg−1 ⋅ min−1, insulin 2 = 3.0 pmol ⋅ kg−1 ⋅ min−1, and insulin 3 = 4.5 pmol ⋅ kg−1 ⋅ min−1. One-half of the portal infusion rates were used in the peripheral protocol for matching systemic concentrations. B: Infusion rate vs. steady-state plasma insulin concentrations. Correlation coefficient r for peripheral infusion vs. steady-state concentrations (black squares) was 0.99, and slope, mpe, was 53.1 kg ⋅ min−1 ⋅ L−1. For portal infusion vs. steady-state concentrations (white circles), r = 0.98 and slope, mpo, was 26.7 kg ⋅ min−1 ⋅ L−1. First-pass hepatic insulin extraction (%) = [1 − (mpo/ mpe)] ⋅ 100 = 50%. Each data point is a mean ± SE of n = 9. Adapted with permission from Asare-Bediako et al. (33).
Hepatic Versus Extrahepatic Insulin Clearance
Not all insulin is cleared by the liver. When clearance is estimated by analyzing peripheral C-peptide measurements, it reflects extrahepatic as well as hepatic insulin clearance (29). To dissect hepatic from extrahepatic insulin clearance, David Polidori, from Janssen Pharmaceuticals, working with our Cedars-Sinai group, proposed a mathematical model that could differentiate these components (34). With this model, it is possible to estimate hepatic versus extrahepatic clearance mechanisms. Analyzing data from African American (AA) adult women, kindly provided by Anne Sumner and colleagues from the National Institutes of Health (35), we again observed surprising variation of insulin clearance across the population of individuals without diabetes (34). Examples of the fit of the model to the frequently sampled intravenous glucose tolerance test (FSIGT) in different individuals reveal that there is a wide variation in hepatic as well as extrahepatic insulin degradation in human subjects without diabetes (see Fig. 3). Also, it appears that these two components of insulin degradation are independently determined; as shown in Fig. 3, we observed individuals with high values of both components (liver vs. extrahepatic), with low values of both, and with various high/low combinations. Our results from applying our model suggest that there may be independent regulation of hepatic versus extrahepatic insulin clearance in a group of human subjects without diabetes. It will be of interest to further study the regulation of the independent components of insulin clearance in humans.
Figure 3.

Comparison of modeled and measured insulin profiles. A: Mean ± SD for measured (dots and error bars) and modeled (line and shaded region) values. B–E: Profiles for four representative participants having different plasma insulin profiles and different parameter estimates for hepatic and peripheral clearance. Adapted with permission from Polidori et al. (34).
Ethnic Differences in Insulin Clearance
It is well documented that different ethnic groups are at different risk for type 2 diabetes. For example, increased risk has been reported for Hispanic Americans (HAs) (36) as well as AAs (37) compared with their Caucasian counterparts. Our group was interested in examining the question of whether differences in insulin clearance might be associated with differences in risk of disease. We were very fortunate as colleagues from the University of Alabama, Dr. Barbara Gower and colleagues, had obtained data that were directly applicable to our model of hepatic and extrahepatic insulin clearance (38). These investigators had performed the FSIGT in 18 AA and 29 European American (EA) adult women (39). Because they measured plasma insulin as well as C-peptide during the test, the insulin clearance model allowed us to determine hepatic first-pass extraction as well as extrahepatic insulin degradation in these participants (Fig. 4A–D). Remarkably, first-pass hepatic insulin extraction was two-thirds lower, overall, in the AA volunteers compared with the EA (38). There was no difference in extrahepatic insulin clearance between the groups (38). Analysis of Dr. Gower’s data allows us to support earlier studies reporting lower insulin clearance in AAs. Lower clearance will likely account for the fasting hyperinsulinemia reported for that ethnic group.
Figure 4.

Distribution of hepatic insulin fraction (FEL) (A and B) and extrahepatic clearance individual indices (CLP) (C and D) in EAs and AAs, white and black bars, respectively, in ascending order, and average value (gray area). Adapted with permission from Piccinini et al. (38). Distribution of hepatic insulin fraction (FEL) (E–G) and extrahepatic clearance individual indices (CLP) (H–J) in EAs, AAs, and HAs, white, black, and dark gray bars, respectively, in ascending order, and average value (light gray area).
Insulin Clearance in Children
It was then of interest to examine the causality of the reduced hepatic insulin clearance in AAs. Certainly, it is possible that the reduced clearance of insulin in the liver is due to differences in lifestyle. It is well documented that there are differences in many lifestyle factors in the AA versus the EA community in the U.S.: these include diet, sedentary behavior, alcohol consumption, sleep habits, and smoking rates (40).
As a first approach to understanding the underlying causes of differences in hepatic insulin clearance between AAs and EAs, we considered clearance among children. We reasoned that at least some environmental risk factors that differed among adults would not be different in children (e.g., smoking rate and alcohol consumption); therefore, if differences among ethnic groups were identified, they might be due to genetic and/or epigenetic factors. Remarkably, and fortunately for us, Dr. Jose Fernandez and his colleagues had performed the FSIGT in a group of 203 nonobese children (average BMI 19 kg/m2, age 7–13 years old) (41). This group includes 105 male and 98 female children, of three ethnicities (55 AAs, 88 EAs, and 60 HAs). Our results show that hepatic insulin extraction is 74% lower in AA than EA children, while extrahepatic insulin clearance did not significantly differ with ethnicity (Fig. 4E–J); no difference was found concerning the HAs (42). The hypothesis that lower hepatic insulin clearance in AAs is more genetic rather than lifestyle related was further corroborated by the negative correlation between fractional liver extraction and African admixture score (as reported in Klimentidis et al. [41]), and the absence of significant correlation with food intake (42). Certainly, the translational studies presented here support the outstanding work on genetics of insulin degradation performed by Mark Goodarzi and his colleagues, also at Cedars-Sinai Medical Center (43).
Hypothesis: Inherited Reduced Hepatic Clearance May Be a Causative Factor for Type 2 Diabetes
As discussed, despite the investment of great energy and dollars, the exact cause(s) of type 2 diabetes remain(s) less than clear. While reduced ability of the β-cells to compensate for insulin resistance, i.e., reduced disposition index, appears to predict the disease (44), recent focus on heterogeneity of type 2 diabetes (45) encourages the community to look for other factors not well appreciated. Is it possible that reduced hepatic insulin degradation is a cause rather than a result of insulin resistance and other factors? We believe that the extant data such as that described above appear to implicate reduced hepatic insulin clearance as a causal factor. We have observed that hepatic clearance, carefully measured, varies widely among even normal experimental animals and human participants (see Fig. 4A–D), including children (see Fig. 4E–J). We have shown that clearance changes with environmental factors such as diet (20) as well as that it is lower in some ethnic groups with increased risk for type 2 diabetes, such as AAs (38), with this difference observed since childhood (42), when their exposure to possible environmental insults is limited.
Normally, we can imagine insulin release appropriate for a given degree of insulin resistance: between 20% and 80% of insulin may be degraded upon entering the liver, with the remainder entering the systemic circulation to stimulate glucose uptake and regulate glucose production. Liver glucose production may well be controlled by plasma FFA, which are in turn regulated by systemic, not portal, insulin levels (46). However, liver fat is inversely correlated with insulin clearance (47), so we can speculate that in the prediabetic situation (Fig. 5) (48), hepatic clearance of insulin is reduced, resulting in peripheral hyperinsulinemia. We believe it is reduced clearance by liver, rather than overproduction of insulin by pancreatic islets (18), that causes peripheral hyperinsulinemia. Hyperinsulinemia of the periphery may well result in peripheral insulin resistance (49,50), the latter caused by overexposure to endogenous insulin (51). Thus, one can imagine a scenario wherein reduced clearance of insulin by the liver per se may, in some individuals or ethnic groups, be a primary or mitigating factor in the pathogenesis of type 2 diabetes (Fig. 5). In any event, it seems clear that increased study of insulin clearance and the underlying mechanisms and genetics deserve increased attention. It is possible that this previously unappreciated target may result in additional therapies for the treatment of the disease.
Figure 5.

In some patients at risk for type 2 diabetes, liver insulin degradation has been shown to be suppressed (e.g., in AAs). Thus, a larger fraction of the secreted insulin reaches the systemic circulation. Hyperinsulinemia may then result in insulin resistance at muscle, stressing the β-cells, and at adipose tissue, resulting in lipolysis and inappropriately increased endogenous glucose production. Adapted with permission from Bergman et al. (48).
There is increasing evidence that type 2 diabetes, like type 1, may have multiple patterns of pathogenicity. Groop and colleagues, examining surrogate measures, have identified individual clusters of patients (45). Our studies are of relatively small size and do not allow for identification of such clusters. However, the studies described here utilize the pathophysiological approach, in which individual factors are carefully measured by validated methods. Previously, we have identified individuals with relative and latent β-cell dysfunction (44), showing a lower disposition index, and we have associated that with future conversion of impaired glucose tolerance to type 2 diabetes (44). In the present article we suggest an alternative pathogenetic pathway, originating in reduced insulin clearance by the liver, resulting in systemic persistent hyperinsulinemia, insulin resistance, and ultimate β-cell failure to compensate for insulin resistance through secretion, leading then to hyperglycemia in the long term. We realize that the data presented are primarily associative and therefore do not prove causality. In fact, there is limited direct evidence that reduction in insulin clearance per se will lead to diabetes. In the Insulin Resistance Atherosclerosis Study (IRAS), reduced clearance was predictive of conversion from prediabetes to diabetes, but from that population study it was not possible to dissect the effect of low clearance from other factors, such as reduced disposition index (44). Yet data in rodents, such as that from Najjar and her colleagues (52), do not necessarily support our hypothesis that reduced clearance may be causal for diabetes. Her group reported that liver-specific inactivation of CEACAM1 in mice may result in hyperglycemia but not overt diabetes. However, data in mice may not necessarily be a model for the effect of reduced clearance in large animals or humans. Also, it is possible that differences in insulin clearance among ethnic groups reflects differences in lifestyle rather than genetics per se. Potentially, the apparent increase in nocturnal FFA that has been implicated in β-cell compensation (21) may also play a role in changing liver insulin clearance in some ethnic groups. Further longitudinal studies in experimental animals and additional patient groups may clarify whether reduced hepatic insulin degradation can lead to type 2 diabetes, at least in some at-risk groups. It is our goal to pursue such studies, and we encourage other experimental and clinical scientists to follow a similar pathway.
Article Information
Funding. R.N.B. is supported by grants from the National Institute of Diabetes and Digestive and Kidney Diseases (DK27619, DK29867).
Duality of Interest. R.N.B. is supported by grants from AstraZeneca and Janssen Research and Development and is an advisory board member of Novo Nordisk. No other potential conflicts of interest relevant to this article were reported.
References
- 1.Kahn CR. Banting Lecture. Insulin action, diabetogenes, and the cause of type II diabetes. Diabetes 1994;43:1066–1084 [DOI] [PubMed] [Google Scholar]
- 2.Porte D Jr, Kahn SE. Mechanisms for hyperglycemia in type II diabetes mellitus: therapeutic implications for sulfonylurea treatment--an update. Am J Med 1991;90(6A):8S–14S [DOI] [PubMed] [Google Scholar]
- 3.Weyer C, Hanson RL, Tataranni PA, Bogardus C, Pratley RE. A high fasting plasma insulin concentration predicts type 2 diabetes independent of insulin resistance: evidence for a pathogenic role of relative hyperinsulinemia. Diabetes 2000;49:2094–2101 [DOI] [PubMed] [Google Scholar]
- 4.ter Horst KW, Gilijamse PW, Koopman KE, et al. . Insulin resistance in obesity can be reliably identified from fasting plasma insulin. Int J Obes 2015;39:1703–1709 [DOI] [PubMed] [Google Scholar]
- 5.Brüning JC, Michael MD, Winnay JN, et al. . A muscle-specific insulin receptor knockout exhibits features of the metabolic syndrome of NIDDM without altering glucose tolerance. Mol Cell 1998;2:559–569 [DOI] [PubMed] [Google Scholar]
- 6.Olefsky JM, Kolterman OG. Mechanisms of insulin resistance in obesity and noninsulin-dependent (type II) diabetes. Am J Med 1981;70:151–168 [DOI] [PubMed] [Google Scholar]
- 7.Krützfeldt J, Kausch C, Volk A, et al. . Insulin signaling and action in cultured skeletal muscle cells from lean healthy humans with high and low insulin sensitivity. Diabetes 2000;49:992–998 [DOI] [PubMed] [Google Scholar]
- 8.Titchenell PM, Quinn WJ, Lu M, et al. . Direct hepatocyte insulin signaling is required for lipogenesis but is dispensable for the suppression of glucose production. Cell Metab 2016;23:1154–1166 [DOI] [PMC free article] [PubMed] [Google Scholar]
- 9.Montgomery MK, Turner N. Mitochondrial dysfunction and insulin resistance: an update. Endocr Connect 2015;4:R1–R15 [DOI] [PMC free article] [PubMed] [Google Scholar]
- 10.Kim B, Feldman EL. Insulin resistance in the nervous system. Trends Endocrinol Metab 2012;23:133–141 [DOI] [PMC free article] [PubMed] [Google Scholar]
- 11.Del Prato S. Role of glucotoxicity and lipotoxicity in the pathophysiology of type 2 diabetes mellitus and emerging treatment strategies. Diabet Med 2009;26:1185–1192 [DOI] [PubMed] [Google Scholar]
- 12.Reaven GM. Insulin resistance: the link between obesity and cardiovascular disease. Med Clin North Am 2011;95:875–892 [DOI] [PubMed] [Google Scholar]
- 13.Billings LK, Florez JC. The genetics of type 2 diabetes: what have we learned from GWAS? Ann N Y Acad Sci 2010;1212:59–77 [DOI] [PMC free article] [PubMed] [Google Scholar]
- 14.Guo X, Cui J, Jones MR, et al. . Insulin clearance: confirmation as a highly heritable trait, and genome-wide linkage analysis. Diabetologia 2012;55:2183–2192 [DOI] [PMC free article] [PubMed] [Google Scholar]
- 15.Bergman RN, Phillips LS, Cobelli C. Physiologic evaluation of factors controlling glucose tolerance in man: measurement of insulin sensitivity and beta-cell glucose sensitivity from the response to intravenous glucose. J Clin Invest 1981;68:1456–1467 [DOI] [PMC free article] [PubMed] [Google Scholar]
- 16.Kodama K, Tojjar D, Yamada S, Toda K, Patel CJ, Butte AJ. Ethnic differences in the relationship between insulin sensitivity and insulin response: a systematic review and meta-analysis. Diabetes Care 2013;36:1789–1796 [DOI] [PMC free article] [PubMed] [Google Scholar]
- 17.Kahn SE, Prigeon RL, McCulloch DK, et al. . Quantification of the relationship between insulin sensitivity and β-cell function in human subjects. Evidence for a hyperbolic function. Diabetes 1993;42:1663–1672 [DOI] [PubMed] [Google Scholar]
- 18.Corkey BE. Diabetes: have we got it all wrong? Insulin hypersecretion and food additives: cause of obesity and diabetes? Diabetes Care 2012;35:2432–2437 [DOI] [PMC free article] [PubMed] [Google Scholar]
- 19.Pories WJ, MacDonald KG Jr, Morgan EJ, et al. . Surgical treatment of obesity and its effect on diabetes: 10-y follow-up. Am J Clin Nutr 1992;55(Suppl.):582S–585S [DOI] [PubMed] [Google Scholar]
- 20.Kim SP, Ellmerer M, Kirkman EL, Bergman RN. Beta-cell “rest” accompanies reduced first-pass hepatic insulin extraction in the insulin-resistant, fat-fed canine model. Am J Physiol Endocrinol Metab 2007;292:E1581–E1589 [DOI] [PubMed] [Google Scholar]
- 21.Broussard JL, Kolka CM, Castro AV, et al. . Elevated nocturnal NEFA are an early signal for hyperinsulinaemic compensation during diet-induced insulin resistance in dogs. Diabetologia 2015;58:2663–2670 [DOI] [PMC free article] [PubMed] [Google Scholar]
- 22.Boden G. Effects of free fatty acids (FFA) on glucose metabolism: significance for insulin resistance and type 2 diabetes. Exp Clin Endocrinol Diabetes 2003;111:121–124 [DOI] [PubMed] [Google Scholar]
- 23.Campioni M, Toffolo G, Basu R, Rizza RA, Cobelli C. Minimal model assessment of hepatic insulin extraction during an oral test from standard insulin kinetic parameters. Am J Physiol Endocrinol Metab 2009;297:E941–E948 [DOI] [PMC free article] [PubMed] [Google Scholar]
- 24.Poy MN, Ruch RJ, Fernstrom MA, Okabayashi Y, Najjar SM. Shc and CEACAM1 interact to regulate the mitogenic action of insulin. J Biol Chem 2002;277:1076–1084 [DOI] [PubMed] [Google Scholar]
- 25.Xu E, Dubois MJ, Leung N, et al. . Targeted disruption of carcinoembryonic antigen-related cell adhesion molecule 1 promotes diet-induced hepatic steatosis and insulin resistance. Endocrinology 2009;150:3503–3512 [DOI] [PubMed] [Google Scholar]
- 26.Lee W. The CEACAM1 expression is decreased in the liver of severely obese patients with or without diabetes. Diagn Pathol 2011;6:40. [DOI] [PMC free article] [PubMed] [Google Scholar]
- 27.Kabir M, Iyer MS, Richey JM, et al. . CB1R antagonist increases hepatic insulin clearance in fat-fed dogs likely via upregulation of liver adiponectin receptors. Am J Physiol Endocrinol Metab 2015;309:E747–E758 [DOI] [PMC free article] [PubMed] [Google Scholar]
- 28.Eaton RP, Allen RC, Schade DS, Erickson KM, Standefer J. Prehepatic insulin production in man: kinetic analysis using peripheral connecting peptide behavior. J Clin Endocrinol Metab 1980;51:520–528 [DOI] [PubMed] [Google Scholar]
- 29.Eaton RP, Allen RC, Schade DS. Hepatic removal of insulin in normal man: dose response to endogenous insulin secretion. J Clin Endocrinol Metab 1983;56:1294–1300 [DOI] [PubMed] [Google Scholar]
- 30.Toffolo G, Bergman RN, Finegood DT, Bowden CR, Cobelli C. Quantitative estimation of beta cell sensitivity to glucose in the intact organism: a minimal model of insulin kinetics in the dog. Diabetes 1980;29:979–990 [DOI] [PubMed] [Google Scholar]
- 31.Van Cauter E, Mestrez F, Sturis J, Polonsky KS. Estimation of insulin secretion rates from C-peptide levels. Comparison of individual and standard kinetic parameters for C-peptide clearance. Diabetes 1992;41:368–377 [DOI] [PubMed] [Google Scholar]
- 32.Asare-Bediako I, Paszkiewicz RL, Kim SP, et al. . Assessment of hepatic insulin extraction from in vivo surrogate methods of insulin clearance measurement. Am J Physiol Endocrinol Metab 2018;315:E605–E612 [DOI] [PMC free article] [PubMed] [Google Scholar]
- 33.Asare-Bediako I, Paszkiewicz RL, Kim SP, et al. . Variability of directly measured first-pass hepatic insulin extraction and its association with insulin sensitivity and plasma insulin. Diabetes 2018;67:1495–1503 [DOI] [PMC free article] [PubMed] [Google Scholar]
- 34.Polidori DC, Bergman RN, Chung ST, Sumner AE. Hepatic and extrahepatic insulin clearance are differentially regulated: results from a novel model-based analysis of intravenous glucose tolerance data. Diabetes 2016;65:1556–1564 [DOI] [PMC free article] [PubMed] [Google Scholar]
- 35.Sumner AE, Thoreson CK, O’Connor MY, et al. . Detection of abnormal glucose tolerance in Africans is improved by combining A1C with fasting glucose: the Africans in America Study. Diabetes Care 2015;38:213–219 [DOI] [PMC free article] [PubMed] [Google Scholar]
- 36.Chukwueke I, Cordero-Macintyre Z. Overview of type 2 diabetes in Hispanic Americans. Int J Body Compos Res 2010;8(Supp.):77–81 [PMC free article] [PubMed] [Google Scholar]
- 37.Meier JJ, Veldhuis JD, Butler PC. Pulsatile insulin secretion dictates systemic insulin delivery by regulating hepatic insulin extraction in humans. Diabetes 2005;54:1649–1656 [DOI] [PubMed] [Google Scholar]
- 38.Piccinini F, Polidori DC, Gower BA, Bergman RN. Hepatic but not extrahepatic insulin clearance is lower in African American than in European American women. Diabetes 2017;66:2564–2570 [DOI] [PMC free article] [PubMed] [Google Scholar]
- 39.Chandler-Laney PC, Phadke RP, Granger WM, et al. . Age-related changes in insulin sensitivity and β-cell function among European-American and African-American women. Obesity (Silver Spring) 2011;19:528–535 [DOI] [PMC free article] [PubMed] [Google Scholar]
- 40.King H, Rewers M; WHO Ad Hoc Diabetes Reporting Group . Global estimates for prevalence of diabetes mellitus and impaired glucose tolerance in adults. Diabetes Care 1993;16:157–177 [DOI] [PubMed] [Google Scholar]
- 41.Klimentidis YC, Divers J, Casazza K, Beasley TM, Allison DB, Fernandez JR. Ancestry-informative markers on chromosomes 2, 8 and 15 are associated with insulin-related traits in a racially diverse sample of children. Hum Genomics 2011;5:79–89 [DOI] [PMC free article] [PubMed] [Google Scholar]
- 42.Piccinini F, Polidori DC, Gower BA, Fernandez JR, Bergman RN. Dissection of hepatic versus extra-hepatic insulin clearance: ethnic differences in childhood. Diabetes Obes Metab 2018;20:2869–2875 [DOI] [PMC free article] [PubMed] [Google Scholar]
- 43.Lee CC, Haffner SM, Wagenknecht LE, et al. . Insulin clearance and the incidence of type 2 diabetes in Hispanics and African Americans: the IRAS Family Study. Diabetes Care 2013;36:901–907 [DOI] [PMC free article] [PubMed] [Google Scholar]
- 44.Lorenzo C, Wagenknecht LE, Rewers MJ, et al. . Disposition index, glucose effectiveness, and conversion to type 2 diabetes: the Insulin Resistance Atherosclerosis Study (IRAS). Diabetes Care 2010;33:2098–2103 [DOI] [PMC free article] [PubMed] [Google Scholar]
- 45.Ahlqvist E, Storm P, Käräjämäki A, et al. . Novel subgroups of adult-onset diabetes and their association with outcomes: a data-driven cluster analysis of six variables. Lancet Diabetes Endocrinol 2018;6:361–369 [DOI] [PubMed] [Google Scholar]
- 46.Steil GM, Ader M, Moore DM, Rebrin K, Bergman RN. Transendothelial insulin transport is not saturable in vivo. No evidence for a receptor-mediated process. J Clin Invest 1996;97:1497–1503 [DOI] [PMC free article] [PubMed] [Google Scholar]
- 47.Kotronen A, Juurinen L, Tiikkainen M, Vehkavaara S, Yki-Järvinen H. Increased liver fat, impaired insulin clearance, and hepatic and adipose tissue insulin resistance in type 2 diabetes. Gastroenterology 2008;135:122–130 [DOI] [PubMed] [Google Scholar]
- 48.Bergman RN, Piccinini F, Asare Bediako I, et al. . Quantitative path to deep phenotyping: possible importance of reduced hepatic insulin degradation to type 2 diabetes mellitus pathogenesis. J Diabetes 2018;10:778–783 [DOI] [PMC free article] [PubMed] [Google Scholar]
- 49.Rizza RA, Mandarino LJ, Genest J, Baker BA, Gerich JE. Production of insulin resistance by hyperinsulinaemia in man. Diabetologia 1985;28:70–75 [DOI] [PubMed] [Google Scholar]
- 50.Catalano KJ, Maddux BA, Szary J, Youngren JF, Goldfine ID, Schaufele F. Insulin resistance induced by hyperinsulinemia coincides with a persistent alteration at the insulin receptor tyrosine kinase domain. PLoS One 2014;9:e108693 [DOI] [PMC free article] [PubMed] [Google Scholar]
- 51.Dowse GK, Zimmet PZ, Alberti KG, et al.; Mauritius NCD Study Group . Serum insulin distributions and reproducibility of the relationship between 2-hour insulin and plasma glucose levels in Asian Indian, Creole, and Chinese Mauritians. Metabolism 1993;42:1232–1241 [DOI] [PubMed] [Google Scholar]
- 52.Poy MN, Yang Y, Rezaei K, et al. . CEACAM1 regulates insulin clearance in liver. Nat Genet 2002;30:270–276 [DOI] [PubMed] [Google Scholar]