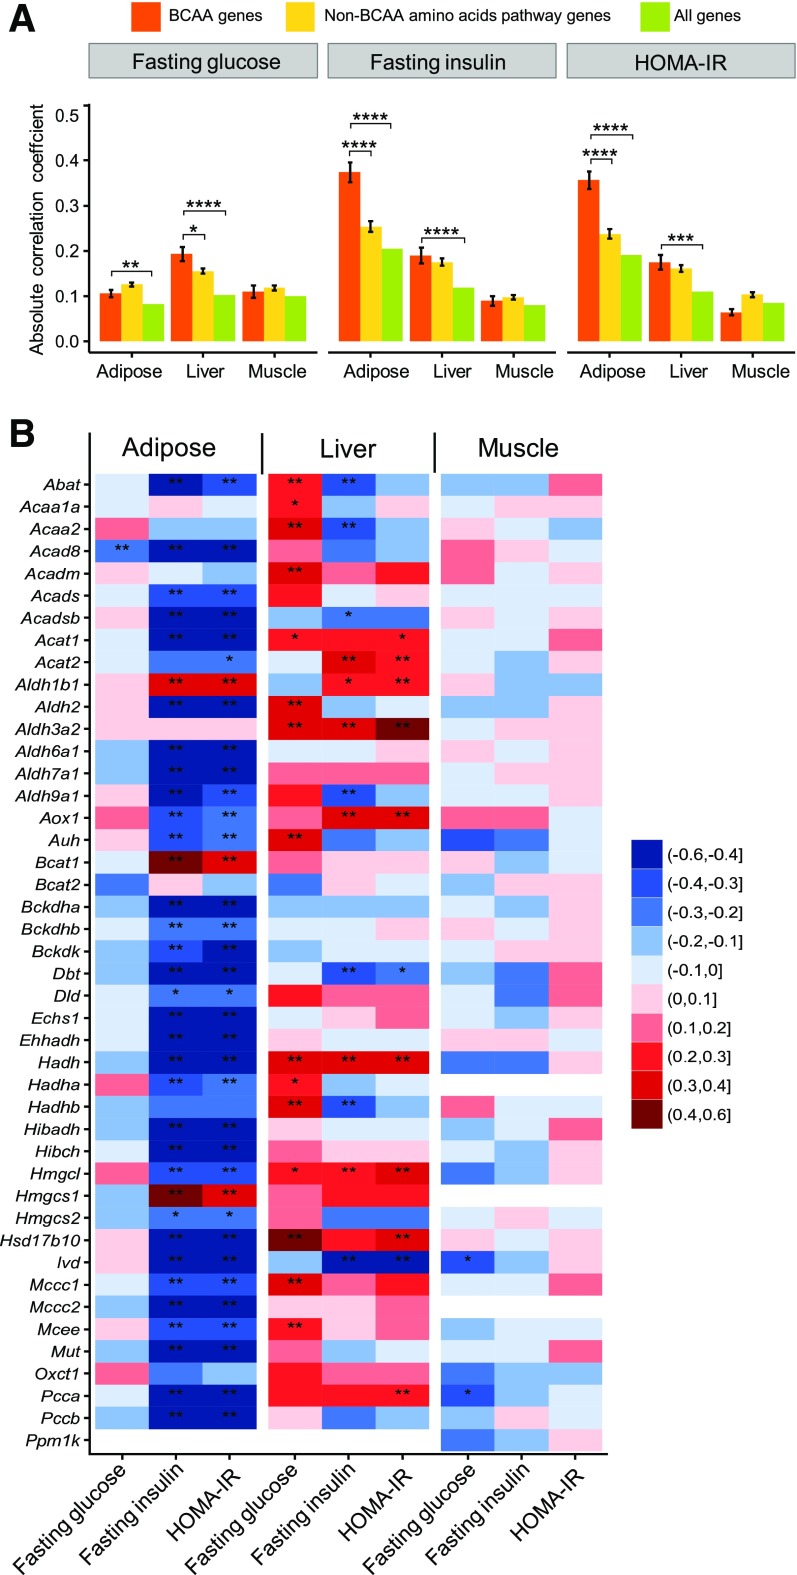
Figure 2.
The BCAA catabolic pathway shows a strong correlation with IR in a mouse population. A: Comparison of correlation strengths of the expression of BCAA pathway genes, non-BCAA amino acid pathway genes, and all genes with IR-related traits in mice. The correlation data between tissue-specific expression profiling and measurements of clinical traits were extracted from the HMDP, which contains ∼100 strains of genetically divergent mice fed an HFD. The mean and SE of the absolute values of Pearson correlations between each gene within a gene category (BCAA, non-BCAA, all genes) and a trait are shown. The significance of differences in the mean correlation strength between gene categories was calculated by using the Student t test. *P < 0.05; **P < 0.01; ***P < 0.001; ****P < 0.0001. B: Correlation of individual BCAA catabolic genes in different tissues for fasting glucose, fasting insulin, and HOMA-IR in HMDP mice fed an HFD. Red indicates a positive correlation, whereas blue indicates a negative correlation. *P < 0.05 and **P < 0.05 after Bonferroni correction for the number of genes and traits.

