

Summary
Connecting the developmental patterning of tissues to the mechanistic control of RNA polymerase II remains a long term goal of developmental biology. Many key elements have been identified in the establishment of spatial-temporal control of transcription in the early Drosophila embryo, a model system for transcriptional regulation. The dorsal/ventral axis of the Drosophila embryo is determined by the graded distribution of Dorsal (Dl), a homologue of the NF-κB family of transcriptional activators found in humans [1,2]. A second maternally deposited factor, Zelda (Zld), is uniformly distributed in the embryo and is thought to act as a pioneer factor, increasing enhancer accessibility for transcription factors such as Dl [3–9]. Here we utilized the MS2 live imaging system to evaluate the expression of the Dl target gene short gastrulation (sog) to better understand how a pioneer factor affects the kinetic parameters of transcription. Our experiments indicate that Zld modifies probability of activation, the timing of this activation, and the rate at which transcription occurs. Our results further show that this effective rate increase is due to an increased accumulation of Dl at the site of transcription, suggesting that transcription factor “hubs” induced by Zld [10] functionally regulate transcription.
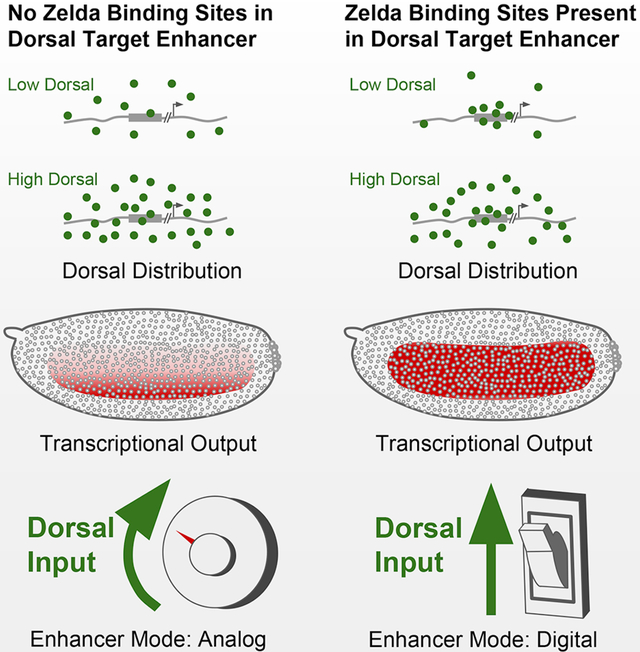
Graphical Abstract
eTOC Blurb
Drosophila embryos establish a graded distribution of Dorsal protein to define the dorsal/ventral axis in early development. Yamada, Whitney et al. demonstrate how Zelda allows a cis-regulatory element to unify gene expression over a broad dynamic range of the Dorsal gradient by raising the local concentration of Dorsal at the enhancer.
Results
Our study focused on the Dl target gene sog as its expression domain spans a large dynamic range of the Dl gradient, allowing us to examine how Zld potentiates Dl activity across the dorsal/ventral axis. Previous experiments have demonstrated that the lateral stripe of sog expression narrows dramatically in zld null embryos [5,11] (Figures 1A and 1B), and that progressively removing Zld DNA binding sites from the sog shadow (distal) enhancer shrinks the domain of activation of reporter genes in a linear manner [7]. In order to understand how Zld influences transcription at different points along the Dl gradient, we revisited these constructs with the aim of visualizing transcription in real time by adding 24 MS2 loops to the 5’ end of the lacZ reporter. Since previously utilized MS2 loops [12–15] contained potential Zld binding sites [16], we revised the MS2v5 [17] sequence to make a Zld binding site-free non-repetitive version, referred to as MS2v5(-TAG) (see STAR Methods). Constructs also contained either the sog shadow (distal) enhancer [18,19] with its three native canonical Zld binding sites, CAGGTAG (hereafter referred to as “3TAG”), or without these sites (hereafter referred to as “0TAG”) (Figure 1C; see STAR Methods for enhancer sequences; [7]). The narrowing effect of removing Zld binding sites was confirmed by in situ hybridization (Figures 1D and 1E).
Figure 1: Zld potentiates Dl activity at the sog enhancer.

(A-B) Conventional enzymatic in situ hybridization staining of sog in wild type and zld mutant NC14 embryos. (C) Schematic representation of transgenes. MS2 loops have been incorporated into the 5’ end of the transcript upstream of a lacZ reporter sequence. (D-E) in situ hybridization staining of the engineered MS2v5(-TAG) lacZ transgenic embryos, showing that 3TAG and 0TAG expression is similar to the expression of sog in wild type and zld mutants, respectively.
By crossing these transgenic reporter lines to females expressing the MCP (MS2 Coat Protein)-GFP fusion gene during oogenesis [14], we visualized the transcriptional activation of each reporter as fluorescent foci (see Figure 1C and STAR Methods). These embryos also express H2Av(histone 2A variant)-RFP [20], allowing us to track nuclear cycles and record transcriptional activation events in space and time. We performed confocal live imaging over the course of nuclear cycles 10 to 14 (NC10-NC14), tracking the activation of the 3TAG and 0TAG reporter genes (Videos S1–S2). To validate that the MS2 transgenes behaved as expected, we examined transcriptional activation events in space and time and compared those to expression as assessed by conventional in situ analysis. We find that the 3TAG construct is activated as early as NC10, while activation of the 0TAG construct is delayed until NC11–12 (Figures 2A and 2B and Videos S1–S2; also see additional Videos S3–S6), in agreement with previously published results of sog activation in zld mutants [5].
Figure 2: MS2 imaging reveals a position dependent transcriptional delay in the absence of Zld binding sites.

(A-B) Frames taken from live imaging Videos S1 and S2 that track transcription (green spots) from NC12 to NC14 as indicated and color coded below, NC12 (light green), NC13 (medium green), NC14 (dark green). Nuclei (red) have been labeled using maternally loaded H2Av-RFP. Bars on right side follow five zones along the dorsal/ventral axis with ventral mesoderm on bottom (Zone 1) as diagrammed in the embryo schematic (C) with blue shading defining the presumptive mesoderm of the embryo. (D-E) Quantification of the number of expressing nuclei in NC12 to NC14 (color coded as in A-B) agrees with conventional in situ analysis, showing markedly fewer active nuclei in 0TAG embryos across consecutive nuclear cycles, especially in Zones 4 and 5. In total, 8 3TAG embryos and 6 0TAG embryos were analyzed as indicated in the bar plots, and plotted with error bars representing one standard deviation of all values collected for each cycle and bin. For additional videos, see Videos S3–S6. (F-H) Cumulative distribution curves of nuclei that activate transcription in NC13, excluding nuclei that never activate in NC13. Time 0 on the X-axis is the start of anaphase of the previous cycle, NC12. All zones concatenated with delay values across genotypes in (F) with variance across biological replicates indicated with vertical lines showing one standard deviation of all embryos measured. 3TAG embryos activate transcription simultaneously across the expression domain (G), and 0TAG embryos show a delay dependent on the nucleus’ position in the Dl gradient (H).
To compare the spatial differences in activation, we divided the expression domain of sog into five discrete zones with Zone 1 comprising the mesoderm, and all subsequent zones defined by 20 μm width bands moving sequentially towards the dorsal midline of the embryo, diagrammed in Figure 2C. The in situ experiments predict that the most dorsal zones imaged would show few active nuclei in 0TAG embryos, and this was the case. While 3TAG embryos showed similar numbers of active nuclei in each zone across all cycles (NC12-NC14), with the exception of Zone 1 in NC14 due to ventral repression by Snail (Figure 2D), in 0TAG embryos, the more dorsal the zone, the fewer the number of active nuclei (Figure 2E). Collectively, these qualitative observations are in accordance with what is currently known about how Zld participates in transcriptional activation, and provide evidence that our transgenes are faithfully reporting on the transcriptional activity of sog in the presence or absence of Zld.
In addition to allowing qualitative assessment of transcriptional activation, MS2 reporters continually output information on the state of transcription over time, enabling an analysis of the timing of each activation event within a nuclear cycle [14]. This was performed by measuring the time between anaphase of NC12 and the appearance of fluorescent foci in NC13, and plotting the results as cumulative distribution curves (Figures 2F–2H). This analysis showed that nuclei in 3TAG embryos express simultaneously across the domain of expression (Figure 2G; Video S1). In stark contrast, we observed a significant position-dependent delay of activation in 0TAG embryos where the ventral nuclei activate transcription well before lateral nuclei (Figure 2H; Video S2). This is presumably due to the highly dynamic nature of the Dl gradient, whereby Dl levels increase within and across nuclear cycles [21–23]. Here, the 0TAG reporter is effectively acting as a readout for nuclear Dl concentration, suggesting that in the absence of Zld binding sites the sog enhancer responds to Dl levels in a concentration-dependent manner, rather than the binary switch-like response seen in the presence of Zld.
Knowing that activation is altered in 0TAG embryos, we next examined the internal kinetic features of transcription. We focused principally on two phases of transcription, which are described in Figures 3A and 3B using representative nuclei from each genotype at NC13, with the signal over time quantified in Figures 3C and 3D. The first was “ramp-up”, an early phase where polymerase molecules first begin to elongate as transcription begins. Here the rise in MS2 signal is attributed to polymerases accumulating over the gene body as they transcribe the MS2 loops and continue to elongate. The length of the ramp-up phase is commonly thought of as the time in which a single polymerase molecule has traversed the entire gene body [14]. The transition to the next phase, “steady-state” transcription, is reached when the rate of polymerase loading is matched by rate of polymerase unloading, diagrammed in Figure 3E. Here the MS2 signal levels off and fluctuates within a narrow range as there is no net gain of nascent transcripts. We have included an equation demonstrating that the signal strength at steady-state transcription can be understood as the average gap between polymerase molecules on the gene body (Figure 3E).
Figure 3. Zld promotes full saturation of polymerase on the gene body during transcriptional elongation.

(A-B) Representative single nuclei tracked over NC13 from Videos S1 (A) and S2 (B). Time stamp (min) shown in bottom right corner of each frame (Time 0 is defined as the start of NC12 anaphase). Ramp-up and Steady-state phases of transcription are highlighted with green and purple bars, respectively. (C-D) Quantification of signal intensity over time from representative nuclei shown. Phases of transcription are highlighted with corresponding colors as in A and B. Ramp-up is calculated as the length of time between detection above background of the MS2 focus and max output (averaged; see STAR Methods). (E) Schematic representation of steady-state transcription, where the gene body is decorated with elongating RNA polymerases, and the rate of loading is roughly matched by the rate of unloading. X values show the spacing between polymerase molecules. Spacing of polymerase molecules can be inferred from the signal output at steady-state using the equation shown. (F-G) Cumulative distribution curves of the percentage of nuclei that have reached steady-state. (H) Average intensity at steady-state (NC13) plotted as box plot distributions over all five zones of the sog expression domain. In total for all zones, 855 and 460 nuclei were analyzed for 3TAG and 0TAG, respectively, from 8 3TAG and 6 0TAG embryos (see additional Videos S1–S6). Significant differences between all zones except Zone 5 were found using a Welch’s t-test between the genotypes. 3TAG embryos show little difference over the first four zones, while 0TAG embryos show progressive loss in signal intensity over the dorsal/ventral axis.
Using the duration of the ramp-up phase, which can be referred to as the “time to steady state”, we can calculate the number of nuclei that have reached steady-state transcription as cumulative distribution curves, with the percentage of all active nuclei at steady-state plotted over time (Figure 3F and 3G). There is a striking similarity between the two genotypes, indicating that Zld does not act on the speed of polymerase. In addition, the time to steady-state is similar in each of the different zones, suggesting that nuclear Dl concentration has little influence on polymerase elongation rate. In contrast, when signal intensity values of steady-state transcription are averaged for each nucleus (Figure 3H) it appears that both Zld and Dl are modulating the strength of transcription. Similar to our observations regarding the onset of transcriptional activation, the 3TAG reporter shows comparable max output across multiple zones until the most extreme end of the Dl gradient (Zone 5), whereas the 0TAG reporter shows a progressive loss of max output across the entire gradient (Figure 3F), indicating that transcriptional output rate has become a function of nuclear Dl concentration. These results suggest Zld acts upstream of elongation, for example, to either increase RNA polymerase II loading or decrease the length of pausing experienced by a given polymerase molecule. Either of these regulatory steps would affect the mean spacing of polymerase molecules at max output.
This behavior of Zld inducing uniform transcriptional activation and output across a transcriptional activator gradient could be explained by Zld’s reported ability to promote the formation of transcription factor “hubs” [10,24,25]. By raising the local concentration of Dl at the site of transcription, Zld may effectively flatten the gradient of Dl experienced by the enhancer, and therefore unify the levels of transcriptional output in regions of low level Dl. To test this hypothesis, we used a previously described method to examine transcription factor enrichment at sites of nascent transcript formation in Drosophila embryos [26,27]. By costaining fixed embryos with an anti-Dl antibody and a single molecule (sm) FISH probe targeting the lacZ reporter transcript [28], we could quantify the concentration of Dl protein adjacent to foci of transcription. Figure 4A shows the Dl gradient at comparable positions in 3TAG and 0TAG embryos. Signal overlap between puncta of Dl staining and lacZ staining, the presumed site of transcription, can be seen in 3D contour maps where the surface represents the level of Dl antibody signal and the site of transcription is mapped onto the texture of the contour. We classified nuclei as either having a High, Mid, or Low level of Dl based on binning all nuclei imaged according to their average Dl signal intensity, which correspond spatially to Zones 1, 2, and 3 in Figures 2 and 3.
Figure 4. Zld increases the local concentration of Dl at the site of transcription.

(A-B) Confocal images of NC13 embryos stained with anti-Dl antibodies and smFISH probes for the lacZ reporter genes 3TAG (A) and 0TAG (B). Dl staining appears highly punctate, indicating the possible presence of high-Dl nuclear microenvironments. Sites of active transcription are visualized as red nuclear foci that can be localized in 3D space. Select foci were isolated and visualized in 3D contour maps, where the height of surface represents the intensity of the Dl staining. A high incidence of FISH signal overlapping with Dl microdomains was observed, suggesting the concentration of Dl may have an impact on transcription. (C) The distributions of Dl signal within the microdomain of transcribing foci (see Figure S1 for individual enrichment curves). In regions of high nuclear Dl, both genotypes show similar distributions, but a difference is detected in regions where nuclear Dl begins to drop. Control distributions were prepared using random places in the nucleus. The numbers of nuclei (n) used for the analysis are indicated. Three embryos for each genotype were used. Error bars: standard error of the mean.
Figure 4C uses a modified approach demonstrated by Tsai et al. [29], where the radial intensity of the Dl antibody stain is plotted to visualize the nuclear microenvironment that surrounds a site of active transcription (lacZ staining). Because the nuclear concentration of Dl changes across the gradient, we divided voxel intensity by the average voxel intensity found within a nucleus. In this way, we could normalize across nuclei by defining our measurement as a unitless index describing the relative enrichment of signal at a given site of transcription, where a value of 1 indicates no enrichment. Additionally, we included a set of random points within nuclei as a control. For a full breakdown of individual enrichment curves, see Figure S1. As predicted, we see a progressive loss in enrichment over the gradient in 0TAG embryos, and a measurable gain in enrichment in 3TAG embryos, indicating that Zld’s ability to drive higher transcriptional output is based on enhancing the local concentration of existing transcriptional activators rather than utilizing an additional Zld specific activation pathway. Importantly, these results strongly suggest a functional link between Zld’s reported ability to induce transcription factor aggregates [10] and transcriptional output, an important first step towards a complete understanding of Zld’s ability to control gene expression.
Discussion
The precise logic governing cis-regulatory elements is still an evolving field after decades of research. The role of pioneer factors such as Zld in modifying chromatin has increased our understanding of how patterning transcription factors such as Dl and Bicoid (Bcd) access their target enhancers [4,7,8,30,31], however questions persist as to the events that occur at the site of transcription. Several recent reports have suggested that the accumulation and stable association of transcription factor aggregates, or hubs, is important for proper transcriptional output [10,24,25,29]. Additionally, the Drosophila transcription factor Bcd is enriched in Zld hubs, particularly in nuclei with lower overall Bcd, suggesting that Zld interacts with transcription factors to raise their local concentration [24]. Our results manipulating Zld binding at the enhancer/site of transcription agree nicely with these recent findings, and for the first time suggest a direct impact of these transcription factor hubs on transcription itself.
Our experiments identify two key parameters where Zld modifies the activity of a Dl-responsive enhancer. The first parameter is the onset of transcription across the domain of sog, where a position-dependent delay in transcriptional activation of the reporter was observed in the 0TAG embryos. We believe that the uniformity of this response is the result of Zld’s pioneering activity to ubiquitously lower the nucleosome barrier from regions of DNA in close proximity to its DNA binding motif. Freeing up enhancers may then allow Dl to be bound more quickly at low concentrations, which may in turn lead to local enrichment of Dl (Figure 4C). In the absence of Zld, Dl must compete directly with nucleosomes to access its DNA binding sites. This competition could be more effective at high concentrations of Dl, thus leading to the concentration-dependent effects observed in 0TAG. The second parameter controlled by Zld is the uniformity of the transcriptional output over the course of a nuclear cycle. Our MS2 data of 3TAG embryos showed remarkably similar levels of total transcription in all measured positions save for the most extreme dorsally-located nuclei. Our results of higher Dl enrichment in 3TAG embryos in nuclei with low Dl tracks well with the measurements of transcription. However, It remains to be seen if these two transcriptional parameters (timing and output) are connected by a single mechanistic step mediated by Zld binding to an enhancer.
More broadly, these experiments demonstrate the influence that Zld has on global dynamics of tissue patterning. Morphogen gradients supply positional information through an analog signal: a contiguous modulation in morphogen concentration directly encodes location along a developmental axis. When creating a broad domain of expression from this signal, a conversion from analog to digital information must occur; a varying amount of transcriptional activator, in this case Dl, must be reliably converted into a uniform transcriptional response. Our work suggests that Dl’s interaction with Zld allows it to produce near identical transcriptional output over a large range of nuclear Dl concentrations and in the absence of that interaction, output is purely reflective of the underlying gradient. As uniform transcriptional domains that span large sections of morphogen gradients are a common motif across developmental systems, we believe our work helps shed light on a common principle of cellular fate decisions.
STAR METHODS:
CONTACT FOR REAGENT AND RESOURCE SHARING
Requests for any information and requests for resources or reagents should be directed to the Lead Contact, Christine Rushlow (car2@nyu.edu)
EXPERIMENTAL MODEL AND SUBJECT DETAILS
All flies were grown on standard fly (Drosophila melanogaster) cornmeal-molasses-yeast media. y[1]w[1118](used as wild type flies), zld shmir (zld−) (see “Depletion of maternal zld” section below) [8], and transgenic embryos (3TAG and 0TAG) were collected on yeasted grape juice agar plates. Flies of the genotype y[1] w*; P{His2Av-mRFP1}II.2; P{nos-MCP.EGFP}2 (Bloomington Stock Number 60340) carried two transgenes, one on chromosome 3, P{nos-MCP.EGFP}2, which expresses the MS2 coat protein (MCP) fused to EGFP under the control of the nanos promoter active in oogenesis, and the other on chromosome 2, P{His2Av-mRFP1}II.2, which expresses RFP-tagged His2Av in all cells under the control of His2Av. MS2 transgenes were constructed in the following manner: MS2 loop sequences were revised since previously used MS2 loops [12–14,16,17] contained potential Zld binding sites [5,14,16]. The new MS2 loops sequence, MS2v5(-TAG) (see Method Details for DNA sequence) was placed in between the eve minimal promoter and a lacZ reporter gene (pib-evepr-ms2v5(-TAG)-lacZ plasmid), then subcloned into an attB vector (pBPhi) containing sog enhancers with (3TAG) or without (0TAG) Zld binding sites [7] (Method Details). Transgenic lines carrying these constructs were generated by phiC31 integration in the 53B2 landing site (VK00018), Bloomington stock number 9736 [32,33] by BestGene.
METHOD DETAILS
Depletion of maternal zld
Embryos were collected from females depleted of zld RNAs by RNAi prepared in two crosses [8]: 1st cross ♀ +; +; UAS-shRNA-zld X ♂ P{COG-GAL4:VP16}; P{Gal4-nos.NGT}40; P{nos-Gal4-VP16}; 2nd cross G1♀ P{COG-GAL4:VP16}/+; P{Gal4-nos.NGT}40/+; P{nos-Gal4-VP16}/UAS-shRNA-zld X ♂ yw
Sequence of the sog 3TAG and 0TAG enhancers
sog 3TAG
426 bp enhancer sequence (Zld binding site in red):
GTTTCAGCGGAACAGGTAGGCTGGTCGATCGGAAATTCCCACCATACACATGTGGCTATAATGCCAACGGCATCGAGGTGCGAAAACAGATGCAGCCTCATAAAAGGGGCGCAGATAAGGTCGCGGTTGCGTGGGAAAAGCCCATCCGACCAGGACCAGGACGAAGCAGTGCGGTTGGCGCATCATTGCCGCCATATCTGCTATTCCTACCTGCGTGGCCATGGCGATATCCTTGTGCAAGGATAAGGAGCGGGGATCATAAAACGCTGTCGCTTTTGTTTATGCTGCTTATTTAAATTGGCTTCTTGGCGGGCGTTGCAACCTGGTGCTAGTCCCAATCCCAATCCCAATTCCAATCCCAATCCATATACCATATCCAATGCATTCTACCTGTCCTGGGAATTTCCGATCTGGCCGCACCCATAT
sog 0TAG
426 bp enhancer sequence (mutated Zld binding site in red):
GTTTCAGCGGAACCAACAAGCTGGTCGATCGGAAATTCCCACCATACACATGTGGCTATAATGCCAACGGCATCGAGGTGCGAAAACAGATGCAGCCTCATAAAAGGGGCGCAGATAAGGTCGCGGTTGCGTGGGAAAAGCCCATCCGACCAGGACCAGGACGAAGCAGTGCGGTTGGCGCATCATTGCCGCCATATCTGCTATTCTTGTTGGCGTGGCCATGGCGATATCCTTGTGCAAGGATAAGGAGCGGGGATCATAAAACGCTGTCGCTTTTGTTTATGCTGCTTATTTAAATTGGCTTCTTGGCGGGCGTTGCAACCTGGTGCTAGTCCCAATCCCAATCCCAATTCCAATCCCAATCCATATACCATATCCAATGCATTTTGTTGGTCCTGGGAATTTCCGATCTGGCCGCACCCATAT
in situ hybridization
Embryos were collected and aged to be 1–3 hours old at room temperature and dechorionated in Clorox for two minutes. They were then fixed in 4% formaldehyde (1X PBS) and an equal volume of heptane for 25 minutes while shaking vigorously. Devitellinization was performed by pipetting off the bottom fixative phase and adding 4 ml of methanol and shaking vigorously for 30 seconds. Embryos were rinsed in methanol and transferred to ethanol for storage at −20 degrees C. Hybridization of fixed embryos used a standard in situ hybridization (ISH) protocol and DIG-labeled sog cDNA or lacZ RNA antisense probes [7]; hybridized at 55 degrees C overnight). Visualization of the labeled probe was done using anti-DIG-AP (alkaline phosphatase) antibodies (Roche Biochemicals) followed by histochemical enzymatic staining reagents (Roche Biochemicals). For smFISH, Atto-633 conjugated probe sets complementary to lacZ (gift from Shawn Little) [28] were used in hybridization experiments using Stellaris (LGC Biosearch Technologies) reagents and protocols.
Antibody staining
Antibody staining was performed at 4 degrees C for 16 hours followed by three 20 minute washes in PBS + 0.1% Tris pH 7.0. Anti-Dl antibody (Dl_7A4) was obtained from the Developmental Studies Hybridoma Bank and used at 1:50 dilution. Embryos were then stained with Alexa Fluor 488 anti-mouse secondary antibody (Invitrogen, ThermoFisher Scientific) for 1.5 hours and washed in the same manner. After DAPI (D9542, Sigma-Aldrich) staining for 20 minutes, embryos were mounted on microscope slides using Aqua-Poly/Mount (Polysciences) and Number 1.5 glass coverslips (Fisher Scientific). Embryos were imaged with Zeiss Axiophot DIC optics and a Zeiss Cam and ZEN2012 software.
Construction of MS2v5(-TAG) vector
In order to identify potential Zld binding sites in the DNA sequence encoding MS2v5 [17], the sequence was analyzed with a Zld alignment matrix (courtesy of Melissa Harrison; [9]) using the Advanced PASTER entry form online (http://stormo.wustl.edu/consensus/cgi-bin/Server/Interface/patser.cgi) [34]. PATSER was run with settings Seq. Alphabet and Normalization “a:t 3 g:c 2” to provide the approximate background frequencies as annotated in Berkeley Drosophila Genome Project (BDGP)/Celera Release 1. Complementary sequences were also scored. When PATSER identified a site scoring 3 or higher, one to three bases were modified to reduce the score of the site. After modifying the sequence, it was run through PATSER again to check that no new binding sites were inadvertently created. The process was repeated until all sites scored 3 or higher were abolished. Sites that occurred on sequences encoding MS2 loops were carefully modified to maintain the pattern set forth in Wu et al. [17]. Potential binding sites for GAGA Factor were simultaneously abolished during this process using the same methods. The entire MS2v5(-TAG) sequence was constructed as a G-block by GenScript, confirmed by sequencing, and incorporated into our reporter construct by Gibson Assembly (New England Biolabs, Inc.).
MS2v7 sequence (24 new loops highlighted in grey) aacctacaaaggcgtggaggatcaccccacgccacacttcacaatcaaggggtacaatacacaagggtggaggaacaccccaccctccagacacattacacagaaatccaatcaaacagaagcaccatcagggcttctcctacgaaatttatctcaaaaaactacaaacagtaatcaggatcaccgattacgtctgcaatatacgtcaaacgacgcccacgacgggaggacgatcacgcctcccgaatatcggcattcgtggctttcgaattcaatccgtggagcatcagcccacggacccaatcagagtcgaatagaactcgactttcgcgaagagcatcagccttcgcgccattcttacacaaaccatagtctccccttgtcgaacagcatcagcgttcgagcccagtacccaactcaagaaaattttactcccgaagcagcatcagcgcttcggccccaagaatacatccccaacaaaatcacatccgagcaccaacagggctcggagtgttgtttcttgtggatagtcgacaaaccgaccaaggaccatcaggccttggcctgtcaccaacaagacaaaaactactcttctcgaagcagcatcagcgcttcgaaacactcgagcatacattgtgcctatttcttgggtggacgatcacgccacccatcgcctgacgaatttcaaaacacggacaaggacgagcacgagcacggctcgtcgttccacgtccaatacgattacttaggtttcgggatcacgatcacggatcccgcaccttcatcacttccactcaggacattcaagcaagcacgatcacggcttgctccacaagtctcaaccacagaaactaggaaatcggttcagcaccagcgaacccagtcgaaggtcaaacctcttcccacaaaactgcgaagcaggatcaccgcttcgccattccaacataccaaatcaaaaacaattagtcgtacagcatcagcgtacgaccacgcatcagtgactactatcaaaaaccaaaccgttcagcaacagcgaacggtacacacggaaaaatcaactggtttacaaatacgaaagacgagcacgctttcaactattacgaaaaacatccgaggcgatcagcaacagcgatcgcccggcggaaaacctcacaaaaacacgacaaacggaagcacgaacacggcttccgccgacaacccacaaacttacaacgacgcaaacggtgcaggatcaccgcaccgtacatcaaacacctcagatctcatt
MS2v5 sequence (24 old loops highlighted in grey; Zld sites in purple)
ggatcctacggtacttattgccaagaaagcacgagcatcagccgtgcctccaggtcgaatcttcaaacgacgacgatcacgcgtcgctccagtattccagggttcatcagatcctacggtacttattgccaagaaagcacgagcatcagccgtgcctccaggtcgaatcttcaaacgacgacgatcacgcgtcgctccagtattccagggttcatcagatcctacggtacttattgccaagaaagcacgagcatcagccgtgcctccaggtcgaatcttcaaacgacgacgatcacgcgtcgctccagtattccagggttcatcagatcctacggtacttattgccaagaaagcacgagcatcagccgtgcctccaggtcgaatcttcaaacgacgacgatcacgcgtcgctccagtattccagggttcatcagatcctacggtacttattgccaagaaagcacgagcatcagccgtgcctccaggtcgaatcttcaaacgacgacgatcacgcgtcgctccagtattccagggttcatcagatcctacggtacttattgccaagaaagcacgagcatcagccgtgcctccaggtcgaatcttcaaacgacgacgatcacgcgtcgctccagtattccagggttcatcagatcctacggtacttattgccaagaaagcacgagcatcagccgtgcctccaggtcgaatcttcaaacgacgacgatcacgcgtcgctccagtattccagggttcatcagatcctacggtacttattgccaagaaagcacgagcatcagccgtgcctccaggtcgaatcttcaaacgacgacgatcacgcgtcgctccagtattccagggttcatcagatcctacggtacttattgccaagaaagcacgagcatcagccgtgcctccaggtcgaatcttcaaacgacgacgatcacgcgtcgctccagtattccagggttcatcagatcctacggtacttattgccaagaaagcacgagcatcagccgtgcctccaggtcgaatcttcaaacgacgacgatcacgcgtcgctccagtattccagggttcatcagatcctacggtacttattgccaagaaagcacgagcatcagccgtgcctccaggtcgaatcttcaaacgacgacgatcacgcgtcgctccagtattccagggttcatcagatcctacggtacttattgccaagaaagcacgagcatcagccgtgcctccaggtcgaatcttcaaacgacgacgatcacgcgtcgctccagtattccagggttcatcggatct24XMS2v5 sequence
Live imaging
Virgin females maternally expressing MCP-GFP and H2Av-RFP were crossed with males of the MS2 reporter lines. 0–1 hour embryos were collected, dechorionated, and transferred onto a breathable membrane (Lumox Film, Sarstedt AG & Co.; Nümbrecht, Germany) in the middle of a plastic microscope slide (3D printed by Sculpteo; Créteil, France). Live imaging was performed using a Leica SP8 63X objective lens with the following settings: optical sections: 512×512 pixels, 30 z stacks 0.69 μm apart, 12bit; zoom: 1.7; time resolution: 40 seconds per frame. Laser power was measured using the X-Cite power meter, model No.XR2100) and set at 70% (main), 30% (488nm), and 10% (554nm). Embryos were imaged for approximately two hours, typically from nc 10 to early nc 14, as sog refines rapidly during mid-late nc 14 due to dynamic regulation by other factors [35].
High Resolution Imaging
Antibody and smFISH stained embryos with either 3TAG or 0TAG MS2 reporters were imaged using a LSM Zeiss 880 confocal microscope with 100X objective using the following settings: 1132×1132 pixels with 0.14 μm z-stack step size, 16bit, 1.8 zoom. Laser power was set at 1% (405nm), 5% (488nm), 15% (633nm). All images were captured using the the Airyscan detector array. Post-processing was carried out using the ZEN2012 software “Airyscan Processing” feature.
QUANTIFICATION AND STATISTICAL ANALYSIS
Live imaging Videos (Videos S1–S6) were analyzed using the Imaris (Bitplane, Oxford Instruments, Concord MA) “spots” function over and track using retrograde motion with a max frame gap of 3. MS2 foci were assumed to be 1μm across with a z-axis point spread function estimation of 2μm. After tracking, both intensity sum and position csv files were exported and analyzed using a series of custom R scripts. Tracks are assigned a nuclear cycle and zone position by referencing a manually generated annotation file containing all frames where anaphase was reached for each Video and a y-axis position of ventral repression at nuclear cycle 14. Transcriptional delay values for each tracked object were generated by subtracting the current frame number by the preceding anaphase frame number. Transcriptional dynamics at different dorsal-ventral positions was analyzed by subdividing each image into five zones along the DV axis. Zone 1 comprises the mesoderm, as determined by the Snail repression border that becomes obvious in early NC14. The remaining zones are defined by 20μm spatial bins that proceed dorsally, approximately 4 rows of nuclei per zone (schematized in Figure 2C).
To measure transcriptional kinetic parameters, we used individual foci and performed a linear fit on the first 25% of the intensity values over time. Time to steady-state values were calculated by intersecting the linear fit with a horizontal line generated by the averaging the top 20% of intensity values for foci signals. Statistical tests were performed using Welch’s T-test that assumes independent underlying variance. P-values shown in Figure 3H are visually represented as one asterisk indicating a p< 0.05, two indicating p< 0.01, and three indicating p< 0.001.
The smFISH nascent transcript values shown in Figure 4 were obtained by extracting the total fluorescence of large nuclear localized foci assumed to be the point of active transcription. This value was then divided by intensity values of single transcripts by assuming an average 0.3μm diffraction limited point again using the Imaris “spots”. These values formed a normal distribution from which the median value was selected as the fluorescence intensity value of a single transcript within a single frame. Dl intensity values for each nucleus were found by extracting the mean fluorescence of antibody stain signal within volumes defined by nuclear DAPI signal. This normalizes differences in Dl concentrations along the gradient between genotypes. Radial scans were performed using a custom R script that utilized the position values extracted from Imaris to interrogate .tif files of the Dl antibody stain. Error bars on enrichment plots in Figure 4C are standard error of the mean of individual enrichment curves in each positional bin. All plotting was performed with base R functions and the ggplot2 library.
DETAILED GENOTYPES:
1A: wt = ♀ y[1] w[*] X ♂ y[1] w[*]
1B: zld− prepared by zld RNAi in two crosses: 1st cross ♀ +; +; UAS-shRNA-zld X ♂ P{COG-GAL4:VP16}; P{Gal4-nos.NGT}40; P{nos-Gal4-VP16}; 2nd cross G1♀ P{COG-GAL4:VP16}/+; P{Gal4-nos.NGT}40/+; P{nos-Gal4-VP16}/UAS-shRNA-zld X ♂ yw
1D: 3TAG = y[1] w[*]; sog 3TAG-MS2-lacZ;+
1E: 0TAG = y[1] w[*]; sog 0TAG-MS2-lacZ;+
2A, C, E: 3TAG ♀ y[1] w[*]; P{w[+mC]=His2Av-mRFP1}II.2; P{w[+mC]=nos-MCP.EGFP}2 X ♂ y[1] w[*]; sog 3TAG-MS2-lacZ;+
2B, D, F: 0TAG ♀ y[1] w[*]; P{w[+mC]=His2Av-mRFP1}II.2; P{w[+mC]=nos-MCP.EGFP}2 X ♂ y[1] w[*]; sog 0TAG-MS2-lacZ;+
3B, D, F: 3TAG ♀ y[1] w[*]; P{w[+mC]=His2Av-mRFP1}II.2; P{w[+mC]=nos-MCP.EGFP}2 X ♂ y[1] w[*]; sog 3TAG-MS2-lacZ;+
3C, E, F: 0TAG ♀ y[1] w[*]; P{w[+mC]=His2Av-mRFP1}II.2; P{w[+mC]=nos-MCP.EGFP}2 X ♂ y[1] w[*]; sog 0TAG-MS2-lacZ;+
4A, B, C: 3TAG y[1] w[*]; sog 3TAG-MS2-lacZ;+
4A, B, C: 0TAG y[1] w[*]; sog 0TAG-MS2-lacZ;+
Figure S1 (Related to Figure 4)
S1A, C, D: 3TAG y[1] w[*]; sog 3TAG-MS2-lacZ;+
S1B, C, D: 0TAG y[1] w[*]; sog 0TAG-MS2-lacZ;+
Videos (Related to Figures 2 and 3):
Supplementary Material
Video S1. Time lapse video of sog 3TAG1. Related to Figures 2 and 3. Time lapse videos of sog 3TAG1 embryo in NC10-NC14. Embryos were collected from females carrying MCP-GFP (green) and H2Av-RFP (red) mated to males homozygous for the MS2 transgene reporter lines and prepared for live imaging (see STAR Methods) on a Leica SP8 with a 63X objective lens and the following settings: optical sections: 512×512 pixels, 30 z stacks 0.69 μm apart, 12bit; zoom: 1.7; time resolution: 40 seconds per frame (see STAR Methods). Scale bar = 10μm.
Video S2. Time lapse video of sog 0TAG1. Related to Figures 2 and 3. Time lapse videos of sog 0TAG1 embryo in NC10-NC14. Embryos were collected from females carrying MCP-GFP (green) and H2Av-RFP (red) mated to males homozygous for the MS2 transgene reporter lines and prepared for live imaging (see STAR Methods) on a Leica SP8 with a 63X objective lens and the following settings: optical sections: 512×512 pixels, 30 z stacks 0.69 μm apart, 12bit; zoom: 1.7; time resolution: 40 seconds per frame (see STAR Methods). Scale bar = 10μm.
Video S3. Time lapse video of sog 3TAG2. Related to Figures 2 and 3. Time lapse videos of sog 3TAG2 embryo in NC10-NC14. Embryos were collected from females carrying MCP-GFP (green) and H2Av-RFP (red) mated to males homozygous for the MS2 transgene reporter lines and prepared for live imaging (see STAR Methods) on a Leica SP8 with a 63X objective lens and the following settings: optical sections: 512×512 pixels, 30 z stacks 0.69 μm apart, 12bit; zoom: 1.7; time resolution: 40 seconds per frame (see STAR Methods). Scale bar = 10μm.
Video S4. Time lapse video of sog 0TAG2. Related to Figures 2 and 3. Time lapse videos of sog 0TAG2 embryo in NC10-NC14. Embryos were collected from females carrying MCP-GFP (green) and H2Av-RFP (red) mated to males homozygous for the MS2 transgene reporter lines and prepared for live imaging (see STAR Methods) on a Leica SP8 with a 63X objective lens and the following settings: optical sections: 512×512 pixels, 30 z stacks 0.69 μm apart, 12bit; zoom: 1.7; time resolution: 40 seconds per frame (see STAR Methods). Scale bar = 10μm.
Video S5. Time lapse video of sog 3TAG3. Related to Figures 2 and 3. Time lapse videos of sog 3TAG3 embryo in NC10-NC14. Embryos were collected from females carrying MCP-GFP (green) and H2Av-RFP (red) mated to males homozygous for the MS2 transgene reporter lines and prepared for live imaging (see STAR Methods) on a Leica SP8 with a 63X objective lens and the following settings: optical sections: 512×512 pixels, 30 z stacks 0.69 μm apart, 12bit; zoom: 1.7; time resolution: 40 seconds per frame (see STAR Methods). Scale bar = 10μm.
Video S6. Time lapse video of sog 0TAG3. Related to Figures 2 and 3. Time lapse videos of sog 0TAG3 embryo in NC10-NC14. Embryos were collected from females carrying MCP-GFP (green) and H2Av-RFP (red) mated to males homozygous for the MS2 transgene reporter lines and prepared for live imaging (see STAR Methods) on a Leica SP8 with a 63X objective lens and the following settings: optical sections: 512×512 pixels, 30 z stacks 0.69 μm apart, 12bit; zoom: 1.7; time resolution: 40 seconds per frame (see STAR Methods). Scale bar = 10μm.
KEY RESOURCES TABLE
| REAGENT or RESOURCE | SOURCE | IDENTIFIER |
|---|---|---|
| Antibodies | ||
| Sheep anti-DIG-AP antibody | Roche | Cat# 11093274910, RRID:AB_2734716 |
| Mouse anti-DL antibody (7A4) | Developmental Studies Hybridoma Bank | Cat# anti-Dorsal 7A4, RRID:AB_528204 |
| Alexa fluor 488 goat anti mouse secondary antibody | ThermoFisher Scientific | Cat# A-11001, RRID:AB_2534069 |
| Chemicals, Peptides, and Recombinant Proteins | ||
| 5-Bromo-4-chloro-3-indolyl phosphate p-toluidine salt(BCIP) | Roche | Cat# 10760994001 |
| 4-Nitro blue tetrazolium chloride(NBT) | Roche | Cat# 11585029001 |
| DIG RNA labeling mix | Roche | Cat# 11277073910 |
| RNA FISH Hybridization Buffer |
Stellaris (LGC Biosearch Technologies) | Cat# SMF-HB1–10 |
| DAPI | Sigma-Aldrich | Cat# D9542 |
| Aqua-Poly/Mount | Polysciences | Cat# 18606–20 |
| Number 1.5 glass coverslips | Fisher Scientific | Cat# 22266858 |
| Gibson Assembly Master Mix | New England Biolabs, Inc | Cat# E2611S |
| lacZ Atto633 smFISH Probe | Shawn Little’s lab | [28] |
| lacZ ISH DIG RNA Probe | This lab | |
| sog ISH DIG RNA Probe | This lab | |
| Experimental Models: Drosophila Strains | ||
| y[1] w[1118] | Bloomington Drosophila Stock Center | Cat# 6598 |
| y[1] w[*]; P{w[+mC]=His2Av-mRFP1}II.2; P{w[+mC]=nos-MCP.EGFP}2 | Bloomington Drosophila Stock Center | Cat# 60340, RRID:BDSC_60340 |
| Maternal Triple Driver(MTD)-Gal4: P{COG-GAL4:VP16}; P{Gal4-nos.NGT}40; P{nos-Gal4-VP16} | Bloomington Drosophila Stock Center | Cat# 31777, RRID:BDSC_31777 |
| UAS-shRNA-zld | This lab | [8] |
| sog 3TAG-MS2-lacZ | This paper | N/A |
| sog 0TAG-MS2-lacZ | This paper | N/A |
| Recombinant DNA | ||
| pib-evepr-ms2v5(-TAG)-lacZ plasmid | This paper | N/A |
| Software and Algorithms | ||
| FIJI (ImageJ) | NIH | http://fiji.sc |
| Matlab | The Mathworks Inc. | https://www.mathworks.com |
| Imaris | Bitplane | www.bitplane.org |
| R | The R Foundation | https://www.r-project.org |
| LAS X | Leica Microsystems Inc | https://www.cellularimaging.nl/leica-las-x/ |
| N2012 | CarlZE Zeiss Inc | https://www.zeiss.com/corporate/int/home.html |
| Other | ||
| Confocal microscope | Leica | SP8 |
| Confocal microscope | Zeiss | LSM 880 |
| Microscope | Zeiss | Axioskop |
| Digital camera for microscopy | Zeiss | AxioCam MRc |
| Power meter(X-cite) | Lumen Dynamics Group Inc, Canada | Model # XR2100 |
| Breathable membrane (Lumox Film) | Sarstedt AG & Co.; Nümbrecht, Germany | Cat# 94.6077.317 |
| Plastic microscope slide (3D printed) | Sculpteo; Créteil, France | N/A |
Highlights.
The expression domain of the Dorsal target-gene sog narrows in the absence of Zelda
Using MS2 reporter transgenes, this can be accurately recapitulated in living embryos
Without Zelda, the onset and degree of reporter activation becomes graded like Dorsal
Zelda promotes accumulation of Dorsal protein at the site of the enhancer
Acknowledgements
The authors would like to thank Shawn Little for the lacZ Atto633 smFISH probe, and Sirus Mrazik and Justin Kai-Ming Yeung for help with in situs. We also thank Edo Kussell, Carlos Carmona-Fontaine, Grace Avecilla and Timothee Lionnet for helpful discussions regarding quantitative analysis of MS2 data, and Jonathan Liu, Jacques Bothma, and Stephen Small for insightful comments on the manuscript. The research was supported by a National Institute of Health research grant to CAR (GM63024). PHW was supported by a National Institute of Health training grant (5T32HD007520–20). HGG was supported by the Burroughs Wellcome Fund Career Award at the Scienti1c Interface, the Sloan Research Foundation, the Human Frontiers Science Program, the Searle Scholars Program, the Shurl & Kay Curci Foundation, the Hellman Foundation, the NIH Director’s New Innovator Award (DP2 OD024541–01), and an NSF CAREER Award (1652236).
Footnotes
Publisher's Disclaimer: This is a PDF file of an unedited manuscript that has been accepted for publication. As a service to our customers we are providing this early version of the manuscript. The manuscript will undergo copyediting, typesetting, and review of the resulting proof before it is published in its final citable form. Please note that during the production process errors may be discovered which could affect the content, and all legal disclaimers that apply to the journal pertain.
Declaration of Interests
The authors declare no competing interests.
References:
- 1.Steward R, McNally FJ, and Schedl P (1984). Isolation of the dorsal locus of Drosophila. Nature 311, 262–265. [DOI] [PubMed] [Google Scholar]
- 2.Stathopoulos A, and Levine M (2002). Dorsal gradient networks in the Drosophila embryo. Dev. Biol 246, 57–67. [DOI] [PubMed] [Google Scholar]
- 3.Liang H-L, Nien C-Y, Liu H-Y, Metzstein MM, Kirov N, and Rushlow C (2008). The zinc-finger protein Zelda is a key activator of the early zygotic genome in Drosophila. Nature 456, 400–403. [DOI] [PMC free article] [PubMed] [Google Scholar]
- 4.Schulz KN, Bondra ER, Moshe A, Villalta JE, Lieb JD, Kaplan T, McKay DJ, and Harrison MM (2015). Zelda is differentially required for chromatin accessibility, transcription factor binding, and gene expression in the early Drosophila embryo. Genome Res 25, 1715–1726. [DOI] [PMC free article] [PubMed] [Google Scholar]
- 5.Nien C-Y, Liang H-L, Butcher S, Sun Y, Fu S, Gocha T, Kirov N, Manak JR, and Rushlow C (2011). Temporal coordination of gene networks by Zelda in the early Drosophila embryo. PLoS Genet 7, e1002339. [DOI] [PMC free article] [PubMed] [Google Scholar]
- 6.Harrison MM, and Eisen MB (2015). Transcriptional Activation of the Zygotic Genome in Drosophila. Curr. Top. Dev. Biol 113, 85–112. [DOI] [PubMed] [Google Scholar]
- 7.Foo SM, Sun Y, Lim B, Ziukaite R, O’Brien K, Nien C-Y, Kirov N, Shvartsman SY, and Rushlow CA (2014). Zelda Potentiates Morphogen Activity by Increasing Chromatin Accessibility. Curr. Biol 24, 1341–1346. [DOI] [PMC free article] [PubMed] [Google Scholar]
- 8.Sun Y, Nien C-Y, Chen K, Liu H-Y, Johnston J, Zeitlinger J, and Rushlow C (2015). Zelda overcomes the high intrinsic nucleosome barrier at enhancers during Drosophila zygotic genome activation. Genome Res 25, 1703–1714. [DOI] [PMC free article] [PubMed] [Google Scholar]
- 9.Harrison MM, Li X-Y, Kaplan T, Botchan MR, and Eisen MB (2011). Zelda binding in the early Drosophila melanogaster embryo marks regions subsequently activated at the maternal-to-zygotic transition. PLoS Genet 7, e1002266. [DOI] [PMC free article] [PubMed] [Google Scholar]
- 10.Mir M, Reimer A, Haines JE, Li XY, Stadler M, Garcia H, Eisen MB and Darzacq X, (2017). Dense Bicoid hubs accentuate binding along the morphogen gradient. Genes Dev 31, 1784–1794. [DOI] [PMC free article] [PubMed] [Google Scholar]
- 11.Kanodia JS, Liang H-L, Kim Y, Lim B, Zhan M, Lu H, Rushlow CA, and Shvartsman SY (2012). Pattern formation by graded and uniform signals in the early Drosophila embryo. Biophys. J 102, 427–433. [DOI] [PMC free article] [PubMed] [Google Scholar]
- 12.Larson DR, Zenklusen D, Wu B, Chao JA, and Singer RH (2011). Real-time observation of transcription initiation and elongation on an endogenous yeast gene. Science 332, 475–478. [DOI] [PMC free article] [PubMed] [Google Scholar]
- 13.Forrest KM, and Gavis ER (2003). Live imaging of endogenous RNA reveals a diffusion and entrapment mechanism for nanos mRNA localization in Drosophila. Curr. Biol 13, 1159–1168. [DOI] [PubMed] [Google Scholar]
- 14.Garcia HG, Tikhonov M, Lin A, and Gregor T (2013). Quantitative imaging of transcription in living Drosophila embryos links polymerase activity to patterning. Curr. Biol 23, 2140–2145. [DOI] [PMC free article] [PubMed] [Google Scholar]
- 15.Lucas T, Ferraro T, Roelens B, De Las Heras Chanes J, Walczak AM, Coppey M, and Dostatni N (2013). Live Imaging of Bicoid-Dependent Transcription in Drosophila Embryos. Curr. Biol 23, 2135–2139. [DOI] [PubMed] [Google Scholar]
- 16.Lucas T, Tran H, Romero CAP, Guillou A, Fradin C, Coppey M, Walczak AM, and Dostatni N (2018). 3 minutes to precisely measure morphogen concentration. (2018). 3 minutes to precisely measure morphogen concentration. PLoS Genet 14, e1007676. [DOI] [PMC free article] [PubMed] [Google Scholar]
- 17.Wu B, Miskolci V, Sato H, Tutucci E, Kenworthy CA, Donnelly SK, Yoon YJ, Cox D, Singer RH, and Hodgson L (2015). Synonymous modification results in high-fidelity gene expression of repetitive protein and nucleotide sequences. Genes Dev 29, 876–886. [DOI] [PMC free article] [PubMed] [Google Scholar]
- 18.Hong J-W, Hendrix DA, and Levine MS (2008). Shadow enhancers as a source of evolutionary novelty. Science 321, 1314. [DOI] [PMC free article] [PubMed] [Google Scholar]
- 19.Ozdemir A, Ma L, White KP, and Stathopoulos A (2014). Su(H)-mediated repression positions gene boundaries along the dorsal-ventral axis of Drosophila embryos. Dev. Cell 31, 100–113. [DOI] [PMC free article] [PubMed] [Google Scholar]
- 20.Saint R, and Clarkson M (2000). Pictures in cell biology. A functional marker for Drosophila chromosomes in vivo. Trends Cell Biol 10, 553. [DOI] [PubMed] [Google Scholar]
- 21.Kanodia JS, Rikhy R, Kim Y, Lund VK, DeLotto R, Lippincott-Schwartz J, and Shvartsman SY (2009). Dynamics of the Dorsal morphogen gradient. Proc. Natl. Acad. Sci. U. S. A 106, 21707–21712. [DOI] [PMC free article] [PubMed] [Google Scholar]
- 22.Liberman LM, Reeves GT, and Stathopoulos A (2009). Quantitative imaging of the Dorsal nuclear gradient reveals limitations to threshold-dependent patterning in Drosophila. Proc. Natl. Acad. Sci. U. S. A 106, 22317–22322. [DOI] [PMC free article] [PubMed] [Google Scholar]
- 23.Reeves GT, Trisnadi N, Truong TV, Nahmad M, Katz S, and Stathopoulos A (2012). Dorsal-ventral gene expression in the Drosophila embryo reflects the dynamics and precision of the dorsal nuclear gradient. Dev. Cell 22, 544–557. [DOI] [PMC free article] [PubMed] [Google Scholar]
- 24.Mir M, Stadler MR, Ortiz SA, Hannon CE, Harrison MM, Darzacq X, and Eisen MB (2018). Dynamic multifactor hubs interact transiently with sites of active transcription in embryos. Elife 7 Available at: 10.7554/eLife.40497. [DOI] [PMC free article] [PubMed] [Google Scholar]
- 25.Dufourt J, Trullo A, Hunter J, Fernandez C, Lazaro J, Dejean M, Morales L, Nait-Amer S, Schulz KN, Harrison MM, et al. (2018). Temporal control of gene expression by the pioneer factor Zelda through transient interactions in hubs. Nat. Commun 9, 5194. [DOI] [PMC free article] [PubMed] [Google Scholar]
- 26.He F, Ren J, Wang W, and Ma J (2011). A Multiscale Investigation of Bicoid-Dependent Transcriptional Events in Drosophila Embryos. PLoS One 6, e19122. [DOI] [PMC free article] [PubMed] [Google Scholar]
- 27.Xu H, Sepúlveda LA, Figard L, Sokac AM, and Golding I (2015). Combining protein and mRNA quantification to decipher transcriptional regulation. Nat. Methods 12, 739–742. [DOI] [PMC free article] [PubMed] [Google Scholar]
- 28.Little SC, Tikhonov M, and Gregor T (2013). Precise Developmental Gene Expression Arises from Globally Stochastic Transcriptional Activity. Cell 154, 789–800. [DOI] [PMC free article] [PubMed] [Google Scholar]
- 29.Tsai A, Muthusamy AK, Alves MR, Lavis LD, Singer RH, Stern DL, and Crocker J (2017). Nuclear microenvironments modulate transcription from low-affinity enhancers. Elife 6 Available at: 10.7554/eLife.28975. [DOI] [PMC free article] [PubMed] [Google Scholar]
- 30.Li X-Y, and Eisen MB (2018). Zelda potentiates transcription factor binding to zygotic enhancers by increasing local chromatin accessibility during early Drosophila melanogaster embryogenesis Available at: 10.1101/380857. [DOI]
- 31.Xu Z, Chen H, Ling J, Yu D, Struffi P, and Small S (2014). Impacts of the ubiquitous factor Zelda on Bicoid-dependent DNA binding and transcription in Drosophila. Genes Dev 28, 608–621. [DOI] [PMC free article] [PubMed] [Google Scholar]
- 32.Groth AC, Fish M, Nusse R, and Calos MP (2004). Construction of transgenic Drosophila by using the site-specific integrase from phage phiC31. Genetics 166, 1775–1782. [DOI] [PMC free article] [PubMed] [Google Scholar]
- 33.Bischof J, Maeda RK, Hediger M, Karch F, and Basler K (2007). An optimized transgenesis system for Drosophila using germ-line-specific phiC31 integrases. Proc. Natl. Acad. Sci. U. S. A 104, 3312–3317. [DOI] [PMC free article] [PubMed] [Google Scholar]
- 34.Hertz GZ, and Stormo GD (1999). Identifying DNA and protein patterns with statistically significant alignments of multiple sequences. Bioinformatics 15, 563–577. [DOI] [PubMed] [Google Scholar]
- 35.Francois V, Solloway M, O’Neill JW, Emery J, and Bier E (1994). Dorsal-ventral patterning of the Drosophila embryo depends on a putative negative growth factor encoded by the short gastrulation gene. Genes Dev 8, 2602–2616. [DOI] [PubMed] [Google Scholar]
Associated Data
This section collects any data citations, data availability statements, or supplementary materials included in this article.
Supplementary Materials
Video S1. Time lapse video of sog 3TAG1. Related to Figures 2 and 3. Time lapse videos of sog 3TAG1 embryo in NC10-NC14. Embryos were collected from females carrying MCP-GFP (green) and H2Av-RFP (red) mated to males homozygous for the MS2 transgene reporter lines and prepared for live imaging (see STAR Methods) on a Leica SP8 with a 63X objective lens and the following settings: optical sections: 512×512 pixels, 30 z stacks 0.69 μm apart, 12bit; zoom: 1.7; time resolution: 40 seconds per frame (see STAR Methods). Scale bar = 10μm.
Video S2. Time lapse video of sog 0TAG1. Related to Figures 2 and 3. Time lapse videos of sog 0TAG1 embryo in NC10-NC14. Embryos were collected from females carrying MCP-GFP (green) and H2Av-RFP (red) mated to males homozygous for the MS2 transgene reporter lines and prepared for live imaging (see STAR Methods) on a Leica SP8 with a 63X objective lens and the following settings: optical sections: 512×512 pixels, 30 z stacks 0.69 μm apart, 12bit; zoom: 1.7; time resolution: 40 seconds per frame (see STAR Methods). Scale bar = 10μm.
Video S3. Time lapse video of sog 3TAG2. Related to Figures 2 and 3. Time lapse videos of sog 3TAG2 embryo in NC10-NC14. Embryos were collected from females carrying MCP-GFP (green) and H2Av-RFP (red) mated to males homozygous for the MS2 transgene reporter lines and prepared for live imaging (see STAR Methods) on a Leica SP8 with a 63X objective lens and the following settings: optical sections: 512×512 pixels, 30 z stacks 0.69 μm apart, 12bit; zoom: 1.7; time resolution: 40 seconds per frame (see STAR Methods). Scale bar = 10μm.
Video S4. Time lapse video of sog 0TAG2. Related to Figures 2 and 3. Time lapse videos of sog 0TAG2 embryo in NC10-NC14. Embryos were collected from females carrying MCP-GFP (green) and H2Av-RFP (red) mated to males homozygous for the MS2 transgene reporter lines and prepared for live imaging (see STAR Methods) on a Leica SP8 with a 63X objective lens and the following settings: optical sections: 512×512 pixels, 30 z stacks 0.69 μm apart, 12bit; zoom: 1.7; time resolution: 40 seconds per frame (see STAR Methods). Scale bar = 10μm.
Video S5. Time lapse video of sog 3TAG3. Related to Figures 2 and 3. Time lapse videos of sog 3TAG3 embryo in NC10-NC14. Embryos were collected from females carrying MCP-GFP (green) and H2Av-RFP (red) mated to males homozygous for the MS2 transgene reporter lines and prepared for live imaging (see STAR Methods) on a Leica SP8 with a 63X objective lens and the following settings: optical sections: 512×512 pixels, 30 z stacks 0.69 μm apart, 12bit; zoom: 1.7; time resolution: 40 seconds per frame (see STAR Methods). Scale bar = 10μm.
Video S6. Time lapse video of sog 0TAG3. Related to Figures 2 and 3. Time lapse videos of sog 0TAG3 embryo in NC10-NC14. Embryos were collected from females carrying MCP-GFP (green) and H2Av-RFP (red) mated to males homozygous for the MS2 transgene reporter lines and prepared for live imaging (see STAR Methods) on a Leica SP8 with a 63X objective lens and the following settings: optical sections: 512×512 pixels, 30 z stacks 0.69 μm apart, 12bit; zoom: 1.7; time resolution: 40 seconds per frame (see STAR Methods). Scale bar = 10μm.