

Abstract
High level expression of many eukaryotic proteins for structural analysis is likely to require a eukaryotic host since many proteins are either insoluble or lack essential post-translational modifications when expressed in E. coli. The well-studied eukaryote Saccharomyces cerevisiae possesses several attributes of a good expression host: it is simple and inexpensive to culture, has proven genetic tractability, and has excellent recombinant DNA tools. We demonstrate here that this yeast exhibits three additional characteristics that are desirable in a eukaryotic expression host. First, expression in yeast significantly improves the solubility of proteins that are expressed but insoluble in E. coli. The expression and solubility of 83 Leishmania major ORFs were compared in S. cerevisiae and in E. coli, with the result that 42 of the 64 ORFs with good expression and poor solubility in E. coli are highly soluble in S. cerevisiae. Second, the yield and purity of heterologous proteins expressed in yeast is sufficient for structural analysis, as demonstrated with both small scale purifications of 21 highly expressed proteins and large scale purifications of 2 proteins, which yield highly homogeneous preparations. Third, protein expression can be improved by altering codon usage, based on the observation that a codon-optimized construct of one ORF yields three-fold more protein. Thus, these results provide direct verification that high level expression and purification of heterologous proteins in S. cerevisiae is feasible and likely to improve expression of proteins whose solubility in E. coli is poor.
Keywords: Yeast, structural genomics, heterologous expression, protein solubility, S. cerevisiae
Summary:
Development of eukaryotic hosts for high level expression and purification of proteins for structural analysis is important because expression in the bacterium E. coli often results in improperly folded and insoluble proteins. We show here that the yeast Saccharomyces cerevisiae exhibits four qualities requisite to a eukaryotic expression host: improved solubility of proteins that are insoluble when expressed in E. coli, sufficient yields of protein for structural analysis, near homogeneity of purified protein preparations, and improved expression from altered codon usage.
Introduction
Development of heterologous expression systems has been and is key to efficient structural analysis, because the production and purification of large amounts of soluble, folded protein continues to be a rate limiting step for both NMR and x-ray crystallography (Fussenegger and Hauser, 2007; Peti and Page, 2007). E. coli has been the host for the expression of a vast number of proteins for structural analysis, in large part due to the ease of genetic manipulation in E. coli, its rapid and inexpensive growth, as well as the ease of isotope and selenomethionine labeling of proteins for structural analysis (Christendat et al., 2000; Peti and Page, 2007). Moreover, regulated expression in E. coli can yield large quantities of highly purified protein from a single liter of culture: between 0.9 mg and 480 mg of purified protein per liter in one study in which 63 Plasmodium falciparum ORFs were purified (Mehlin et al., 2006).
Structural genomics initiatives, which developed as a response to the vast increase in the number of protein sequences from genome sequencing projects, have not only resulted in the solution of over 3,300 new protein structures comprising over half of the novel structures since 2004 (Burley et al., 2008; Chandonia and Brenner, 2006; Levitt, 2007; Nair et al., 2009), but have also prompted a thorough investigation of the rate limiting steps in structural analysis. This investigation has, in turn, yielded novel high throughput methods to clone and express ORFs, and to analyze and purify proteins. Each of fourteen worldwide structural genomics centers, which as of December, 2007, had collectively targeted, expressed and purified 109,423 proteins, track the success or failure of each step required to obtain a structure for every target protein. Each center initially expresses most genes in E. coli with the vast majority expressed under control of T7 or T5 promoters as His6 fusions (Graslund et al., 2008). Analysis of progress on this large number of diverse targets, which are chosen in large measure to provide novel structures, illustrates that obtaining purified protein is a rate limiting step for structural analysis. This problem is even more serious for eukaryotic proteins. Analysis of the total target set indicates that 36% of 8,043 targets from archaea and 30% of 58,806 targets from bacteria were purified, while only 19% of 42,439 targets from eukarya were purified by structural genomics centers (Graslund et al., 2008). Thus, there is tremendous attrition of targets due to inability to obtain purified protein, and this must be rectified to extend coverage of the structural landscape, as well as to obtain structural information on many medically and biologically important targets.
That the lack of solubility of proteins is a major obstacle to obtaining purified protein can be inferred from an examination of the fraction of proteins that are not soluble when expressed at high levels in E. coli. In 2002, the Northeast Structural Genomics Consortium reported that among 1,295 expressed proteins, only 773 were soluble (Service, 2002). Furthermore, since most of the solved structures were from bacterial proteins, Service (Service, 2002) inferred that eukaryotic proteins were even more problematic. In a study of 424 non-membrane proteins from the thermophilic archaeon Methanobacterium thermoautotrophicum, Christendat et al. (Christendat et al., 2000) found that while 80% of these proteins are expressed in E. coli, less than half are soluble, and only 20% are directly suitable for structural analysis, since a large fraction of the soluble proteins (57 of 100) display poor NMR spectra consistent with either non-specific aggregation or an unfolded state. Among eukaryotic proteins, approximately half of the cloned genes express protein, but solubility is markedly lower: on the order of 10–15% of full length human proteins are soluble when expressed in E. coli (Braun et al., 2002; Braun and LaBaer, 2003), and about 30% of C. elegans genes, expressed in E. coli, produce soluble protein (1,536 soluble of 4,854 expressed ORFs in 10,167 attempted) (Luan et al., 2004). In the parasitic protozoa, 19% (63 of 337) of expressed genes from Plasmodium falciparum produce soluble protein and 27% (655 of 2,406) of highly expressing genes from Trypanosoma cruzi, Trypanosoma brucei and Leishmania major are soluble (Phizicky and Grayhack, 2006) (E.Q. and E.M.P., unpublished data).
The magnitude of the problem with solubility can also be inferred from the number and variety of approaches that have been tried both to improve and to evaluate solubility. Numerous vectors, strains, and affinity purification tags, as well as technologies to accelerate expression and solubility screening have all been developed to maximize heterologous protein expression in E. coli (Chatterjee and Esposito, 2006; Esposito and Chatterjee, 2006; Peti and Page, 2007; Waugh, 2005). In several systematic studies, various fusion tags (GST, MBP, NusA, thioredoxin, ubiquitin, His6, the Z domain of protein A, the Gbl domain of protein G, and SUMO) have been screened for their effects on solubility of multiple proteins (Hammarstrom et al., 2002; Marblestone et al., 2006; Niiranen et al., 2007). Significant improvements in solubility of individual proteins are observed with various tags, but there is no single best solution for all proteins. To obtain soluble protein from five genes of the fish pathogen Vibrio salmonicida, Niiranen et al. (Niiranen et al., 2007) compared expression using 6 affinity tags, 2 different E. coli hosts, and induction at three temperatures. Systematic analysis of the effects of codons usage on expression of multiple genes (Burgess-Brown et al., 2008) demonstrated improvement in expression for 22 of 30 genes tested and improved solubility for 11 genes either due to recoding or tRNA over-expression. Multiple truncations at the N and C termini (Gileadi et al., 2008; Klock et al., 2008) as well as introduction of mutations (Roodveldt et al., 2005; Roodveldt and Tawfik, 2005) are routinely used by many laboratories to obtain soluble protein. In addition, constructs are routinely screened at multiple temperatures in E. coli bearing mutations in genes that affect the redox environment of the cell. To facilitate disulfide bond formation, an E. coli strain bearing mutations in genes encoding both thioredoxin reductase, and glutathione oxidoreductase was used to effect soluble expression of the extracellular N terminal domain of ISG75 from Trypanosoma brucei gambiense; in addition efficient translation of the heterologous gene was facilitated by inclusion of a plasmid encoding 3 tRNA genes (Tran et al., 2008). Furthermore, the problem with protein solubility can also be gauged from the numerous methods that have been developed to rapidly screen for folded, soluble protein, including fusion reporters such as GFP, CAT, LacZα and others (Waldo, 2003) as well as the continued development of reporters with different sensitivities to protein misfolding (Cabantous et al., 2008).
These problems, as well as the fact that many eukaryotic proteins bear post-translational modifications which are not carried out correctly in E. coli, has spurred the development of other expression hosts, primarily eukaryotic hosts. The single cell yeast S. cerevisiae shares with E. coli many of the traits that have made E. coli an ideal expression system, such as ease of genetic manipulation and rapid, inexpensive growth. In addition, yeast has been used for high level protein expression and affinity purification, with yields of 2 mg of purified protein per liter of culture (Gelperin et al., 2005), as well as for heterologous expression, purification and structure determination of several proteins, including the catalytic domain of the human RNA editing protein ADAR2 (Macbeth et al., 2005) and the membrane Ca2+-ATPase protein from rabbit sarcoplasmic-endoplasmic reticulum (Jidenko et al., 2005).
We and others have begun to develop tools to improve the use of S. cerevisiae as a host for high level protein expression and purification. We recently demonstrated that genetic manipulation of the genes encoding methionine adenosyltransferase allows growth of yeast on toxic levels of selenomethionine, efficient incorporation of selenomethionine into proteins and solution of the structure of tryptophan tRNA synthetase by MAD phasing (Malkowski et al., 2007). Holz et al. (Holz et al., 2003) demonstrated high throughput expression of 221 human genes in yeast, nearly half of which could be purified by IMAC affinity chromatography, but the yields and solubility were not quantified.
Since it is, in large measure, the problem with solubility that we hope to resolve with expression in a eukaryotic host, we addressed this issue directly by determining whether or not proteins that are insoluble in E. coli are soluble when expressed in S. cerevisiae. We show here that 42 of 64 ORFs from Leishmania major that exhibit good expression but little or no solubility when expressed in E. coli are expressed in yeast with solubility levels above 50%. Furthermore, both the yield and purity of many protein preparations are sufficient for structural analysis, since twenty-one highly expressed proteins were purified by affinity chromatography with good yields, and two large scale preparations yield approximately 50 mg of nearly homogenous protein. Finally, we demonstrate that genetic recoding of one L. major gene with optimal yeast codons yields somewhat improved expression in S. cerevisiae, similar to results in E. coli. Thus, S. cerevisiae is a viable alternative to E. coli as a host for protein expression and purification since many of the same tools are operative in both organisms.
Materials and Methods
Plasmid and Strains
For expression in E. coli strain BL21 DE3, L. major genes were PCR amplified and cloned in either BG1861 or AVA421 vectors using standard LIC (ligation independent cloning) procedures (Aslanidis and de Jong, 1990); BG1861 has been described previously and is used to express proteins with an N terminal MAHHHHHH tag preceding the native methionine (Alexandrov et al., 2004). AVA421 is a LIC vector that is used to express protein with an N terminal fusion tag of MAHHHHHHMGTLEAQTQGPGS, which can be cleaved with Rhinovirus 3C protease leaving an N terminal GS preceding the native methionine. ORFs amplified with primer pairs containing the common sequences GGGTCCTGGTTCGATG and CTTGTTCGTGCTGTTTA on the 5’ and 3’ oligonucleotides respectively are treated with T4 DNA polymerase and dTTP, and annealed with AVA421vector that has been digested with Nru1-Pme1, and treated with T4 DNA polymerase in the presence of dATP.
For expression in yeast, L. major ORFs were cloned under PGAL1 control into the previously described LIC vector BG2483, a 2 μ URA3 vector in which ORFs are expressed under control of the GAL1 promoter with their C terminus fused to a complex tag containing a 3C site, followed by an HA epitope, His6, and the ZZ domain of protein A (Malkowski et al., 2007). ORFs are amplified with addition of common sequences: AATTCCATCAACCTTAAAATG and CTTCCAAACCACT to the 5’ and 3’end of gene-specific oligonucleotides for cloning into this vector, and cloned into Pac1- BbrP1 digested BG2483 DNA by standard LIC procedures (Aslanidis and de Jong, 1990; Malkowski et al., 2007). ORFs are expressed in yeast strain BCY123 (MATa, pep4–3::HIS3, prb1::LEU2, bar1:: HISG, lys2:: GAL1/10-GAL4, can1, ade2, trp1, his3, ura3–52, leu2–3,112), obtained from M. Macbeth (Macbeth et al., 2004).
Protein Expression, Western Detection and Affinity Purification.
Yeast transformants, grown overnight in SD-uracil at 30°C, were diluted 20-fold into 5 ml Synthetic (S) dropout media –uracil (see (Sherman, 1986)), with 2% raffinose, grown for 7 hours at 30oC, diluted in 30 ml of the same media to OD600 of 0.02 and grown overnight to OD600 between 0.8 and 1.2, and then induced for protein expression by addition of 15 ml 3X YP media with 6% galactose (see (Sherman, 1986)) and continued growth for 24 hours, at which time cells were split, harvested and frozen.
Cells (from 22.5 ml growth) were resuspended in 1 ml extraction buffer A (50 mM Tris-Cl, pH 7.5, 1 mM EDTA, 4 mM MgCl2, 10% glycerol, 1M NaCl, 5 mM β-mercaptoethanol) containing 2.5 μg/ml pepstatin, 2.5 μg/ml leupeptin and 1 mM pefabloc (Roche), were transferred to tubes containing 0.5 mm glass beads and 0.5 mM PMSF, lysed by bead beating, and the beads were removed as previously described (Gelperin et al., 2005) followed by addition of 0.5 mM PMSF. To obtain samples for total protein analysis, 1 μl of lysed cells was diluted into 50 μl prewarmed SDS loading buffer with 0.08 μg/μl PMSF held at 95°C; the mixture was vortexed, boiled for 1 min, vortexed, boiled and vortexed. To obtain soluble protein, lysed cells were centrifuged at maximum speed (13,000 rpm) for 10 min in 2 ml microcentrifuge tubes at 4°C and the supernatant was removed to a new tube containing PMSF (0.5 mM additional) and quick frozen on dry ice. Soluble protein was assessed by diluting 1 μl crude extract in 50 μl SDS loading dye.
For both total and soluble protein, 5 μl (~0.6–1 μg of total protein) was subjected to electrophoresis on 8%−16% Tris-HCl SDS-PAGE Criterion gels (Bio-Rad), after which the protein in the gel was transferred to nitrocellulose membranes by electrophoresis at 100V, 200mA for 2 hrs at 4°C in Transfer Buffer (0.025 M Tris base, 0.192 M glycine, 0.02% SDS, 20% methanol). Membranes were rinsed in PBS (10 mM Sodium Phosphate pH 7.8, 150 mM NaCl), blocked in PBS containing 5% Calf Serum and 0.1% Tween overnight, rinsed twice for 5 min in PBS with 0.1% Tween, incubated with Rat anti-HA high affinity monoclonal antibody clone 3F10 (Roche 1 867 423) at 1: 3,000 dilution in PBS containing 5% Calf Serum for 2 hrs, washed five times with PBS containing 5% Calf Serum and 0.1% Tween. Membranes were incubated for 2 hours with Peroxidase-conjugated AffiniPure Goat Anti-Rat IgG (Jackson ImmunoResearch 112–035-003) (1:5,000 dilution) in PBS containing 5% calf serum and 0.1% Tween, washed three time in PBS containing 0.1% Tween for 15 min, and developed using the ECL plus kit according to the manufacturers instructions (GE Healthcare). To evaluate protein yields after purification of protein on IgG sepharose, protein was bound to IgG sepharose and either eluted by cleavage with GST-3C protease as previously described (Gelperin et al., 2005), or eluted by boiling of the IgG sepharose beads in SDS loading dye as described (Malkowski et al., 2007).
Large scale protein expression and purification of L. major 6976.
Growth of the yeast was similar to that described above except in scale, a total of 43.5 liters of cells were grown to an average OD600 of 9.3. To harvest, cultures were put on ice, cells were harvested by centrifugation, washed in 192 ml cold ddH2O, transferred in a thin layer to a Ziploc bag, quick frozen in 2 aliquots as a pellet on dry ice, and stored at −80°C.
To purify L. major 6976 protein, frozen cell pellets from 405 OD-L were broken into fine chunks with a hammer, stirred into 607 ml extraction Buffer A at room temperature until thawed, moved immediately to ice and subjected to bead beating (12 rounds 15 sec followed by 1 min rest) in a ice-H2O cooled large bead beating apparatus filled with 0.5mm Zirconia/Silica beads (Biospec Products, 11079105z), after which the liquid was separated from the beads, followed by addition of PMSF to 1mM, and centrifugation for 10 min at 10,000 rpm in a Beckmann JLA16.250 rotor to make the crude extract. Crude extracts (780 ml) were quick frozen and stored at −80°C.
Crude extracts, thawed in the presence of 2 L IPP-0 buffer (10mM Tris-Cl pH 8.0, 0.1% NP40) were mixed with an additional 2.3 liters of IPP-0 buffer, 7.6 ml of 10% NP40, 13 ml of 10 mg/ml PMSF, 10 ml of 0.5 M EDTA, and 50 ml of IgG beads (GE Healthcare 17–0969), that were themselves previously washed 3 times in 240 ml IPP-150 buffer; the mixture was gently stirred for 2 hrs at 4°C, at which time the resin was allowed to settle for at least 25 min, and then, the resin was transferred into 14 × 50 ml conical tubes, which were subjected to low speed centrifugation for 2 min at 2k at 4°C (JS 5.3 swinging bucket rotor) and the supernatant was discarded. The bound IgG resin was washed with 630 ml IPP-150 (IPP-0 buffer with 150 mM NaCl) by nutating the tubes for 4 min, followed by low speed centrifugation for 2 min at 2K at 4°C and removal of the supernatant, and this wash step was repeated 5 times, followed by 5 washes in 3C Cleavage Buffer (10mM Tris-Cl pH8.0, 150mM NaCl,,0.1% NP40, 2 mM β-mercaptoethanol), followed by addition of a volume of 3C cleavage buffer equal to the bead volume and addition of 7.8 mg GST-3C protease, gentle mixing overnight at 4°C. The next day, the eluted protein was separated from the beads by low speed centrifugation (2K for 1 min at 4°C) and removal of the supernatant, followed by 2 washes in which an equal volume of 3C Cleavage buffer was added to the resin, followed by mixing for 20 min and low speed centrifugation. The GST-3C protease was removed from the eluted protein samples by incubation of the elution and wash supernatants with 0.6 ml equilibrated GSH resin (GE Healthcare, 27–4574) for 1 hour at 4°C, and then filtration of the mixture through a Nalgene 0.45 PES filter unit to remove the GSH beads.
Prior to sizing the protein preparation, the concentration of NaCl in the combined elution and both washes was adjusted to 0.2 M NaCl by addition of an appropriate volume of 5 M NaCl, then the protein preparation was concentrated from 165 ml to 5 ml with 4 × 15 ml Amicon Ultra15 filter (Millipore UFC901024), spun at 4,000 rpm at 4°C and loaded onto a 120 ml bed volume Superdex 200 HiLoad 1660 sizing column (GE Healthcare 17–1069, 10 × 300 mm bed dimension), and eluted overnight. Protein was visualized by SDS-PAGE and quantified with Bradford assays. Pooled fractions were concentrated to ~ 5 ml, centrifuged at 4°C for 10 min at maximum speed.
Results
Expression of many L. major ORFs in E coli yields insoluble protein.
To obtain proteins from pathogenic protozoa at the high levels necessary for x-ray crystallography, we cloned, expressed and analyzed over 4,000 ORFs from Leishmania major, Trypansomoa brucei, Trypanosoma cruzi, Plasmodium falciparum, and closely related organisms for both expression and solubility in E. coli (Fan et al., 2008). The ORFs were PCR amplified and cloned using Ligation Independent Cloning (LIC) methods such that expression of the ORF was regulated by the T7 promoter and the ORF was expressed as a fusion with either an N terminal His6 tag or a His6 tag followed by a soluble 3C cleavage site (Alexandrov et al., 2004). Expression of the ORF fusion protein was induced at 18°C by the addition of IPTG to induce expression of T7 RNA polymerase in the BL21DE3 host strain, and continued for ~18 hours. Expression of ORF-fusion proteins was evaluated by examining the protein composition of SDS whole cell lysates with SDS-PAGE while the amount of soluble protein expression was determined from preparations of a crude extract in which insoluble material was removed by centrifugation.
As shown in Figure 1A, many strains express high levels of fusion protein that are readily detected in the whole cell extract, but as shown in Figure 1B, only a fraction of these proteins are nearly as abundant in a soluble crude extract. As shown in Figure 1, a fusion protein is expressed in 14 of the 16 strains as judged by the presence of dark bands in the SDS lysate (top gel), but the fusion protein is soluble in only a fraction of these strains. The fusion protein is observed in the crude extract at substantial levels in only 4 examples (marked with star in both gels), while in 5 cases no soluble protein is detectable (marked with the circle), and in 5 other cases only a small percentage of the expressed protein is found in the soluble crude extract (marked with the diamond). In an analysis of 4,254 cloned target genes from Trypanosoma cruzi, Trypanosoma brucei and Leishmania major, we found that 2,406 (56%) are expressed at high levels, easily visible by Coomassie staining of a whole cell SDS lysate, but only 655 (27%) of the expressing strains produce substantial levels of soluble protein (comparable to those marked with a star in Figure 1B).
Figure 1: Expression and solubility of a set of L. major ORFs in E. coli:
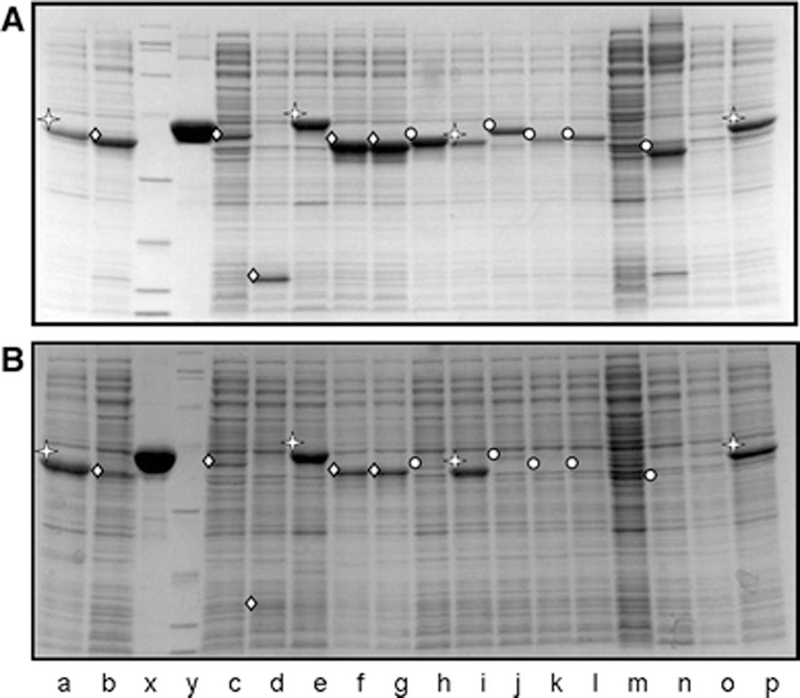
A. Analysis of expressed protein in E. coli. To examine expression of L. major proteins fused to a cleavable N terminal affinity tag in E. coli, SDS lysates of cells were subjected to electrophoresis and Coomassie staining. Recombinant proteins were observed in SDS lysates in all lanes except m and o; position of recombinant protein is marked in each lane with either  ,
,  or
or  . B. Analysis of soluble expressed protein in E. coli. Soluble crude extracts derived from the same cells examined in Panel A were subjected to electrophoresis and Coomassie staining. The strains examined in lanes a, e, i and p were judged to produce substantial amounts of soluble proteins (marked with a ), those in lanes b, c, d, f, and g were judged to produce some soluble protein based on the presence of a band at the expected molecular weight (marked with a ) and the strains in lanes h, j, k l and n were judged to produce little or no soluble protein (marked with a ).
Most of the L. major ORFs are expressed and soluble in S. cerevisiae.
To learn if expression in Saccharomyces cerevisiae improves the solubility of L. major ORFs, we cloned and expressed 83 ORFs that had exhibited different expression and solubility characteristics in E. coli (Supplementary Table 1). We focused particularly on a set of 64 ORFs that were expressed well in E. coli but were poorly or not at all soluble in E. coli (generally significantly less than 25% soluble); this group is labeled as the Test Set in all figures and tables (Table 1). We chose ORFs from the large set of 2,406 high expressors in E. coli, based on intensity of the Coomassie stained bands in the SDS lysate (see Fig 1A, see lanes b, e, f, g, h, and n), but with low solubility, based on the intensity of the Coomassie stained bands in the soluble crude extract (see Fig 1B, see lanes b, f, g, h and n). We clustered this entire group into one TEST set without further subdivision, because, for 50 of the 64 Test ORFs, the band corresponding to the expressed gene in the soluble crude extract is either very light or nearly indistinguishable from background (similar to Fig 1B, lanes h and n), which impedes more precise definition of solubility.
Table 1:
Classification of L. majors ORFs by Expression and Solubility in E. Coli
| Set | Number of genes | Expression in E. coli | Solubility in E. coli |
|---|---|---|---|
| Test | 64 | Good | Poor |
| Positive Control | 8 | Good | Good |
| Negative Control | 11 | Poor | Poor |
In addition, we expressed and analyzed 8 L. Major ORFs that had been both well expressed and highly soluble in E. coli (Positive Control [PC]), as well as 11 L. Major ORFs that were poorly expressed in E. coli (Negative Control [NC]). The ORFs that had been both well expressed and highly soluble in E. coli were designated as a positive control because it seems likely that there is no inherent barrier to their expression or solubility, and thus we expected these ORFs to be expressed and soluble in yeast. All of these ORFs were cloned such that their expression was regulated by the yeast PGAL1 promoter and the ORF was fused at its carboxy terminus to a complex tag containing a site for 3C protease, followed by an HA epitope, His6, and the ZZ domain of protein A (Malkowski et al., 2007).
Expression of ORF fusion proteins was evaluated by SDS-PAGE analysis of cells after lysis with glass beads and solubilization in hot SDS buffer, while soluble ORF fusion proteins were evaluated by SDS-PAGE analysis of a crude extract derived from cells lysed with glass beads in standard extract buffer followed by centrifugation to remove insoluble material. After resolution by SDS-PAGE and transfer to nitrocellulose, the ORF fusion proteins were visualized by immuno-blotting with anti-HA antibody (Figures 2A). As shown in Figure 2A, the ORF fusion proteins from SDS lysates are loaded adjacent to the same volume of crude extract, both of which are made from the same cell lysate. The amount of ORF fusion protein in each sample was assessed by estimating the intensity of the signal in each lane, which was assigned a value between 0 and 6, as indicated below Figure 2A. Solubility was estimated as the ratio of total protein detected in hot SDS to the protein present in the crude extract, with proteins exhibiting >50% solubility considered to have good solubility. The fraction of proteins in each set with different solubility properties are illustrated in Figure 2, and shown in Table 2. The estimates of expression and solubility for each L. major ORF fusion protein are reported in Table 3.
Figure 2: Expression of L. major ORF-fusions in S. cerevisiae:
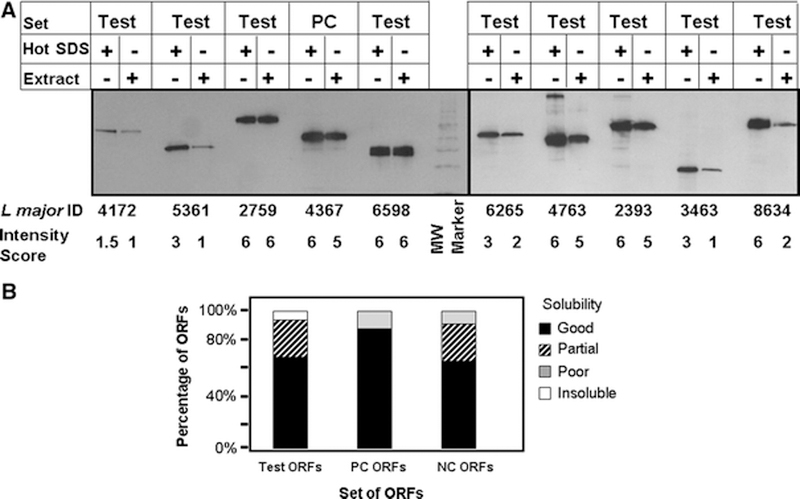
A. Analysis of expression and solubility of L. major ORF-fusions expressed in S. cerevisiae by immunoblot with anti HA antibody. Expressed protein was evaluated from lysed cells to which hot SDS loading buffer was added, while soluble protein was evaluated from the same lysed cells after centrifugation to remove insoluble material prior to addition of SDS loading buffer. In both cases, proteins were separated by SDS-PAGE, transferred to nitrocellulose membranes and probed with anti-HA antibody. Each pair of lanes represents the comparison of total and soluble protein from the same cells with the identity of the L. major ORFs as well as the score assigned based on the band intensity indicated below the figure. InVitrogen Magic Markers Mix (20, 30, 40, 50, 60 kDa) is indicated. B. Comparison of the solubility properties of L. major ORF-fusions expressed in yeast as a function of their class based on their characteristics when expressed in E. coli. The Test set were expressed but insoluble in E. coli; the PC (positive control) set were expressed and soluble in E. coli; the NC set was poorly expressed in E. coli. The fraction of ORF-fusions with good, partial, poor and no solubility in each group is indicated. Solubility was called good if the amount of protein in the soluble crude extract was greater than 50% of the protein present in the hot SDS lysate. Solubility was called partial when soluble protein was 25% to 50% of the level of the protein present in the hot SDS lysate. Solubility was called poor when the soluble protein was less than 25% of the level of the protein present in the hot SDS lysate. Proteins were called insoluble when no protein was detected in the crude extract.
Table 2:
Solubility of L major ORF groups expressed in S. cerevisiae
| Set | Number | Insoluble | 10%−25% soluble |
25% - 50% soluble |
> 50% soluble |
|---|---|---|---|---|---|
| Test | 63 | 4 | 0 | 17 | 42 |
| Positive Control | 8 | 0 | 1 | 0 | 7 |
| Negative Control | 11 | 0 | 1 | 3 | 7 |
| Total | 82 | 4 | 2 | 20 | 56 |
Table 3:
L major ORFs: Expression and Solubility of in E. coli and in S. cerevisiae
| E. coli Expression & Solubility | S. cerevisiae Expression & Solubility | ||||||
|---|---|---|---|---|---|---|---|
| Lmajor ORF ID |
AA | Expression: SDS lysates |
Soluble: CE |
Set | Expression: SDS lysate |
Soluble: CE |
Percent soluble |
| 1522 | 445 | 5.0 | 1.0 | T | 2.0 | 1.0 | 50.0% |
| 2393 | 656 | 5.0 | 1.0 | T | 6.0 | 5.0 | 83.3% |
| 2645 | 369 | 3.0 | 0.0 | T | 0.1 | 0.1 | 100.0% |
| 2694 | 337 | 3.5 | 2.0 | T | 4.0 | 4.0 | 100.0% |
| 2698 | 631 | 4.0 | 2.0 | T | 3.0 | 3.0 | 100.0% |
| 2759 | 633 | 4.0 | 2.0 | T | 6.0 | 6.0 | 100.0% |
| 2785 | 442 | 4.0 | 1.0 | T | 2.0 | 1.0 | 50.0% |
| 2827 | 451 | 3.0 | 1–2 | T | 6.0 | 3.0 | 50.0% |
| 2936 | 417 | 5.0 | 1.0 | T | 6.0 | 2.0 | 33.3% |
| 2937 | 323 | 3.0 | 0.5 | T | 5.0 | 3.0 | 60.0% |
| 2993 | 703 | 3.0 | 1.0 | T | 0.0 | 0.0 | ns |
| 3001 | 240 | 3.0 | 0.0 | T | 1.0 | 0.5 | 50.0% |
| 3157 | 705 | 2.5 | 0.5 | T | 0.5 | 0.0 | 0.0% |
| 3187 | 531 | 5.0 | 0.5 | T | 6.0 | 2.0 | 33.3% |
| 3463 | 201 | 4.0 | 0.0 | T | 3.0 | 1.0 | 33.3% |
| 3512 | 660 | 3.0 | 0.5 | T | 1.0 | 1.0 | 100.0% |
| 3538 | 656 | 3.5 | 1.0 | T | 0.5 | 0.5 | 100.0% |
| 3575 | 293 | 2–3 | 0–1 | T | 4.0 | 1.5 | 37.5% |
| 3577 | 299 | 3.0 | 0–1 | T | 3.0 | 3.0 | 100.0% |
| 3849 | 616 | 4.0 | 1.0 | T | 4.0 | 2.5 | 62.5% |
| 3864 | 741 | 3.0 | 0.5 | T | 5.0 | 0.0 | 0.0% |
| 3954 | 373 | 3.0 | 1–2 | T | 4.0 | 4.0 | 100.0% |
| 4089 | 382 | 4.0 | <2 | T | 6.0 | 5.0 | 83.3% |
| 4109 | 268 | 3–4 | 1.0 | T | 3.0 | 1.0 | 33.3% |
| 4172 | 476 | 3.0 | 0–1 | T | 1.5 | 1.0 | 66.7% |
| 4234 | 621 | 4.0 | 1–2 | T | 0.1 | 0.2 | 100.0% |
| 4235 | 498 | 4.0 | 1.0 | T | 3.0 | 3.0 | 100.0% |
| 4275 | 441 | 3.0 | 1.0 | T | 1.5 | 1.0 | 66.7% |
| 4305 | 323 | 3.5 | 1.5 | T | 0.2 | 0.2 | 100.0% |
| 4390 | 687 | 5.0 | 0–1 | T | 5.0 | 2.0 | 40.0% |
| 4396 | 186 | 2.0 | 1.0 | T | 4.0 | 3.0 | 75.0% |
| 4486 | 311 | 4.5 | 0.5 | T | 5.0 | 5.0 | 100.0% |
| 4487 | 405 | 5.0 | 2.0 | T | 6.0 | 6.0 | 100.0% |
| 4609 | 474 | 3.0 | 1.0 | T | 0.2 | 0.2 | 100.0% |
| 4634 | 557 | 5.0 | 1.0 | T | 0.5 | 0.2 | 40.0% |
| 4680 | 483 | 4.0 | 0–1 | T | 5.0 | 2.0 | 40.0% |
| 4763 | 406 | 4.0 | 0–1 | T | 6.0 | 5.0 | 83.3% |
| 4892 | 204 | 5.0 | 0.5 | T | 3.0 | 3.0 | 100.0% |
| 5361 | 338 | 3.0 | 0–1 | T | 3.0 | 1.0 | 33.3% |
| 5455 | 296 | 3.0 | 0.5 | T | 5.0 | 5.0 | 100.0% |
| 5499 | 335 | 3.0 | 1.0 | T | 6.0 | 6.0 | 100.0% |
| 5898 | 242 | 3.0 | 1.0 | T | 3.0 | 1.0 | 33.3% |
| 6106 | 420 | 2.0 | 0.5 | T | 0.1 | 0.0 | 0.0% |
| 6122 | 389 | 4.0 | 0.0 | T | 4.0 | 0.0 | 0.0% |
| 6168 | 297 | 3.0 | 1.0 | T | 6.0 | 6.0 | 100.0% |
| 6222 | 455 | 2.5 | 0.5 | T | 1.0 | 0.5 | 50.0% |
| 6265 | 453 | 3.0 | 0–1 | T | 3.0 | 2.0 | 66.7% |
| 6312 | 361 | 4.0 | 2.0 | T | 3.0 | 2.0 | 66.7% |
| 6348 | 377 | 4.0 | 1.0 | T | 4.0 | 3.0 | 75.0% |
| 6421 | 301 | 4.0 | 0–1 | T | 4.0 | 3.0 | 75.0% |
| 6586 | 411 | 3.0 | 1–2 | T | 6.0 | 6.0 | 100.0% |
| 6593 | 353 | 3.0 | 0.5 | T | 4.0 | 4.0 | 100.0% |
| 6598 | 266 | 5.0 | 0–1 | T | 6.0 | 6.0 | 100.0% |
| 6640 | 365 | 5.0 | 2.0 | T | 3.0 | 3.0 | 100.0% |
| 6679 | 400 | 3.0 | 1.0 | T | 6.0 | 4.0 | 66.7% |
| 6864 | 397 | 3.0 | 1.0 | T | 6.0 | 6.0 | 100.0% |
| 6976 | 335 | 5.0 | 2.0 | T | 4.0 | 4.0 | 100.0% |
| 6989 | 366 | 4.0 | 0–1 | T | 4.0 | 3.0 | 75.0% |
| 7177 | 533 | 4.0 | 1.0 | T | 1.0 | 1.0 | 100.0% |
| 7200 | 688 | 4.0 | 0.5 | T | 1.0 | 0.5 | 50.0% |
| 7489 | 409 | 3.0 | 1.0 | T | 6.0 | 6.0 | 100.0% |
| 7581 | 567 | 3.0 | 0–1 | T | 1.5 | 1.0 | 66.7% |
| 8264 | 513 | 4.0 | 0–1 | T | 6.0 | 5.0 | 83.3% |
| 8634 | 657 | 3.0 | 0–1 | T | 6.0 | 2.0 | 33.3% |
| 2566 | 405 | 4.0 | 4.0 | PC | 1.0 | 1.0 | 100.0% |
| 3393 | 264 | 4.0 | 4.0 | PC | 6.0 | 4.0 | 66.7% |
| 4219 | 607 | 4.0 | 5.0 | PC | 6.0 | 6.0 | 100.0% |
| 4367 | 429 | 4–5 | 4–5 | PC | 6.0 | 5.0 | 83.3% |
| 4542 | 329 | 3–4 | 5.0 | PC | 6.0 | 6.0 | 100.0% |
| 5388 | 243 | 3.0 | 4.0 | PC | 3.0 | 3.0 | 100.0% |
| 5479 | 271 | 3–4 | 4.0 | PC | 1.0 | 0.2 | 20.0% |
| 6157 | 309 | 5.0 | 5.0 | PC | 6.0 | 6.0 | 100.0% |
| 0401 | 486 | 1.0 | 1.0 | NC | 3.0 | 0.5 | 16.7% |
| 0503 | 364 | 1.0 | 1.5 | NC | 2.0 | 2.0 | 100.0% |
| 0978 | 251 | nd | 1.0 | NC | 4.0 | 4.0 | 100.0% |
| 2438 | 447 | 0.5 | 2.0 | NC | 2.0 | 2.0 | 100.0% |
| 2999 | 177 | 1.0 | 0.5 | NC | 3.0 | 3.0 | 100.0% |
| 3000 | 167 | 0.5 | 1.0 | NC | 2.0 | 2.0 | 100.0% |
| 3192 | 227 | 1.0 | nd | NC | 3.0 | 1.0 | 33.3% |
| 5821 | 277 | 0.5 | 2.0 | NC | 2.0 | 1.5 | 75.0% |
| 6443 | 582 | 0.5 | 1.0 | NC | 0.5 | 0.2 | 30.0% |
| 7247 | 247 | 0.5 | 1.0 | NC | 0.5 | 0.3 | 50.0% |
| 8109 | 244 | 0–1 | 1.0 | NC | 4.0 | 4.0 | 100.0% |
In the entire set, most ORFs are expressed and highly soluble. All but one of the 83 ORFs was expressed at detectable levels in S. cerevisiae. The solubility levels of 56 ORFs (67 % of the total set) are estimated to be greater than 50% of the total expressed level (Table 2). Moreover, only 4 ORFs are completely insoluble and only 2 other ORFs exhibit solubility of 10% to 25% of the expressed protein.
Solubility in the Test set of ORFs, which were insoluble in E. coli, is very high: 42 of 63 expressed ORFs exhibit greater than 50 % solubility (Figure 2B); in fact 40 of these ORFs were judged to yield >66% soluble protein. An additional 17 ORFs in the Test set (27%) are partially soluble, in the range of 25–50% of the total expressed protein, while 4 ORFs were expressed, but did not yield soluble protein. Thus, expression in S. cerevisiae dramatically improves solubility for 67% (42/63) to 94 % (59/63) of the ORFs that were insoluble when expressed in E. coli.
In examining the solubility of ORFs in the other sets, we find, as might be expected, that solubility is greatest among the Positive Control (PC) set of ORFs, which were highly expressed and soluble in E. coli, with 7 of the 8 ORFs (88%) in this group displaying greater than 50 % solubility (Figure 2B and Table 2). Furthermore, even in the negative control (NC) set of ORFs, which were poorly expressed in E. coli, 7 of the 11 ORFs (64%) in the Negative Control Group are highly soluble when expressed in yeast. Thus solubility among all of these ORFs is relatively high.
Expression of ORFs varies and correlates weakly with good solubility.
As can be seen in Figure 2A, expression of the ORF fusion protein is highly variable, as has been observed previously with expression in both E. coli and in yeast (Gelperin et al., 2005; Phizicky and Grayhack, 2006). The panels in Figure 2A illustrates ORFs whose expression was classified as low, with a score of 2 or less (e.g. L. major 4172), medium, with a score of 3–4 (L. major 5361, 6265, 3463) and high, with a score of 5–6 (L. major 2759, 4367, 6598, 4763, 2393, 8634). The number of ORFs in each expression category, shown in Figure 3A, is relatively even for the Test ORFs. Based on the yields of purified protein from several high expressors (described below), ORFs classified as high expressors produce 60–200 μg protein per liter of culture at OD600 of 1; since cultures are routinely grown to OD600 of ~8, this corresponds to 480 to 1600 μg per liter of culture. Among the 72 ORFs in the Test and Positive Control groups, both of which were highly expressed in E. coli, 28 ORFs (39 %) are expressed at high levels in yeast while none of the 11 ORFs that were poorly expressed in E. coli (Negative Control) are expressed at high levels in yeast (Figure 3A). Moreover, while 54% of the ORFs in the Negative Control group are expressed at low levels, only 29% of the ORFs in the Test and Positive Control groups are expressed at low levels. Thus there may be a correlation between expression in S. cerevisiae and in E. coli, although additional factors might account for the differences in expression observed in this study.
Figure 3: Solubility as a function of expression.
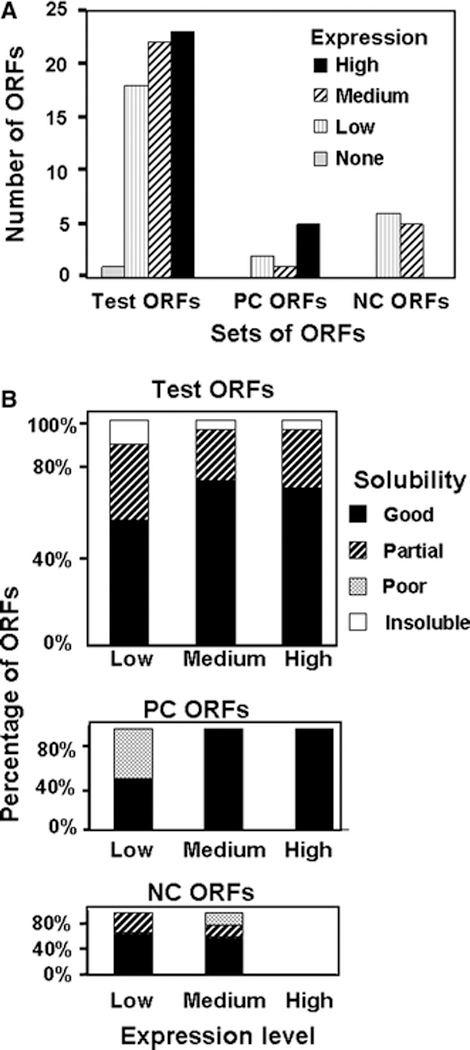
A. Expression levels of L. major ORF-fusions from Test, PC and NC groups. The number of ORF fusion proteins in each set that display high, medium, low or no expression are plotted. B. Solubility of L. major ORF-fusions from each group as a function of expression level. In each set, the fraction of ORF fusion proteins that display good, partial, poor or no solubility are examined as a function of their expression category.
We further examined the relationship between solubility and expression in each group and among the total set (Figure 3B). We find that more highly expressed proteins are slightly more likely to be soluble. In the test set, 16 ORFs in each of the high and medium expressor classes, representing 70 % and 73 % of these ORFs respectively, are highly soluble while only 10 ORFs (56%) in the low expressors’ class are highly soluble. Similarly, the only ORF from the Positive control group that is poorly soluble is also poorly expressed. While analysis of a much larger group of ORFs would be required to determine the validity of this relationship, it is intriguing to note this trend towards higher solubility in ORFs that are expressed better.
Many L. Major ORFs can be purified with reasonably high yields in single step affinity purification.
To find out if the soluble L. major proteins are likely to be folded when expressed in yeast and to quantify the predicted yields of protein, we determined if several of the soluble high expressors from the Test group could bind to IgG sepharose. Retention of ORF fusion proteins on the IgG sepharose was evaluated in a stick and strip assay, in which proteins in the crude extract are bound to the IgG sepharose beads, which are then washed to remove unbound protein, followed by boiling in SDS loading buffer and analysis by SDS PAGE. As shown in Figure 4A, we observe substantial amounts of polypeptides in 7 of the 9 experimental lanes (heavy arrows) in addition to the heavy and light IgG chains which are seen in each lane and in the no extract control (lane c). This suggests that the fusion protein is folded in a conformation that can bind the affinity resin. In addition, an ORF-fusion protein is detected in lane j partially occluded by the heavy IgG band (and substantiated below).
Figure 4: Evaluation of soluble protein expression based on affinity purification of L. major ORFs on IgG sepharose.
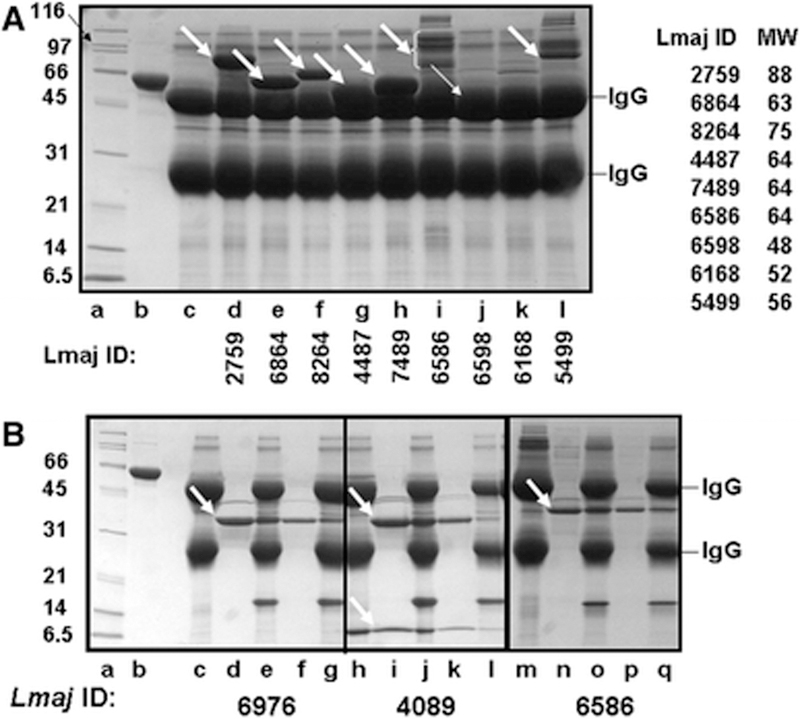
A. Analysis of soluble L. major ORFs. S. cerevisiae cells with appropriate plasmids were induced to express L. major ORF fusion proteins by galactose addition and harvested after 24 hours of further growth. Expressed protein was evaluated after extract preparation, and binding to IgG Sepharose, followed by SDS-PAGE of the IgG beads and staining with Coomassie: lane a, molecular weight markers (BioRad broad range markers-0.4 μg each); b, His6-MBP-3C protease (5 μg); c, no extract, IgG beads only; d- l, L. major ORF-fusions; d, L. major ORF-fusion 2759; e, L. major ORF-fusion 6864; f, L. major ORF-fusion 8264; g, L. major ORF-fusion 4487; h, L. major ORF-fusion 7489; i, L. major ORF-fusion 6586; j, L. major ORF-fusion 6598; k, L. major ORF-fusion 6168; l, L. major ORF-fusion 5499; . B. Purification of L. Major ORF-fusions on IgG sepharose. Proteins were bound to IgG Sepharose and washed, and bound protein was eluted after cleavage of the ZZ tag with 3C protease, lane a, molecular weight markers (BioRad broad range markers-0.4 μg each); b, His6-MBP-3C protease (5 μg); c –g, L. major ORF-fusion 6976; h-l, L. major ORF-fusion 4089; m-q, L. major ORF-fusion 6586. Lanes c, h, m, sample bound to IgG beads; lanes d, i, n, protein eluted with 3C protease; lanes e, j, o: IgG beads after proteolytic cleavage; lanes f, k, p, second wash of the IgG beads after proteolytic cleavage; lanes g, l, q, IgG beads after second wash.
For five of the nine ORF-fusion proteins, the amount of protein from this one-step purification is sufficient for structural analysis. We observe between 4 μg and 10 μg of ORF-protein fusion migrating near the expected molecular weight, (indicated by arrows in lanes: d, L. major 2759: e. L. major 6864; f. L. major 8264; g. L. major 4487; and h. L. major7489), based on the intensity of their staining compared to that of the 5μg of His6-MBP-3C protease in lane b and the ~0.4 μg of the molecular weight markers in lane a. Since each lane is loaded with protein from an equivalent number of cells (4.8 ml at OD600 of ~8.7; 42 OD ml), we have calculated the yield of L. major ORF fusion proteins per OD600 liter of yeast. Thus, these ORFs produce ~240 μg of ORF fusion protein per OD-liter or 2 mg per liter at OD600 of 8.5.
Since it is difficult to resolve some proteins from the IgG beads in this stick and strip assay and since some proteins display apparent heterogeneity, we further examined the yield of 16 proteins from the Test set in a purification that involved binding to IgG sepharose and release by cleavage with 3C protease (Figure 4B). In each of the three examples shown in Figure 4B, we observe one or two polypeptides released from the IgG resin after cleavage with 3C protease (lanes d, f, i, l, o and q) as well as an ~17 kDa polypeptide generated by 3C cleavage that is retained on the IgG resin (compare lanes c, h, and n to lanes e, g, k, m p and r). This 17 kDa polypeptide is the complex fusion tag, which is identical in all samples and retained on the IgG sepharose. Neither L. major 6976 ORF fusion protein nor L. major 4089 ORF fusion protein is detected prior to 3C cleavage (lanes c and h) on the IgG sepharose resin because both co-migrate with the larger IgG band. Similarly, we found that L. major 6598 ORF, which was not easily visible in the Stick and Strip (Fig. 4A, lane j), produces soluble, albeit heterogeneous, fusion protein with this 2 step purification (Supplementary Fig. 2). By contrast, multiple high molecular weight polypeptides are observed in the stick and strip with L. major 6586 (Fig 4A, lane i), but these bands are resolved into a single species of the correct molecular weight after cleavage with 3C protease (Figure 4B, third panel). Additional 2 step small scale purifications of 4 L. major ORF fusions not shown in Fig. 4A as well as a purification of L. major 8264 (Fig. 4A, lane e) are shown in Supplementary Figure 1 and 2, all of which yield a single major polypeptide.
Surprisingly, two polypeptides co-purify from the strain expressing L. major 4089 ORF (Fig. 4B, lanes j and l). We think it likely that the single gene product is cleaved into two polypeptides autocatalytically. This ORF is annotated as a putative S-adenosylmethionine decarboxylase proenzyme, and in yeast, the analogous gene product Spe2 is cleaved into a 10,000 and 36,000 Da products with the 10,000 Da product arising from the N terminus (Kashiwagi et al., 1990). Moreover, generation of the two subunits is observed when the yeast protein is expressed in E. coli, suggesting that cleavage is autocatalytic.
Purification of L. major ORF fusion proteins yielded between 84 μg and 240 μg of ORF-fusion protein per OD-liter, for all but one of the 16 L. major ORFs examined (see Table 4). Moreover, the single step stick and strip analysis in Figure 4A confirms these expected yields in the seven cases in which the predicted polypeptide was observed. Since S. cerevisiae is routinely grown to OD600 of 8.5 as part of our preparations, the actual yield of proteins is 700 μg to 2 mg per liter of culture. Thus, the amount of protein is within the range required for x-ray crystallography. This claim is substantiated further below.
Table 4:
Yield of L major proteins from S. cerevisiae based on purification on IgG beads
| Lmajor ORF ID | Protein Function (inferred) | Yield* |
|---|---|---|
| Lmaj006976AAA | cyclin 1 | 200 |
| Lmaj006593AAA | sterol 24-c-methyltransferase | 88 |
| Lmaj004486AAA | ‘monoglyceride lipase, | 120 |
| Lmaj004089AAA | S-adenosylmethionine decarboxylase proenzyme | 240 |
| Lmaj006586AAA | glucokinase 1-like protein | 140 |
| Lmaj004763AAA | serine peptidase | 16 |
| Lmaj002393AAA | GMP synthase | 160 |
| Lmaj002759AAA | phenylalanyl-tRNA synthetase | 100 |
| Lmaj006598AAA | caltractin | 120 |
| Lmaj006679AAA | ensangp 00000010174-like protein | 120 |
| Lmaj006864AAA | flagellar protofilament ribbon protein-like protein | 160 |
| Lmaj008264AAA | beta-fructosidase | 96 |
| Lmaj004487AAA | n-acyl-l-amino acid amidohydrolase | 96 |
| Lmaj007489AAA | anion-transporting ATPase-like protein | 140 |
| Lmaj006168AAA | small G-protein, putative | 84 |
| Lmaj005499AAA | d-isomer specific 2-hydroxyacid dehydrogenase-like protein | 108 |
Yield (μg per OD liter)
Large scale purification of two L. major ORF fusions yields highly purified protein with the expected yield.
To determine if protein preparations with sufficient purity for structural analysis could be obtained from these L. major ORF fusions, we purified two L. major proteins from 44 liters of cells through IgG sepharose binding and elution with 3C protease, followed by sizing chromatography and concentration of pooled samples. As shown in Figure 5 and in Supplementary Figure 3, we obtained nearly homogenous preparations of L. major 6976 and L. major 4089 from this procedure. The yield of highly purified native L. major 6976 protein from 405 OD-mls (44 liters) after purification on IgG sepharose followed by elution with 3C protease is estimated to be 88 mg. After sizing chromatography, 51 mg of protein (4.8 ml at 10.7 mg/ml) was obtained from 5 pooled fractions with an additional 3 fractions that contain substantial amounts of protein. We obtained similar results in the purification of L. major 4089 ORF-fusion from 384 OD- liters with a final yield of 47 mg after sizing and pooling of selected fractions (Supplementary Fig. 3) with an additional 5 fractions that contain similar amounts of protein, for an estimate of more than 90 mg total. As described above, this protein apparently undergoes autocleavage and the two subunits co-purify throughout with the major contaminant likely corresponding to the full length polypeptide.
Figure 5: Large scale purification of L. major 6976 ORF fusion protein.
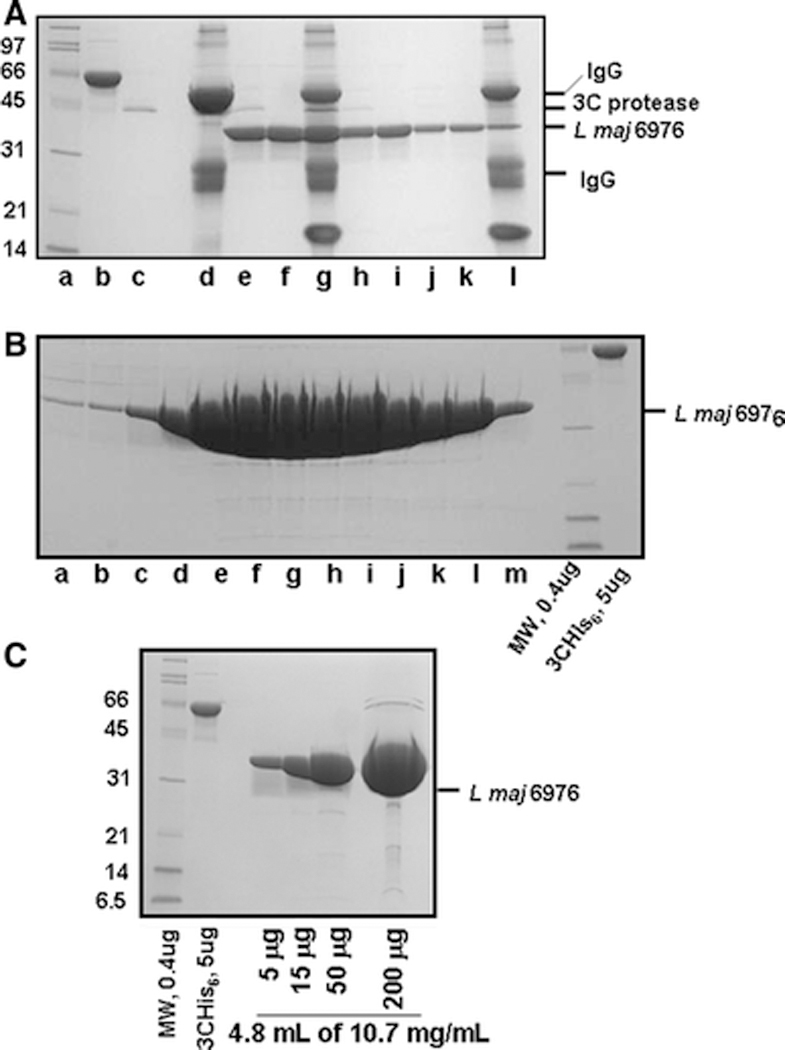
A. Purification of L. Major 6976 ORF-fusion from 405 OD-L. Proteins were bound to IgG sepharose, eluted by cleavage with 3C protease, followed by removal of 3C protease with GSH resin. lane a, molecular weight markers (BioRad broad range markers-0.4 μg each); b, His6-MBP- 3C protease (5 μg); c GST-3C protease (~0.9 ug); lane d, sample bound to IgG beads; lane e, protein eluted with 3C protease; lane f, protein after binding GST-3C protease to GSH resin and filtration to remove GSH beads; lane g, IgG beads after proteolytic cleavage; lanes h and j, second and third washes of the IgG beads after proteolytic cleavage; lanes i and k, protein from second and third washes after removal of GST-3C protease with GSH resin and filtration; lane l, IgG beads after the third wash. B. Purification of L. major 6976 by sizing chromatography. Lanes a – m contain 25 μl each of fractions 43 to 55 (2 ml per fraction). C. Purified, concentrated L. major 6976 protein. Protein from fractions 47 to 51 (lanes e- i in B) was concentrated to ~ 5 ml and centrifuged for 10 min at maximum speed in a microfuge at 4°C.
We compared the yields of protein in the large scale preparations to estimates from the small scale purification to find out if the small scale estimates of protein yield are accurate. The yield of L. major 6976 protein after purification on IgG sepharose is nearly identical to the estimated yield from the small scale purification (88 mg from 405 OD-liters corresponds to 0.22 mg per OD liter while 20 μg from 100 OD-ml corresponds to 0.2 mg per OD-liter). Likewise, L. major 4089 yields ~0.23 mg per OD-liter in the large scale purification compared to 0.24 mg per OD-liter in the small scale purification reported in Table 4.
Codon optimization improves the yield of L. major 6976 in S. cerevisiae.
Expression of a large number of heterologous genes in E. coli is improved either by altering the codons that specify an identical polypeptide or by over-expression of rare tRNAs, with one recent study demonstrating improved expression of 22 of 30 human dehydrogenase/reductase genes using either a synthetic recoded gene or the native gene in a host that over-expresses a number of rare tRNA (Burgess-Brown et al., 2008). In yeast, Keppler- Ross et al. (Keppler-Ross et al., 2008) determined that poorly expressed mCherry RFP was converted to a well expressed derivative by codon-optimization. We noted that codon usage among the L. major ORFs deviated significantly from optimal codon usage in yeast, resulting in relatively poor CAI scores among the L. major ORFs, in which CAI scores average 0.06 compared to an average of 0.172 among 5,565 yeast ORFs and of 0.26 among 319 highly expressed verified ORFs, cloned into a single expression vector (Gelperin et al., 2005). Thus, we explored the effects of codon replacement on expression of L. major 6976 to learn if additional protein can be obtained in soluble form from this ORF. As shown in Figure 6, the yield of L. major 6976 from a recoded version is 3 fold greater than wild type, enhancing the yield of this ORF to 6 mg purified protein per liter of culture.
Figure 6: Yield of L. major 6976 ORF-fusion protein from the native gene and a gene recoded with optimal S. cerevisiae codons.
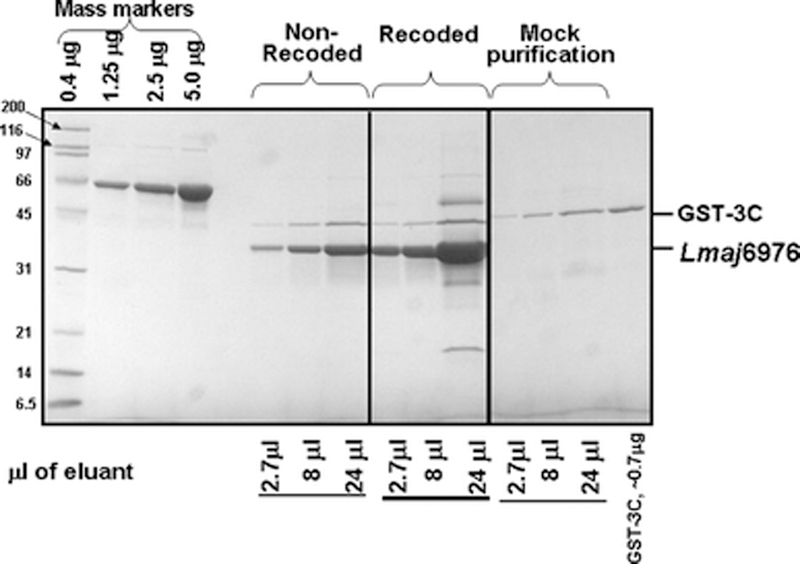
The yields of protein from 50 OD-mls of non-recoded and recoded L. major 6976 were compared after purification on IgG sepharose followed by elution with 3C protease, and SDS PAGE of different amounts of the eluate as shown. The amounts of protein in the eluant are determined by comparison to the mass markers (His6-MBP-3C).
Discussion
We have provided direct evidence that heterologous proteins that are expressed but insoluble in E. coli are likely to be expressed and soluble in the simple eukaryote S. cerevisiae, and can be purified at levels sufficient for structural analysis in a significant fraction of the cases. Expression in S. cerevisiae resolves the solubility problem for a large fraction (42 of 63, 67%) of proteins that were expressed in both E. coli and yeast but were insoluble in E. coli. Furthermore, many of these proteins (15 of 63) can be purified by affinity chromatography in sufficient yield for structural analysis. Thus, this analysis of 63 insoluble targets generates 15 new candidates that are expressed at high levels, are nearly completely soluble, and can be purified by affinity chromatography. An additional 10 candidates are fully soluble but are not expressed as robustly, based on immunoblot analysis. Thus, the yield of viable candidates for structural analysis (24%−40% of the 63 test genes) is at least as good as the results from a screen in E. coli, starting with a set of ORFs that failed solubility criteria in E. coli. Moreover, the protein preparations purified by affinity and sizing chromatography are nearly homogenous, more so than many yeast protein preparations with similar yields (Quartley, Grayhack, and Phizicky, unpublished data). We suggest that native proteins may have evolved to interact with other proteins in the organism even weakly, and thus expression in a foreign host may be advantageous for improved purity. We conclude from this data that the yeast S. cerevisiae is an effective alternative organism for preparation of proteins for structural analysis.
Although we think that expression in S. cerevisiae is the primary cause of improved solubility for these L. major ORFs, it is conceivable that the differences in either the location or identity of the fusion tag contribute to solubility of some ORFs. For expression in E. coli, L. major ORFs were fused to either an N terminal His6 tag or an N terminal His6 tag followed by a soluble 3C cleavage site (Alexandrov et al., 2004), while for expression in S. cerevisiae, ORFs were fused to a C-terminal tag consisting of a 3C cleavage site, followed by an HA epitope, His6, and the ZZ domain of protein A (Malkowski et al., 2007). Identity of the fusion tags has been shown to affect solubility of many recombinant proteins but no single tag or condition that improves solubility of most or all proteins has been identified (Chatterjee and Esposito, 2006; Esposito and Chatterjee, 2006; Peti and Page, 2007; Waugh, 2005). In particular, in one study, fusion of the Z domain of protein A at the N terminus of seven proteins resulted in significantly soluble protein for only 1 of 7 proteins tested, and in only 2 of 21conditions (Niiranen et al., 2007). In our study, we have examined solubility in a single condition with one ZZ domain construct, resulting in nearly complete solubility of 42 of the 64 test proteins. Thus, both the fraction of proteins with improved solubility and the fraction of the protein that is soluble are significantly improved relative to studies in which fusion tags were altered in E. coli.
In addition to studies on protein expression and purification, the wealth of genetic, molecular and genomic information and of molecular tools in both S. cerevisiae and Pichia Pastoris (Punt et al., 2002) contribute significantly to their growing use for protein expression. Thus, production of secreted recombinant insulin in S. cerevisiae exploited information from years of study on the Golgi, ER and secretory mechanisms (Kjeldsen, 2000), and the recent production of both rat plasma membrane Na+/H+ antiporters (Flegelova et al., 2006) and a plant uracil transporter (Froissard et al., 2006) was improved by expression in mutants deficient in a particular ubiquitin ligase, Rsp5. Similarly, the recent creation of engineered P. pastoris strains enabled production of recombinant proteins with a humanized glycan structure (Hamilton et al., 2006; Hamilton and Gerngross, 2007). In S. cerevisiae, there is an extensive tool-kit of plasmids for high level expression employing a variety of regulated and constitutive promoters, and appropriate GFP and RFP variants for study of expression (Cormack et al., 1997; Keppler-Ross et al., 2008). In addition, the rapid growth of the biopharmaceutical market of recombinant proteins and monoclonal antibodies is also driving the development of yeasts as hosts for expression. Although most of the 165 biopharmaceuticals products on the market in 2006 (Walsh, 2006) were expressed in either mammalian cell culture or in E. coli, expression in mammalian cell culture is prohibitively expensive, and yeast is increasingly viewed as an alternative host. Indeed, of these 165 products, 21 recombinant proteins were produced in S. cerevisiae including Gardasil, a recombinant vaccine against human papillomavirus (from MerckTherapeutic), and Levemir, a long-acting rh insulin analog (from Novo Nordisk) (Walsh, 2006). The analysis described here suggests that expression in yeast is a suitable alternative for a large fraction of proteins, with the promise of an even larger fraction with the benefits of recoding.
Supplementary Material
Acknowledgements
We thank M. Dumont for advice and comments. This work was supported by National Institutes of Health (NIH) Grant NIH 1 U54 GM074899 establishing the Center for High Throughput Structural Biology.
Abbreviations:
- (LIC)
Ligation Independent Cloning
- (PSI)
Protein Structure Initiative
- (PDB)
Protein Database
- (L. major)
Leishmania major
References
- Alexandrov A, Vignali M, LaCount DJ, Quartley E, de Vries C, De Rosa D, Babulski J, Mitchell SF, Schoenfeld LW, Fields S, Hol WG, Dumont ME, Phizicky EM and Grayhack EJ (2004) A facile method for high-throughput co-expression of protein pairs. Mol Cell Proteomics, 3: 934–938. [DOI] [PubMed] [Google Scholar]
- Aslanidis C and de Jong PJ (1990) Ligation-independent cloning of PCR products (LIC-PCR). Nucleic Acids Res, 18: 6069–6074. [DOI] [PMC free article] [PubMed] [Google Scholar]
- Braun P, Hu Y, Shen B, Halleck A, Koundinya M, Harlow E and LaBaer J (2002) Proteome-scale purification of human proteins from bacteria. Proc Natl Acad Sci U S A, 99: 2654–2659. [DOI] [PMC free article] [PubMed] [Google Scholar]
- Braun P and LaBaer J (2003) High throughput protein production for functional proteomics. Trends Biotechnol, 21: 383–388. [DOI] [PubMed] [Google Scholar]
- Burgess-Brown NA, Sharma S, Sobott F, Loenarz C, Oppermann U and Gileadi O (2008) Codon optimization can improve expression of human genes in Escherichia coli: A multi-gene study. Protein Expr Purif, 59: 94–102. [DOI] [PubMed] [Google Scholar]
- Burley SK, Joachimiak A, Montelione GT and Wilson IA (2008) Contributions to the NIH-NIGMS Protein Structure Initiative from the PSI Production Centers. Structure, 16, 5–11. [DOI] [PMC free article] [PubMed] [Google Scholar]
- Cabantous S, Rogers Y, Terwilliger TC and Waldo GS (2008) New molecular reporters for rapid protein folding assays. PLoS ONE, 3: e2387. [DOI] [PMC free article] [PubMed] [Google Scholar]
- Chandonia JM and Brenner SE (2006) The impact of structural genomics: expectations and outcomes. Science, 311: 347–351. [DOI] [PubMed] [Google Scholar]
- Chatterjee DK and Esposito D (2006) Enhanced soluble protein expression using two new fusion tags. Protein Expr Purif, 46: 122–129. [DOI] [PubMed] [Google Scholar]
- Christendat D, Yee A, Dharamsi A, Kluger Y, Savchenko A, Cort JR, Booth V, Mackereth CD, Saridakis V, Ekiel I, Kozlov G, Maxwell KL, Wu N, McIntosh LP, Gehring K, Kennedy MA, Davidson AR, Pai EF, Gerstein M, Edwards AM and Arrowsmith CH (2000) Structural proteomics of an archaeon. Nat Struct Biol, 7: 903–909. [DOI] [PubMed] [Google Scholar]
- Cormack BP, Bertram G, Egerton M, Gow NA, Falkow S and Brown AJ (1997) Yeast-enhanced green fluorescent protein (yEGFP)a reporter of gene expression in Candida albicans. Microbiology, 143 ( Pt 2): 303–311. [DOI] [PubMed] [Google Scholar]
- Esposito D and Chatterjee DK (2006) Enhancement of soluble protein expression through the use of fusion tags. Curr Opin Biotechnol, 17: 353–358. [DOI] [PubMed] [Google Scholar]
- Fan E, Baker D, Fields S, Gelb MH, Buckner FS, Van Voorhis WC, Phizicky E, Dumont M, Mehlin C, Grayhack E, Sullivan M, Verlinde C, Detitta G, Meldrum DR, Merritt EA, Earnest T, Soltis M, Zucker F, Myler PJ, Schoenfeld L, Kim D, Worthey L, Lacount D, Vignali M, Li J, Mondal S, Massey A, Carroll B, Gulde S, Luft J, Desoto L, Holl M, Caruthers J, Bosch J, Robien M, Arakaki T, Holmes M, Le Trong I and Hol WG (2008) Structural genomics of pathogenic protozoa: an overview. Methods Mol Biol, 426: 497–513. [DOI] [PubMed] [Google Scholar]
- Flegelova H, Haguenauer-Tsapis R and Sychrova H (2006) Heterologous expression of mammalian Na/H antiporters in Saccharomyces cerevisiae. Biochim Biophys Acta, 1760: 504–516. [DOI] [PubMed] [Google Scholar]
- Froissard M, Belgareh-Touze N, Buisson N, Desimone M, Frommer WB and Haguenauer-Tsapis R (2006) Heterologous expression of a plant uracil transporter in yeast: improvement of plasma membrane targeting in mutants of the Rsp5p ubiquitin protein ligase. Biotechnol J, 1: 308–320. [DOI] [PubMed] [Google Scholar]
- Fussenegger M and Hauser H (2007) Protein expression by engineering of yeast, plant and animal cells. Curr Opin Biotechnol, 18: 385–386. [DOI] [PubMed] [Google Scholar]
- Gelperin DM, White MA, Wilkinson ML, Kon Y, Kung LA, Wise KJ, Lopez-Hoyo N, Jiang L, Piccirillo S, Yu H, Gerstein M, Dumont ME, Phizicky EM, Snyder M and Grayhack EJ (2005) Biochemical and genetic analysis of the yeast proteome with a movable ORF collection. Genes Dev, 19: 2816–2826. [DOI] [PMC free article] [PubMed] [Google Scholar]
- Gileadi O, Burgess-Brown NA, Colebrook SM, Berridge G, Savitsky P, Smee CE, Loppnau P, Johansson C, Salah E and Pantic NH (2008) High throughput production of recombinant human proteins for crystallography. Methods Mol Biol, 426: 221–246. [DOI] [PubMed] [Google Scholar]
- Graslund S, Nordlund P, Weigelt J, Hallberg BM, Bray J, Gileadi O, Knapp S, Oppermann U, Arrowsmith C, Hui R, Ming J, dhe-Paganon S, Park HW, Savchenko A, Yee A, Edwards A, Vincentelli R, Cambillau C, Kim R, Kim SH, Rao Z, Shi Y, Terwilliger TC, Kim CY, Hung LW, Waldo GS, Peleg Y, Albeck S, Unger T, Dym O, Prilusky J, Sussman JL, Stevens RC, Lesley SA, Wilson IA, Joachimiak A, Collart F, Dementieva I, Donnelly MI, Eschenfeldt WH, Kim Y, Stols L, Wu R, Zhou M, Burley SK, Emtage JS, Sauder JM, Thompson D, Bain K, Luz J, Gheyi T, Zhang F, Atwell S, Almo SC, Bonanno JB, Fiser A, Swaminathan S, Studier FW, Chance MR, Sali A, Acton TB, Xiao R, Zhao L, Ma LC, Hunt JF, Tong L, Cunningham K, Inouye M, Anderson S, Janjua H, Shastry R, Ho CK, Wang D, Wang H, Jiang M, Montelione GT, Stuart DI, Owens RJ, Daenke S, Schutz A, Heinemann U, Yokoyama S, Bussow K and Gunsalus KC (2008) Protein production and purification. Nat Methods, 5: 135–146. [DOI] [PMC free article] [PubMed] [Google Scholar]
- Hamilton SR, Davidson RC, Sethuraman N, Nett JH, Jiang Y, Rios S, Bobrowicz P, Stadheim TA, Li H, Choi BK, Hopkins D, Wischnewski H, Roser J, Mitchell T, Strawbridge RR, Hoopes J, Wildt S and Gerngross TU (2006) Humanization of yeast to produce complex terminally sialylated glycoproteins. Science, 313: 1441–1443. [DOI] [PubMed] [Google Scholar]
- Hamilton SR and Gerngross TU (2007) Glycosylation engineering in yeast: the advent of fully humanized yeast. Curr Opin Biotechnol, 18: 387–392. [DOI] [PubMed] [Google Scholar]
- Hammarstrom M, Hellgren N, van Den Berg S, Berglund H and Hard T (2002) Rapid screening for improved solubility of small human proteins produced as fusion proteins in Escherichia coli. Protein Sci, 11: 313–321. [DOI] [PMC free article] [PubMed] [Google Scholar]
- Holz C, Prinz B, Bolotina N, Sievert V, Bussow K, Simon B, Stahl U and Lang C (2003) Establishing the yeast Saccharomyces cerevisiae as a system for expression of human proteins on a proteome-scale. J Struct Funct Genomics, 4: 97–108. [DOI] [PubMed] [Google Scholar]
- Jidenko M, Nielsen RC, Sorensen TL, Moller JV, le Maire M, Nissen P and Jaxel C (2005) Crystallization of a mammalian membrane protein overexpressed in Saccharomyces cerevisiae. Proc Natl Acad Sci U S A, 102: 11687–11691. [DOI] [PMC free article] [PubMed] [Google Scholar]
- Kashiwagi K, Taneja SK, Liu TY, Tabor CW and Tabor H (1990) Spermidine biosynthesis in Saccharomyces cerevisiae. Biosynthesis and processing of a proenzyme form of S-adenosylmethionine decarboxylase. J Biol Chem, 265: 22321–22328. [PubMed] [Google Scholar]
- Keppler-Ross S, Noffz C and Dean N (2008) A new purple fluorescent color marker for genetic studies in Saccharomyces cerevisiae and Candida albicans. Genetics, 179: 705–710. [DOI] [PMC free article] [PubMed] [Google Scholar]
- Kjeldsen T (2000) Yeast secretory expression of insulin precursors. Appl Microbiol Biotechnol, 54: 277–286. [DOI] [PubMed] [Google Scholar]
- Klock HE, Koesema EJ, Knuth MW and Lesley SA (2008) Combining the polymerase incomplete primer extension method for cloning and mutagenesis with microscreening to accelerate structural genomics efforts. Proteins, 71: 982–994. [DOI] [PubMed] [Google Scholar]
- Levitt M (2007) Growth of novel protein structural data. Proc Natl Acad Sci U S A, 104: 3183–3188. [DOI] [PMC free article] [PubMed] [Google Scholar]
- Luan CH, Qiu S, Finley JB, Carson M, Gray RJ, Huang W, Johnson D, Tsao J, Reboul J, Vaglio P, Hill DE, Vidal M, Delucas LJ and Luo M (2004) High-throughput expression of C. elegans proteins. Genome Res, 14: 2102–2110. [DOI] [PMC free article] [PubMed] [Google Scholar]
- Macbeth MR, Lingam AT and Bass BL (2004) Evidence for auto-inhibition by the N terminus of hADAR2 and activation by dsRNA binding. RNA, 10: 1563–1571. [DOI] [PMC free article] [PubMed] [Google Scholar]
- Macbeth MR, Schubert HL, Vandemark AP, Lingam AT, Hill CP and Bass BL (2005) Inositol hexakisphosphate is bound in the ADAR2 core and required for RNA editing. Science, 309: 1534–1539. [DOI] [PMC free article] [PubMed] [Google Scholar]
- Malkowski MG, Quartley E, Friedman AE, Babulski J, Kon Y, Wolfley J, Said M, Luft JR, Phizicky EM, DeTitta GT and Grayhack EJ (2007) Blocking S-adenosylmethionine synthesis in yeast allows selenomethionine incorporation and multiwavelength anomalous dispersion phasing. Proc Natl Acad Sci U S A, 104: 6678–6683. [DOI] [PMC free article] [PubMed] [Google Scholar]
- Marblestone JG, Edavettal SC, Lim Y, Lim P, Zuo X and Butt TR (2006) Comparison of SUMO fusion technology with traditional gene fusion systems: enhanced expression and solubility with SUMO. Protein Sci, 15: 182–189. [DOI] [PMC free article] [PubMed] [Google Scholar]
- Mehlin C, Boni E, Buckner FS, Engel L, Feist T, Gelb MH, Haji L, Kim D, Liu C, Mueller N, Myler PJ, Reddy JT, Sampson JN, Subramanian E, Van Voorhis WC, Worthey E, Zucker F and Hol WG (2006) Heterologous expression of proteins from Plasmodium falciparum: results from 1000 genes. Mol Biochem Parasitol, 148: 144–160. [DOI] [PubMed] [Google Scholar]
- Nair R, Liu J, Soong TT, Acton TB, Everett JK, Kouranov A, Fiser A, Godzik A, Jaroszewski L, Orengo C, Montelione GT and Rost B (2009) Structural genomics is the largest contributor of novel structural leverage. J Struct Funct Genomics, 10: 181–191. [DOI] [PMC free article] [PubMed] [Google Scholar]
- Niiranen L, Espelid S, Karlsen CR, Mustonen M, Paulsen SM, Heikinheimo P and Willassen NP (2007) Comparative expression study to increase the solubility of cold adapted Vibrio proteins in Escherichia coli. Protein Expr Purif, 52: 210–218. [DOI] [PubMed] [Google Scholar]
- Peti W and Page R (2007) Strategies to maximize heterologous protein expression in Escherichia coli with minimal cost. Protein Expr Purif, 51: 1–10. [DOI] [PubMed] [Google Scholar]
- Phizicky EM and Grayhack EJ (2006) Proteome-scale analysis of biochemical activity. Crit Rev Biochem Mol Biol, 41: 315–327. [DOI] [PubMed] [Google Scholar]
- Punt PJ, van Biezen N, Conesa A, Albers A, Mangnus J and van den Hondel C (2002) Filamentous fungi as cell factories for heterologous protein production. Trends Biotechnol, 20: 200–206. [DOI] [PubMed] [Google Scholar]
- Roodveldt C, Aharoni A and Tawfik DS (2005) Directed evolution of proteins for heterologous expression and stability. Curr Opin Struct Biol, 15: 50–56. [DOI] [PubMed] [Google Scholar]
- Roodveldt C and Tawfik DS (2005) Directed evolution of phosphotriesterase from Pseudomonas diminuta for heterologous expression in Escherichia coli results in stabilization of the metal-free state. Protein Eng Des Sel, 18: 51–58. [DOI] [PubMed] [Google Scholar]
- Service RF (2002) Structural genomics. Tapping DNA for structures produces a trickle. Science, 298: 948–950. [DOI] [PubMed] [Google Scholar]
- Sherman F, Fink G, and Hicks JB. (1986) In Methods in Yeast Genetics. Cold Spring Harbor Laboratory Press, New York, pp. 145–149. [Google Scholar]
- Tran T, Buscher P, Vandenbussche G, Wyns L, Messens J and De Greve H (2008) Heterologous expression, purification and characterisation of the extracellular domain of trypanosome invariant surface glycoprotein ISG75. J Biotechnol, 135: 247–254. [DOI] [PubMed] [Google Scholar]
- Waldo GS (2003) Genetic screens and directed evolution for protein solubility. Curr Opin Chem Biol, 7: 33–38. [DOI] [PubMed] [Google Scholar]
- Walsh G (2006) Biopharmaceutical benchmarks. Nat Biotechnol, 24: 769–776. [DOI] [PubMed] [Google Scholar]
- Waugh DS (2005) Making the most of affinity tags. Trends Biotechnol, 23: 316–320. [DOI] [PubMed] [Google Scholar]
Associated Data
This section collects any data citations, data availability statements, or supplementary materials included in this article.