

Abstract
Synesthesia provides an elegant model to investigate neural mechanisms underlying individual differences in subjective experience in humans. In grapheme–color synesthesia, written letters induce color sensations, accompanied by activation of color area V4. Competing hypotheses suggest that enhanced V4 activity during synesthesia is either induced by direct bottom-up cross-activation from grapheme processing areas within the fusiform gyrus, or indirectly via higher-order parietal areas. Synesthetes differ in the way synesthetic color is perceived: “projector” synesthetes experience color externally colocalized with a presented grapheme, whereas “associators” report an internally evoked association. Using dynamic causal modeling for fMRI, we show that V4 cross-activation during synesthesia was induced via a bottom-up pathway (within fusiform gyrus) in projector synesthetes, but via a top-down pathway (via parietal lobe) in associators. These findings show how altered coupling within the same network of active regions leads to differences in subjective experience. Our findings reconcile the two most influential cross-activation accounts of synesthesia.
Introduction
The neural mechanisms of consciousness are under extensive investigation (Dehaene et al., 2006), but what determines the subjective content of conscious experience has remained elusive. This phenomenal consciousness is often considered to be the “hard problem” of consciousness (qualia problem) (Block, 2005). Here, we present a potential mechanism that can explain individual differences in phenomenal consciousness in people with synesthesia.
In synesthesia, specific sensory stimuli lead to unusual additional experiences (Hochel and Milán, 2008). We focused on grapheme–color synesthesia, where synesthetes perceive a color induced by written letters and/or digits (e.g., black letter “J” elicits orange). These idiosyncratic synesthetic colors appear automatically and remain stable during life (Hochel and Milán, 2008). During grapheme–color synesthesia, brain activity is enhanced in both color area V4 and the superior parietal lobe (SPL) (Hubbard et al., 2005; Weiss et al., 2005; Sperling et al., 2006; van Leeuwen et al., 2010), an area involved in multimodal integration (Robertson, 2003). Both regions are necessary to establish full synesthesia (Esterman et al., 2006; Hubbard, 2007; Muggleton et al., 2007; Weiss and Fink, 2009). Aberrant cross-activation between brain areas is seen as a potential neural mechanism of synesthesia.
One suggested mechanism underlying grapheme–color synesthesia is by direct cross-activation between grapheme processing areas and the color area in ventral-occipital cortex (cross-wiring model) (Ramachandran and Hubbard, 2001; Brang et al., 2010). This hypothesis predicts that the grapheme and color areas are active closely together in time, while higher-order areas such as SPL come online later. An alternative hypothesis is the disinhibited feedback model (Grossenbacher and Lovelace, 2001). In the brain, initial sensory processing areas forward information to higher-order cortical areas, where information is integrated (Robertson, 2003). The disinhibited feedback model proposes that aberrant feedback from the multimodal region SPL is sent back to color areas lower in the hierarchy, activating V4 in a top-down manner. Current theories of perception suggest that the role of these top-down influences is to provide predictions of sensory input (Friston, 2005; Friston and Kiebel, 2009). This interpretation might be particularly relevant for multimodal integration and synesthesia, where an amodal percept may lead to (aberrant) modality-specific predictions.
Data interpretation in synesthesia research has been complicated by individual differences in the specific nature of the synesthetic experience (Dixon et al., 2004; Dixon and Smilek, 2005). One group of synesthetes (projectors) experience the color “out there,” i.e., externally colocalized with the grapheme. Another group (associators) report that graphemes evoke a strong internal association of the color (Fig. 1). These individual differences can lead to heterogeneity in synesthesia-induced Stroop interference (Dixon et al., 2004) and to gray and white matter differences between groups of synesthetes (Rouw and Scholte, 2007; Rouw and Scholte, 2010). Here, we tested the hypothesis that the different subjective experiences of projectors and associators are due to differences in directed interactions (effective connectivity) within the grapheme–color synesthesia network. Even though altered connectivity is widely proposed as the underlying cause of synesthetic experiences, altered functional or effective connectivity patterns in synesthetes have not been reported before.
Figure 1.
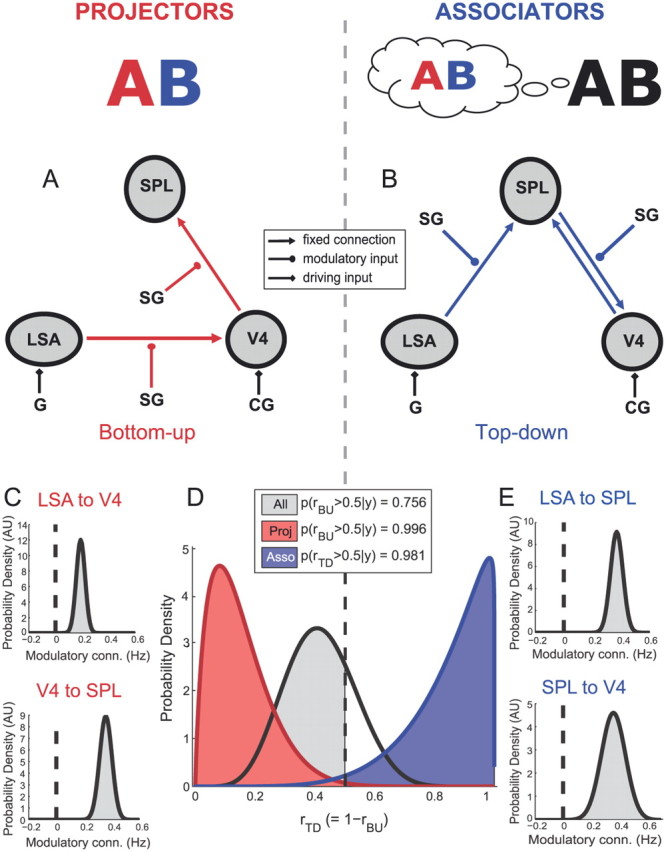
Dynamic causal modeling of grapheme–color synesthesia. Projector synesthesia (left) and associator synesthesia (right). A, B, Two DCMs to test for bottom-up (A, red) versus top-down (B, blue) modulation by SG within the LSA/V4/SPL synesthesia network. G, All grapheme stimuli. LSA and V4 are located in the fusiform gyrus. D, Bayesian model selection (Stephan et al., 2009): shaded areas represent the probability of the winning model to be better than the alternative model, given the data. rTD = 1 − rBU, where r denotes the probability of the observed data to be generated by that model given the model space. BU, Bottom-up; TD, top-down. C, E, Posterior probability density plots of the modulatory SG parameters: all parameters are larger than zero with 100.0% confidence (shaded area) across subjects, within each group (projectors N = 10, associators N = 5). See also Table 1.
Materials and Methods
To test the effective connectivity hypothesis, we used dynamic causal modeling (DCM), enabling us to infer the direction of interactions between regions (Stephan et al., 2010). The modeled synesthesia network consisted of the letter shape area (LSA), which was defined as an area in the fusiform gyrus involved in the analysis of complex and abstract shapes, e.g., graphemes (Dehaene et al., 2005); color area V4 in the fusiform gyrus; and SPL. Following predictions from the cross-wiring and disinhibited feedback accounts, we focused on two competing explanations of why presentation of noncolored graphemes would induce increased activity in V4 in synesthetes. In one model, a bottom-up pathway to V4 was modulated by synesthesia-inducing graphemes (cross-wiring theory), while in the other model a top-down pathway was modulated (disinhibited feedback theory).
We modeled functional magnetic resonance imaging (fMRI) data acquired during free viewing of synesthesia-inducing and control stimuli; this fMRI experiment has been reported and described in detail previously (van Leeuwen et al., 2010). Below, we briefly summarize the experimental design and the main outcomes and explain the DCM procedures.
fMRI experiment
Participants.
Nineteen grapheme–color synesthetes (mean age 26 ± 4.4 years, 2 men, 2 left-handed) and 19 controls matched on age, sex, education, and handedness (mean age 26 ± 4.7 years) participated. Genuine developmental grapheme–color synesthesia was established by an extensive synesthesia questionnaire that assessed synesthetic experiences, medical history, and handedness. From the general part of the questionnaire (30 questions, e.g., “How long have you experienced synesthesia?”), it was determined whether the participants fit the profile for developmental synesthesia. Additionally, color associations for 20 graphemes were retested by phone after 8–13 months. The average consistency score was 91%, which differed significantly from the score of the control participants (32.2%; t(18) = 13.2, p < 0.001) (Hochel and Milán, 2008). Nine specific questions on the location and shape of the synesthetic colors were used to characterize the synesthetes as projectors or associators: synesthetes indicated how much they agreed (on a five-point scale) with sentences that fit best with either a projector or an associator viewpoint (Rouw and Scholte, 2007). The scores were added for each class and the subjects assigned either a projector (N = 14) or an associator (N = 5) status. Six participants experienced the colors on an external “mental screen,” i.e., in peripersonal space, but not directly colocated with the graphemes. These participants were classified as “mental screen” projectors, based on their score on questions such as “It is like I see the colors in front of me on a screen.” All subjects gave written informed consent before scanning and the study was approved by the local ethics committee of the Radboud University Nijmegen, in accordance with the Declaration of Helsinki.
Stimuli, design, and data analysis.
Idiosyncratic stimuli were selected for each synesthete. Synesthesia-inducing graphemes (SG), noninducing control graphemes (NC), colored control graphemes (CG), and false font symbols (F) were included in a free-viewing, pseudorandomized block design. There were eight stimuli per condition and each stimulus was presented in black (except for the CG stimuli) for 1.5 s with an interstimulus interval of 500 ms. This amounted to blocks of 16 s of stimulation, interleaved with 10 s rest periods (fixation cross). Each block was repeated 6 times, resulting in 24 blocks in total (11 min). MR images were collected with a 3 tesla Siemens TrioTim MR scanner (EPI sequence, 29 slices, TE = 30 ms, TR = 1840 ms, flip angle = 80°, 224 mm FOV, 64 × 64 matrix, 3.5 × 3.5 mm voxel size, 3.0 mm slice thickness, 0.5 mm slice gap, eight-channel in vivo head coil).
Data were preprocessed [realignment, slice timing correction, normalization, and spatial filtering (10 mm FWHM isotropic Gaussian filter)] and analyzed with SPM5 (Wellcome Department of Imaging Neuroscience, www.fil.ion.ucl.ac.uk/spm/software/spm5) using conventional methods (GLM). For each subject, the design matrix was constructed and the BOLD signal was modeled by the canonical hemodynamic response function. The effects of interest were modeled with boxcar responses (SG, NC, CG, and F blocks) and included in the design matrix in a blocked design.
Group effects of graphemes, color, and synesthesia.
Group effects of synesthesia were obtained by computing the interaction (difference of difference) of SG > NC for synesthetes compared to controls, and the interaction of SG > CG for synesthetes compared to controls. The location of the LSA was obtained by the contrast of F > NC, collapsed over all subjects (N = 38). Additionally, group effects for real color were established by computing the contrast of CG > NC for all participants (N = 38). For synesthesia, significant interaction effects with the control participants were found in right fusiform gyrus, V4 (MNI coordinates 36, −76, −26), and in left SPL (MNI −24, −58, 46). Both areas were included in the DCM analysis. For F > NC, bilateral effects were obtained in fusiform gyrus. The peak activation in the left fusiform gyrus was used as the LSA in the DCM analysis (MNI −38, −80, −8). Bilateral effects in fusiform gyrus were also obtained for real color, medial to the effects for graphemes. For a graphical account of the results, see Figure 1 from van Leeuwen et al. (2010).
DCM
DCM is a hypothesis-driven model of neural dynamics that uses a bilinear state equation to characterize an experimentally perturbed cognitive system (Friston et al., 2003). This allows one to estimate effective connectivity between areas as well as modulations of these connections by external parameters. We used DCM to test whether modulation of bottom-up versus top-down connectivity in the synesthesia network could explain why presentation of noncolored graphemes induces increased activity in V4 in synesthetes. Although our DCM models are inspired by plausible neurophysiological principles, they do not require strong assumptions about the anatomical substrate of the network (Stephan et al., 2010).
For a given model, DCM models the hidden neural dynamics of a system of interacting brain regions. Using a bilinear state equation, neural state changes are governed by three sets of parameters: (1) direct input parameters that model how brain regions respond to external stimuli, known as the “driving inputs,” (2) fixed effective connectivity parameters that reflect the coupling between modeled regions in the absence of input, the endogenous, or fixed connections, and (3) changes of these connections induced by experimental conditions, or the modulatory inputs. This model of neural dynamics is combined with a hemodynamic model that describes the transformation of neural activity into a BOLD response. More details about DCM have been published previously (Friston et al., 2003; Penny et al., 2004a; Stephan et al., 2008, 2010).
The posterior probabilities of the parameters from the neural as well as the hemodynamic model are estimated from the measured BOLD data using a Bayesian inversion scheme, implemented in DCM8 (Friston et al., 2003). The posterior distributions of the estimated parameters can then be used to test hypotheses about connection strengths, context-dependent connectivity changes, or the effect of activity in one region on coupling strength between two other regions. Here, we used Bayesian averaging of the posterior parameter estimates (SPM8, http://www.fil.ion.ucl.ac.uk/spm/software/spm8/) to draw inferences about these posterior distributions across subjects. This Bayesian parameter averaging (BPA) effectively boils down to a weighted average of the parameter estimates of each individual, and this method is valid also for small numbers of subjects where classical statistical approaches are inappropriate. In addition, several models can be compared (e.g., including or excluding a particular connection) to test which estimated model optimally describes the measured BOLD responses, using Bayesian model selection (as described below).
DCM specification.
Based on previous GLM results (van Leeuwen et al., 2010), we constructed a bilinear DCM including the LSA, V4, and SPL (Fig. 1A,B). We compared two alternative models, following the cross-wiring and disinhibited feedback theories. Both models included direct inputs of all graphemes to LSA, and of colored graphemes to V4. In addition to this basic architecture, the first (bottom-up) model included a connection from LSA to V4, and from V4 to SPL. In this model (Fig. 1A), the LSA→V4→SPL pathway was modulated by the synesthetic experience (encoded by SG), to test the hypothesis that bottom-up modulation within the synesthesia network causes aberrant cross-activation of V4 by the LSA (cross-wiring theory) (Ramachandran and Hubbard, 2001). The second (top-down) model included a connection from LSA to SPL, and reciprocal connections between V4 and SPL (Fig. 1B). The LSA→SPL→V4 pathway was modulated by the synesthetic experience (encoded by SG), to test the hypothesis of top-down modulation within the synesthesia network as proposed by the disinhibited feedback theory (Grossenbacher and Lovelace, 2001). Note that comparing DCMs with these connections is not equivalent to testing whether these connections do or do not exist anatomically, but rather whether these connections play a functional role in the process modeled.
Following the notation in previous DCM publications (Friston et al., 2003; Stephan et al., 2008), the hidden neural dynamics of the areas x1–n in the tested models are described by the following equation:
 |
Here, x is the state vector, with each state variable representing the population activity in one region of the model (three regions: LSA, V4, and SPL). t is continuous time, and thus dx/dt is the change in activity in areas x over time t. The A matrix represents the endogenous connection strengths between the modeled regions; x and u are the experimentally controlled inputs. As can be seen in Figure 1, A and B, all graphemes (SG, NC, CG, and F) and colored graphemes (CG) enter as external inputs to the system into the LSA and V4, respectively, the weights of which are represented by the C matrix. Finally, the synesthesia-inducing graphemes (SG) enter as modulatory inputs whose influence is encoded by the B matrices (Friston et al., 2003).
DCM time series extraction.
The modeled networks included three areas (LSA, SPL, and V4). For each of these areas, BOLD time series were extracted on an individual basis for each synesthete, to account for intersubject variability in the exact locations of the activation maxima. The selection of voxels to be included in the time series was guided by both functional and anatomical criteria (Stephan et al., 2007). Voxels that exceeded a threshold of p < 0.05 uncorrected in the respective contrast of the GLM analysis (functional criterion) and were located within 16 mm of the group maximum, and within the predefined anatomical gyrus (anatomical criterion), were included. For the LSA, the contrast of F > NC was used to define voxels that were active at a suprathreshold level; for V4, the contrast of SG > NC; for SPL, the contrast of SG > CG. The LSA was defined by the contrast of F compared to NC. As such, this region is one of the lowest areas in the visual hierarchy that is strongly involved in the analysis of complex, abstract shape and symbol information (Dehaene et al., 2005), and is highly connected to higher-order grapheme areas. Given that the synesthetic experience by necessity starts with complex form analysis, we believe that the LSA provides an informative starting point for the processes involved in eliciting synesthesia.
To summarize the regional time series, the first eigenvector across all suprathreshold voxels within 5 mm of the selected maximum was computed. Using these functional and anatomical restrictions, time series were extracted for all three areas in 15 of 19 synesthetes. We could not obtain an SPL time series in three participants and a LSA series in one participant due to lack of individual activations fulfilling the above functional and anatomical criteria. These participants were excluded from the DCM analysis, leaving 10 projectors and 5 associators.
In the GLM group results, the coordinates of the LSA in left fusiform gyrus (MNI coordinates −38, −80, −8) were anatomically close to those of V4 in right fusiform gyrus (MNI 36, −76, −26). We verified that for the individually defined maxima corresponding to LSA and V4, the distance between the two maxima was large enough to avoid potential functional overlap between the regions (or their respective hemispheric homologues) when extracting the time series. Across all 15 synesthetes included in the DCM analysis, the average distance between the two maxima was 23.7 ± 8.7 mm, larger than our 10 mm FWHM smoothing kernel.
Bayesian model selection.
Bayesian model selection (BMS) provides a principled foundation for comparing competing models of different complexity (Penny et al., 2004b). We used the negative free energy approximation to the log model evidence (Friston and Stephan, 2007; Stephan et al., 2007) to compare models at the group level, using random-effects BMS (Stephan et al., 2009), to infer the posterior density of the models per se. One can then derive the exceedance probability ϕk, i.e., the probability that a particular model k is more likely than any other model considered, given the group data.
Projector-associator status as a continuum.
A subset of projector synesthetes indicate that they perceive color not precisely colocated with the grapheme, but projected onto a “mental screen” in peripersonal space. These synesthetes were classified as projectors, but some authors have suggested that these synesthetes behave more like associators (Ward et al., 2007). To investigate whether the projector–associator status should be regarded as a categorical distinction, or whether it should in fact be treated as a continuum, we correlated the PA difference scores with the difference in model evidences for the two DCMs. The PA difference score was calculated as the projector minus associator score, hence a positive score reflects a projector synesthete, and the size of the difference score indicates the relative projector/associator strength. The model evidence difference score was calculated as the bottom-up minus top-down model evidence.
Results
Overall across synesthetes, there was no strong preference for either the bottom-up or the top-down model (Fig. 1D). However, when separated according to the participants' synesthetic experience (projector vs associator), for the projectors the bottom-up model was a much more likely explanation of the data (99.6%). In contrast, for the associators, the top-down model was better (98.1%). BPA provided strong evidence that during synesthesia for projectors and associators, connection strengths were strongly upregulated in the bottom-up and top-down pathways, respectively. Figure 1, C and E, shows the posterior probability density plots of the modulatory synesthesia-inducing parameters: all modulatory parameters are larger than zero with 100.0% confidence (shaded area). For outcomes of BPA for all other parameters of the DCMs, see Table 1.
Table 1.
Probability, mean, and variance of model parameters, derived from Bayesian parameter averaging
| Probability | Mean | Variance | |
|---|---|---|---|
| Bottom-up model (projectors, N = 10) | |||
| Modulatory connectivity LSA→V4 | 1.000 | 0.190 | 0.0011 |
| Modulatory connectivity V4→SPL | 1.000 | 0.358 | 0.0020 |
| Fixed connection LSA→V4 | 1.000 | 0.194 | 0.0011 |
| Fixed connection V4→SPL | 0.997 | 0.102 | 0.0014 |
| Top-down model (associators, N = 5) | |||
| Modulatory connectivity LSA→SPL | 1.000 | 0.360 | 0.0033 |
| Modulatory connectivity SPL→V4 | 1.000 | 0.362 | 0.0075 |
| Fixed connection LSA→SPL | 1.000 | 0.427 | 0.0030 |
| Fixed connection SPL→V4 | 0.910 | 0.116 | 0.0074 |
| Fixed connection V4→SPL | 0.992 | −0.178 | 0.0055 |
We correlated the PA difference scores with the difference in model evidences for the two DCMs. We found a positive correlation (R2 = 0.65, slope = 1.49, p < 0.001), indicating that the size of the PA difference predicted the extent to which the difference in model evidence was in favor of the bottom-up model. This result suggests that the PA distinction is indeed a continuum. In Figure 2, the relationship between the PA difference score and the model evidence difference score is plotted. Besides the associator and projector synesthetes, “mental screen projectors” are indicated separately. For these synesthetes, the PA difference scores were on average closer to zero (range 0–6) than for the so-called “surface” projectors (range 5–8), who experience their colors on the grapheme itself. Accordingly, the differences in model evidences between the two models were also smaller for the mental screen projectors than for the “surface” projectors or the associators (see Fig. 2).
Figure 2.

Correlation between projector–associator difference score and BMS model evidence difference score. For each synesthete, a projector–associator (PA) difference score was calculated by subtracting the associator score on the questionnaire from the projector score. A positive score therefore indicates a projector synesthete. The score range was between −8 and 8. The PA difference score is reflected by the value of the x-axis. For each synesthete, the difference in BMS model evidences (bottom-up minus top-down model evidence) is indicated by the y-value. As the PA difference score increases, the difference in model evidences is more in favor of the bottom-up model, and this positive correlation is significant (R2 = 0.65, slope = 1.49, p < 0.001). It can be seen that for one synesthete, the PA difference score is zero; this synesthete was classified as a “mental screen” projector on the basis of a subjective description of the synesthetic experience.
Discussion
Using dynamic causal modeling for fMRI, we showed that for projector synesthetes, modulation of a bottom-up activation pathway to color area V4 is the best explanation of V4 cross-activation during synesthesia. For associator synesthetes, modulation of a top-down pathway to V4 is a better explanation. These results reconcile the direct (cross-wiring) and indirect (disinhibited feedback) cross-activation accounts of synesthesia by showing how modulation of coupling in different parts of the network results in different synesthetic experiences. Notably, the nature of the information conveyed by the modulated pathways can explain the different experiences: in (surface) projectors, the connection from LSA to V4 is likely to retain retinotopic information, resulting in the perceived colocation of color and grapheme. Thus, modulation of the bottom-up pathway explains why projector synesthesia closely resembles external sensory experience. For associators, V4 is driven via SPL, where spatial information is represented in much less detail; this could explain why color is not spatially colocated with the grapheme. This experience is reminiscent of visual imagery, in which top-down inputs drive visual areas, leading to a representation “in the mind's eye” (Reddy et al., 2010).
Our findings not only reconcile two opposing theories of synesthesia, but also show that altered connectivity patterns in the brain are accompanied by differences in phenomenal consciousness. We propose that this principle holds beyond synesthesia per se: the nature of conscious experience may be determined by how brain areas are functionally coupled. It has been demonstrated that synesthetic experiences adhere to principles of normal perception (Ward et al., 2006; Cohen Kadosh et al., 2007). Factors that determine the phenomenology of synesthesia may therefore also hold for perception in general. During mental imagery, for example, the imagined scenes or objects do not induce the same vivid percepts as actually viewing them “out there”; they appear “in the mind's eye.” This dichotomy in perception is closely reminiscent of the different subjective experiences of projectors and associators. Similar brain regions become active during mental imagery as during normal viewing or hearing (Stokes et al., 2009; Reddy et al., 2010); crucially, however, the pathways by which these brain regions are activated differ. During actual perception, primary sensory areas are leading in forwarding information to higher areas, whereas during imagery, memory-based top-down signals are leading in inducing activity in sensory areas (Mechelli et al., 2004). In this study, we showed that even with identical input to the brain, the nature of subjective experiences is greatly affected by whether functional coupling is boosted in a bottom-up or top-down manner: either the percept is really “out there” (bottom-up) or it is located “in the mind's eye” (top-down).
Furthermore, our findings demonstrate that the projector/associator distinction should be regarded as a continuum of synesthetic experiences (Hubbard and Ramachandran, 2005; Rouw and Scholte, 2007) rather than a categorical distinction between two groups of synesthetes (Ward et al., 2007). The difference between projector and associator scores on the questionnaire correlated strongly with the difference in model evidence between the bottom-up and top-down model. We showed that for mental screen projectors, who perceive their colors “out there,” i.e., as a truly sensory experience, yet on a mental screen rather than colocated with the grapheme, the difference between model evidences was less pronounced than for surface projectors or associators. Nevertheless, in terms of model evidence, this group still favored the bottom-up model, justifying our inclusion with the projector synesthetes. We believe that the balance in the top-down versus bottom-up changes in connectivity during the synesthesia experience determines the extent to which the synesthetic experience is “perceptual” in nature.
Reaction time studies suggest that projector synesthesia occurs earlier than associator synesthesia (Dixon et al., 2004; Ward et al., 2007). These findings correspond well with the direct, bottom-up versus indirect, top-down pathways to V4 for projectors and associators, respectively. For associators, activity in V4 is induced indirectly via SPL. This indirect processing pathway may explain why associators are relatively slow in naming synesthetic compared to real colors. In contrast, projectors are faster at naming synesthetic colors than real colors. In projectors, V4 is activated relatively quickly through the LSA, and the time course of this process is more similar to the time course of processing “real” colors. The faster naming times for synesthetic color could perhaps be due to the saliency of the synesthetic colors or the spatial location that they take on, often in an “overlay” over any real colors that are present. The latter hypothesis could possibly be tested by contrasting reaction times for surface and mental screen projectors. Unfortunately, the temporal resolution of fMRI does not allow for a direct test of sequential activation of brain areas other than by means of more advanced analyses such as DCM. With magnetoencephalography (MEG), it is possible to measure brain activity at much higher temporal resolution. Using MEG, Brang et al. (2010) have demonstrated that V4 is activated within 5 ms after the grapheme area in projector synesthetes. This supports our finding of a fast, bottom-up activation of V4 by the grapheme area for projector synesthetes; we are currently running an MEG study in which associator synesthetes are also included.
Models of synesthesia do not only vary with regard to the question of a direct or indirect pathway of cross-activation. Another important debate is whether the cross-activation is caused by structural (anatomical) connections between brain areas, not present in nonsynesthetes, or whether synesthesia makes use of functional connections that are present in all of us (Bargary and Mitchell, 2008). Although our DCM models are inspired by plausible neurophysiological principles, they do not require strong assumptions about the substrate of the connections, i.e., whether these are anatomical or functional (Stephan et al., 2010). Therefore, this study cannot solve the debate over whether changes in synesthesia are purely functional, i.e., the anatomical network is the same, or whether there are structural differences in the network compared to nonsynesthetes (Bargary and Mitchell, 2008).
This study is the first to investigate changes in effective connectivity in synesthesia, showing that alternative pathways of V4 activation lead to individual differences between synesthetes. Interestingly, it was recently reported that projector synesthetes exhibit increased gray matter compared to associators in brain regions related to sensory experiences (visual cortex and auditory cortex), while associators show increased gray matter in memory- and multisensory-related regions (hippocampus and angular gyrus) (Rouw and Scholte, 2010). Increased gray matter density in sensory areas for projector synesthetes fits well with our finding that a bottom-up pathway is boosted during projector synesthesia. Likewise, for associators, memory-related areas could be involved in the top-down boosting of the SPL by synesthesia. The current findings describe detailed functional interactions between the different brain areas involved in synesthesia, providing a functional role for the reported structural changes. We emphasize that the same network of brain regions is important for inducing synesthesia in both projectors and associators, but that the directive interactions between these regions leads to the crucial difference in subjective experience. To elucidate the neural mechanisms of synesthesia is it not only important to indicate which regions are active during the synesthetic experience, but it is essential to show how these regions interact.
To summarize, in this first study of effective connectivity in synesthesia, we established that while the same network of regions is active in different types of synesthesia, individual differences in subjective color experience are determined by altered coupling. More generally, our findings demonstrate that changes in coupling between brain areas can underlie differential perceptual experiences (qualia) and emphasize the importance of studying functional integration of brain areas.
Footnotes
This study was supported by a research grant from the Volkswagen Foundation (Grant I/80 743). We thank Klaas E. Stephan, Floris P. de Lange, and Benedikt Poser for comments on the manuscript.
References
- Bargary G, Mitchell KJ. Synaesthesia and cortical connectivity. Trends Neurosci. 2008;31:335–342. doi: 10.1016/j.tins.2008.03.007. [DOI] [PubMed] [Google Scholar]
- Block N. Two neural correlates of consciousness. Trends Cogn Sci. 2005;9:46–52. doi: 10.1016/j.tics.2004.12.006. [DOI] [PubMed] [Google Scholar]
- Brang D, Hubbard EM, Coulson S, Huang M, Ramachandran VS. Magnetoencephalography reveals early activation of V4 in grapheme-color synesthesia. Neuroimage. 2010;53:268–274. doi: 10.1016/j.neuroimage.2010.06.008. [DOI] [PubMed] [Google Scholar]
- Cohen Kadosh R, Henik A, Walsh V. Small is bright and big is dark in synaesthesia. Curr Biol. 2007;17:R834–R835. doi: 10.1016/j.cub.2007.07.048. [DOI] [PubMed] [Google Scholar]
- Dehaene S, Cohen L, Sigman M, Vinckier F. The neural code for written words: a proposal. Trends Cogn Sci. 2005;9:335–341. doi: 10.1016/j.tics.2005.05.004. [DOI] [PubMed] [Google Scholar]
- Dehaene S, Changeux JP, Naccache L, Sackur J, Sergent C. Conscious, preconscious, and subliminal processing: a testable taxonomy. Trends Cogn Sci. 2006;10:204–211. doi: 10.1016/j.tics.2006.03.007. [DOI] [PubMed] [Google Scholar]
- Dixon MJ, Smilek D. The importance of individual differences in grapheme-color synesthesia. Neuron. 2005;45:821–823. doi: 10.1016/j.neuron.2005.03.007. [DOI] [PubMed] [Google Scholar]
- Dixon MJ, Smilek D, Merikle PM. Not all synaesthetes are created equal: projector versus associator synaesthetes. Cogn Affect Behav Neurosci. 2004;4:335–343. doi: 10.3758/cabn.4.3.335. [DOI] [PubMed] [Google Scholar]
- Esterman M, Verstynen T, Ivry RB, Robertson LC. Coming unbound: disrupting automatic integration of synesthetic color and graphemes by transcranial magnetic stimulation of the right parietal lobe. J Cogn Neurosci. 2006;18:1570–1576. doi: 10.1162/jocn.2006.18.9.1570. [DOI] [PubMed] [Google Scholar]
- Friston K. A theory of cortical responses. Philos Trans R Soc Lond B Biol Sci. 2005;360:815–836. doi: 10.1098/rstb.2005.1622. [DOI] [PMC free article] [PubMed] [Google Scholar]
- Friston K, Kiebel S. Predictive coding under the free-energy principle. Philos Trans R Soc Lond B Biol Sci. 2009;364:1211–1221. doi: 10.1098/rstb.2008.0300. [DOI] [PMC free article] [PubMed] [Google Scholar]
- Friston KJ, Stephan KE. Free-energy and the brain. Synthese. 2007;159:417–458. doi: 10.1007/s11229-007-9237-y. [DOI] [PMC free article] [PubMed] [Google Scholar]
- Friston KJ, Harrison L, Penny W. Dynamic causal modelling. Neuroimage. 2003;19:1273–1302. doi: 10.1016/s1053-8119(03)00202-7. [DOI] [PubMed] [Google Scholar]
- Grossenbacher PG, Lovelace CT. Mechanisms of synesthesia: cognitive and physiological constraints. Trends Cogn Sci. 2001;5:36–41. doi: 10.1016/s1364-6613(00)01571-0. [DOI] [PubMed] [Google Scholar]
- Hochel M, Milán EG. Synaesthesia: the existing state of affairs. Cogn Neuropsychol. 2008;25:93–117. doi: 10.1080/02643290701822815. [DOI] [PubMed] [Google Scholar]
- Hubbard EM. Neurophysiology of synesthesia. Curr Psychiatry Rep. 2007;9:193–199. doi: 10.1007/s11920-007-0018-6. [DOI] [PubMed] [Google Scholar]
- Hubbard EM, Ramachandran VS. Neurocognitive mechanisms of synesthesia. Neuron. 2005;48:509–520. doi: 10.1016/j.neuron.2005.10.012. [DOI] [PubMed] [Google Scholar]
- Hubbard EM, Arman AC, Ramachandran VS, Boynton GM. Individual differences among grapheme-color synesthetes: brain-behavior correlations. Neuron. 2005;45:975–985. doi: 10.1016/j.neuron.2005.02.008. [DOI] [PubMed] [Google Scholar]
- Mechelli A, Price CJ, Friston KJ, Ishai A. Where bottom-up meets top-down: neuronal interactions during perception and imagery. Cereb Cortex. 2004;14:1256–1265. doi: 10.1093/cercor/bhh087. [DOI] [PubMed] [Google Scholar]
- Muggleton N, Tsakanikos E, Walsh V, Ward J. Disruption of synaesthesia following TMS of the right posterior parietal cortex. Neuropsychologia. 2007;45:1582–1585. doi: 10.1016/j.neuropsychologia.2006.11.021. [DOI] [PubMed] [Google Scholar]
- Penny WD, Stephan KE, Mechelli A, Friston KJ. Modelling functional integration: a comparison of structural equation and dynamic causal models. Neuroimage. 2004a;23:S264–S274. doi: 10.1016/j.neuroimage.2004.07.041. [DOI] [PubMed] [Google Scholar]
- Penny WD, Stephan KE, Mechelli A, Friston KJ. Comparing dynamic causal models. Neuroimage. 2004b;22:1157–1172. doi: 10.1016/j.neuroimage.2004.03.026. [DOI] [PubMed] [Google Scholar]
- Ramachandran VS, Hubbard EM. Psychophysical investigations into the neural basis of synaesthesia. Proc Biol Sci. 2001;268:979–983. doi: 10.1098/rspb.2001.1576. [DOI] [PMC free article] [PubMed] [Google Scholar]
- Reddy L, Tsuchiya N, Serre T. Reading the mind's eye: decoding category information during mental imagery. Neuroimage. 2010;50:818–825. doi: 10.1016/j.neuroimage.2009.11.084. [DOI] [PMC free article] [PubMed] [Google Scholar]
- Robertson LC. Binding, spatial attention and perceptual awareness. Nat Rev Neurosci. 2003;4:93–102. doi: 10.1038/nrn1030. [DOI] [PMC free article] [PubMed] [Google Scholar]
- Rouw R, Scholte HS. Increased structural connectivity in grapheme-color synesthesia. Nat Neurosci. 2007;10:792–797. doi: 10.1038/nn1906. [DOI] [PubMed] [Google Scholar]
- Rouw R, Scholte HS. Neural basis of individual differences in synesthetic experiences. J Neurosci. 2010;30:6205–6213. doi: 10.1523/JNEUROSCI.3444-09.2010. [DOI] [PMC free article] [PubMed] [Google Scholar]
- Sperling JM, Prvulovic D, Linden DEJ, Singer W, Stirn A. Neuronal correlates of colour-graphemic synaesthesia: a fMRI study. Cortex. 2006;42:295–303. doi: 10.1016/s0010-9452(08)70355-1. [DOI] [PubMed] [Google Scholar]
- Stephan KE, Marshall JC, Penny WD, Friston KJ, Fink GR. Interhemispheric integration of visual processing during task-driven lateralization. J Neurosci. 2007;27:3512–3522. doi: 10.1523/JNEUROSCI.4766-06.2007. [DOI] [PMC free article] [PubMed] [Google Scholar]
- Stephan KE, Kasper L, Harrison LM, Daunizeau J, den Ouden HEM, Breakspear M, Friston KJ. Nonlinear dynamic causal models for fMRI. Neuroimage. 2008;42:649–662. doi: 10.1016/j.neuroimage.2008.04.262. [DOI] [PMC free article] [PubMed] [Google Scholar]
- Stephan KE, Penny WD, Daunizeau J, Moran RJ, Friston KJ. Bayesian model selection for group studies. Neuroimage. 2009;46:1004–1017. doi: 10.1016/j.neuroimage.2009.03.025. [DOI] [PMC free article] [PubMed] [Google Scholar]
- Stephan KE, Penny WD, Moran RJ, den Ouden HEM, Daunizeau J, Friston KJ. Ten simple rules for dynamic causal modeling. Neuroimage. 2010;49:3099–3109. doi: 10.1016/j.neuroimage.2009.11.015. [DOI] [PMC free article] [PubMed] [Google Scholar]
- Stokes M, Thompson R, Cusack R, Duncan J. Top-down activation of shape-specific population codes in visual cortex during mental imagery. J Neurosci. 2009;29:1565–1572. doi: 10.1523/JNEUROSCI.4657-08.2009. [DOI] [PMC free article] [PubMed] [Google Scholar]
- van Leeuwen TM, Petersson KM, Hagoort P. Synaesthetic colour in the brain: beyond colour areas. A functional magnetic resonance imaging study of synaesthetes and matched controls. PLoS ONE. 2010;5:e12074. doi: 10.1371/journal.pone.0012074. [DOI] [PMC free article] [PubMed] [Google Scholar]
- Ward J, Huckstep B, Tsakanikos E. Sound-colour synaesthesia: to what extent does it use cross-modal mechanisms common to us all? Cortex. 2006;42:264–280. doi: 10.1016/s0010-9452(08)70352-6. [DOI] [PubMed] [Google Scholar]
- Ward J, Li R, Salih S, Sagiv N. Varieties of grapheme-colour synaesthesia: a new theory of phenomenological and behavioural differences. Conscious Cogn. 2007;16:913–931. doi: 10.1016/j.concog.2006.09.012. [DOI] [PubMed] [Google Scholar]
- Weiss PH, Fink GR. Grapheme-colour synaesthetes show increased grey matter volumes of parietal and fusiform cortex. Brain. 2009;132:65–70. doi: 10.1093/brain/awn304. [DOI] [PubMed] [Google Scholar]
- Weiss PH, Zilles K, Fink GR. When visual perception causes feeling: enhanced cross-modal processing in grapheme-color synesthesia. Neuroimage. 2005;28:859–868. doi: 10.1016/j.neuroimage.2005.06.052. [DOI] [PubMed] [Google Scholar]