

Abstract
How information is manipulated and segregated within local circuits in the frontal cortex remains mysterious, in part because of inadequate knowledge regarding the connectivity of diverse pyramidal cell subtypes. The frontal cortex participates in the formation and retrieval of declarative memories through projections to the perirhinal cortex, and in procedural learning through projections to the striatum/pontine nuclei. In rat frontal cortex, we identified two pyramidal cell subtypes selectively projecting to distinct subregions of perirhinal cortex (PRC). PRC-projecting cells in upper layer 2/3 (L2/3) of the frontal cortex projected to perirhinal area 35, while neurons in L5 innervated perirhinal area 36. L2/3 PRC-projecting cells partially overlapped with those projecting to the basolateral amygdala. L5 PRC-projecting cells partially overlapped with crossed corticostriatal cells, but were distinct from neighboring corticothalamic (CTh)/corticopontine cells. L5 PRC-projecting and CTh cells were different in their electrophysiological properties and dendritic/axonal morphologies. Within the frontal cortex, L2/3 PRC-projecting cells innervated L5 PRC-projecting and CTh cells with similar probabilities, but received feedback excitation only from PRC-projecting cells. These data suggest that specific neuron subtypes in different cortical layers are reciprocally excited via interlaminar loops. Thus, two interacting output channels send information from the frontal cortex to different hierarchical stages of the parahippocampal network, areas 35 and 36, with additional collaterals selectively targeting the amygdala or basal ganglia, respectively. Combined with the hierarchical connectivity of PRC-projecting and CTh cells, these observations demonstrate an exquisite diversification of frontal projection neurons selectively connected according to their participation in distinct memory subsystems.
Introduction
The frontal cortex is actively involved in the formation and combinatory usage of declarative, emotional, and procedural memories, through its diverse connections with the hippocampus, amygdala, basal ganglia, and cerebellum (Smith and Jonides, 1999; Miller and Cohen, 2001). How the frontal cortex manipulates various types of memories in parallel and generates behaviorally appropriate outputs to various targets simultaneously remains a mystery, in part because of inadequate knowledge regarding the differentiation of the cortical neuron subtypes involved, and their local and distant connection selectivity.
Pyramidal projection cells in the rat frontal cortex target various cortical and subcortical structures (Gabbott et al., 2005), including those associated with specific types of memory. Among the subcortical targets, neurons in the pontine nuclei that relay information to the cerebellum are involved in supervised learning of procedural memory (Ito, 2011), whereas neurons in the striatum of the basal ganglia are involved in reinforcement learning (Schultz et al., 1997; Glimcher, 2011). Recently, two subtypes of layer 5 pyramidal cells projecting to the striatum and pons have been revealed to show unique connectivity (Morishima and Kawaguchi, 2006; Otsuka and Kawaguchi, 2008; Brown and Hestrin, 2009; Morishima et al., 2011). Crossed corticostriatal (CCS) cells innervate both the ipsilateral and contralateral striatum, but do not send axons to the pons, whereas corticopontine (CPn) cells project to the ipsilateral striatum and pons, but not to the contralateral striatum (Cowan and Wilson, 1994; Reiner et al., 2003). Although CPn/CPn and CCS/CCS cell pairs have similar connection probabilities, CPn/CPn pairs exhibited greater reciprocal connectivity, stronger unitary synaptic transmission, and more facilitation of paired-pulse responses. CCS cells innervate CPn cells, whereas CPn cells do not innervate CCS cells (Morishima et al., 2011). These data suggest that the local circuitry of frontal cortex is organized selectively according to output channels associated with specific types of learning.
Connections between the frontal cortex and hippocampus participate in cognitive memory formation and retrieval (Miyashita, 2004; Eichenbaum, 2006). However, the frontal cortex does not directly project to the hippocampus, but rather to the perirhinal cortex (PRC), a part of parahippocampal cortex, and to the amygdala (Burwell, 2001; Sah et al., 2003; Gabbott et al., 2005; Furtak et al., 2007). Although the functional importance of the cortico-parahippocampal pathway is well recognized, little is known about the morphological, electrophysiological, connectional, and molecular properties of cortical neurons projecting to the perirhinal cortex. Furthermore, the potential interaction between perirhinal cortex and cerebellar/basal ganglia projections in frontal cortical circuits remains uninvestigated.
In this study, we investigated the local and distant connection patterns of PRC-projecting cells. Two PRC-projecting cell subtypes were discriminated by their corticocortical and subcortical targets. These subtypes had distinct laminar distributions, physiological and morphological properties, and calcium-binding protein expression patterns. We found that frontal cortical neurons innervating the perirhinal cortex provide two parallel streams of output that differ in their intracortical connections and subcortical targets, suggesting that the neuron types and connectivity within local cortical circuits are specialized according to the different memory and learning systems in which the frontal cortex participates.
Materials and Methods
Fluorescent retrograde labeling of pyramidal cells.
All experiments were conducted in compliance with the guidelines for animal experimentation of the Okazaki National Research Institutes. The following projection subtypes of pyramidal cells were identified in the secondary motor cortex (M2) by fluorescent retrograde tracer injection into target areas of interest: perirhinal cortex (PRC-projecting cells), basolateral amygdala (amygdala-projecting cells), thalamus [corticothalamic (CTh) cells], pons (CPn cells), and contralateral striatum (CCS cells) (Morishima and Kawaguchi, 2006).
Retrograde labeling experiments were performed on male and female young (P19–P23) Wistar rats. Rats were anesthetized with ketamine (40 mg/kg, i.m.) and xylazine (4 mg/kg, i.m.). The following tracers were used: Fast Blue (2% in distilled water; Illing); Alexa Fluor 555-conjugated cholera toxin subunit B (CTB555; Invitrogen); Alexa Fluor 488-conjugated cholera toxin subunit B (CTB488; Invitrogen); red fluorescent retrobeads (red beads; Lumafluor); and green fluorescent retrobeads (green beads; Lumafluor). One or two fluorescent tracers with different excitations were injected into one or two target areas by pressure injection (PV820; WPI) using glass pipettes (tip diameter, 50–80 μm; 80–100 nl). For focal injection, CTB555 was applied to the perirhinal area by iontophoresis (negative current, 1 μA; 7 s on-off cycles; 20 min), using glass pipettes (tip diameter, 20–30 μm).
Coordinates of the injection sites were as follows (in mm): basolateral amygdala, 2.0–2.5, 4.1–4.3, and 5.6–6.0 (caudal to bregma, lateral, and deep); thalamus (injection center: ventromedial nucleus), 2.3–3.0, 1.0–1.2, 5.4–5.6; and pons (pontine nucleus), 5.8–6.3, 0.6, 8.0–8.2. For the perirhinal cortex injection (rostral regions of areas 35 and 36, 2.2–4.0 mm caudal to bregma; corresponding to about zygomatic process of temporal bone in surface view), we advanced the pipette inclined 30° from the midline, using a blood vessel along the rhinal sulcus as a reference. For contralateral striatum injection, the cerebral cortex, hippocampus, and fimbria just caudal to the striatum were removed by suction, and tracers were applied obliquely thorough the lateral ventricle (see Fig. 1B; 2.0 mm lateral from midline and 1.3–1.5 mm deep along the pipette tilted 48° rostrally).
Figure 1.
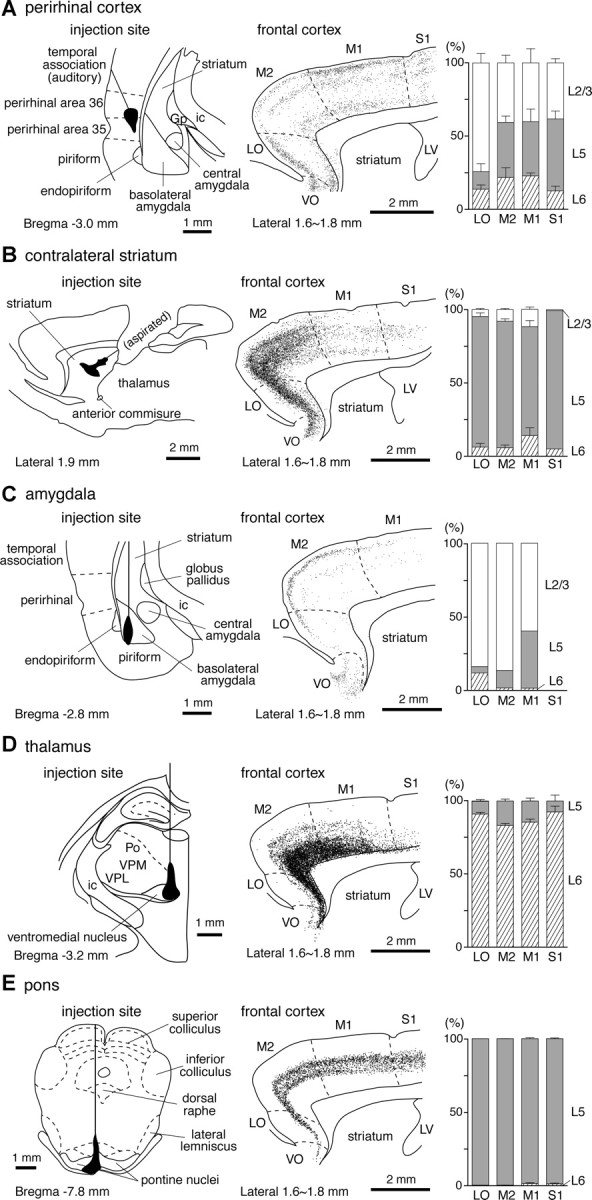
Projection patterns of frontal cortical neurons to other brain areas. A, Perirhinal cortex projection. Left, Injection area of a retrograde tracer and glass pipette track for its application in an oblique angle (coronal section). Middle, A parasagittal map of retrogradely labeled cells in the frontal areas by the injection shown in the left panel. Labeled somata were marked with small dots on the reconstruction from four serial sections, each 50 μm thick. Right, Layer compositions of retrogradely labeled PRC-projecting cells in LO, M2, M1, and the rostral part of S1 (mean ± SD; percentages of labeled cells in each layer, three rats). In S1, L4 neurons were included in L2/3. PRC-projecting cells were found to be distributed in multiple layers: upper L2/3, upper L5, and L6. Total number of cells from three rats: 1256 in LO; 3625 in M2; 3633 in M1; 1819 in S1. B, Contralateral striatum projection. Left, Injection area (parasagittal section); middle, a parasagittal map of retrogradely labeled cells; right, layer compositions of retrogradely labeled CCS cells (mean ± SD, 3 rats). To avoid spilling of the tracers into dorsally covered cortex and white matter, part of the brain tissue was aspirated. Labeled cells were mainly located in L5, but their distribution expanded from deeper L2/3 to upper L6. Total number of cells from three rats: 4066 in LO; 14628 in M2; 1338 in M1; 176 in S1. C, Amygdala projection. Left, Injection area (coronal section); middle, a parasagittal map of retrogradely labeled cells; right, layer compositions of retrogradely labeled amygdala-projecting cells (one rat). In this case, the tracer injection was confined to the basolateral amygdala without spilling into the striatum and mostly labeled upper L2/3 cells. S1 is not shown because of the few cells labeled. Cell number: 93 in LO; 505 in M2; 67 in M1. D, Thalamus projection. Left, Injection area (coronal section); middle, a parasagittal map of retrogradely labeled cells; right, layer compositions of retrogradely labeled CTh cells (mean ± SD, three rats). Tracers were deposited around the ventromedial nucleus of the thalamus. Total number of cells from three rats: 2333 in LO; 10972 in M2; 3293 in M1; 241 in S1. E, Pons injection. Left, Injection area (coronal section); middle, a parasagittal map of retrogradely labeled cells; right, layer compositions of retrogradely labeled CPn cells (mean ± SD, three rats). Tracers were mainly injected into the ipsilateral pontine nuclei. Total number of cells from three rats: 514 in LO; 2778 in M2; 2718 in M1; 1089 in S1. Gp, Globus pallidus; ic, internal capsule; LV, lateral ventricle; Po, posterior thalamic nucleus; VPM, ventral posteromedial thalamic nucleus; VPL, ventral posterolateral thalamic nucleus.
Following a survival period of 3–4 d, the animals were anesthetized with sodium pentobarbital (60 mg/kg, i.p.) and transcardially perfused with saline followed by a fixative containing 4% paraformaldehyde and 0.2% picric acid in 0.1 m sodium phosphate buffer (PB). To obtain more sections with M2 vertical laminar structures preserved, oblique horizontal sections were made at a thickness of 20 or 50 μm on a slicer. For direct comparison of retrograde labeling among dorsal frontal areas [primary motor cortex (M1); somatosensory cortex (S1); and M2] and orbital cortices [lateral orbital cortex (LO) and ventral orbital cortex (VO)] in the same planes, 50-μm-thick parasagittal sections were cut at 1.5–2.0 mm lateral from the midline (Fig. 1). Distributions of retrogradely labeled cells were reconstructed from four fluorescent micrographs of the parasagittal sections by plotting locations of labeled somata using Photoshop (Adobe). Cortical areas were identified according to Paxinos and Watson (2007) with reference to laminar thickness differences. The perirhinal cortex was sectioned coronally to obtain both areas 35 and 36 in the same plane. Perirhinal subregions were identified by immunoreactivity differences for neurofilament 200 kDa (N200) or parvalbumin (see Fig. 3A).
Figure 3.
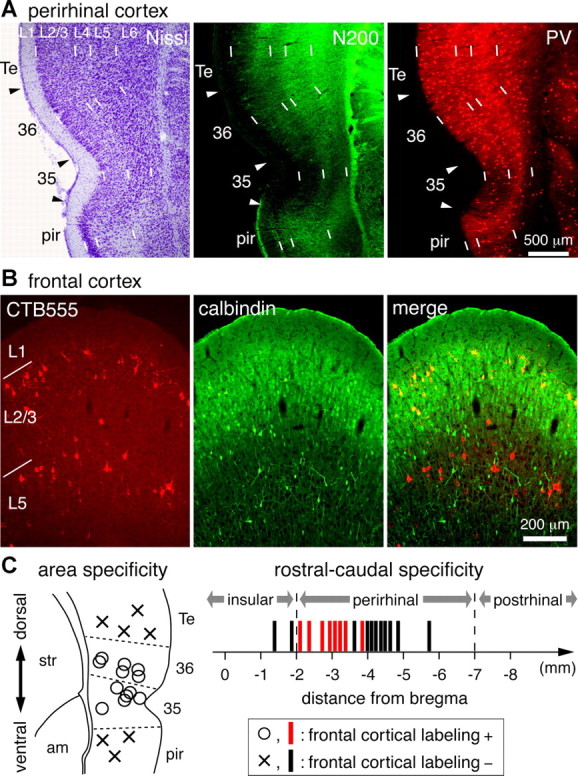
Regional specificity of fronto-perirhinal projection. A, Immunohistochemical distinction of perirhinal cortex subregions and adjacent areas. Adjacent coronal sections were stained by thionin (Nissl) and fluorescent immunohistochemistry for neurofilament 200 kDa (N200) and parvalbumin (PV). Note the immunoreactivity differences of N200 in the superficial layers between cortical regions, and the weakest PV immunoreaction in area 35. Arrowheads indicate border of cortical regions. B, Calbindin immunoreactivity and laminar distribution of PRC-projecting cells. PRC-projecting cells were retrogradely labeled by CTB555 injection into the perirhinal cortex. L2/3 PRC-projecting cells were positive for calbindin, whereas L5 PRC-projecting cells were negative. C, Area specificity of PRC-projecting cell innervation. Left, Dorsoventral cortical area specificity of PRC-projecting cell innervation. Injection sites were rostrocaudally compressed (range, 2.1–3.8 mm caudal to bregma) and shown in a representative coronal map. Frontal cortical neurons were labeled by retrograde tracer application to perirhinal area 35 or 36 (open circles; n = 12), but not by injection into adjacent cortices (crosses; n = 7). Right, Rostrocaudal subregion specificity of PRC-projecting cell innervation. Vertical bars, Injections at various rostrocaudal levels along the rhinal sulcus; red bars, locations resulting in frontal cortical labeling (n = 15); black bars, locations resulting in no retrograde labeling in the frontal cortex (n = 11); 35, perirhinal area 35; 36, perirhinal area 36; Te, temporal association cortex; pir, piriform cortex; str, striatum; am, amygdala.
Layer identification and sublayer divisions in M2.
Frontal cortical layers were cytologically identified on the basis of the size and density of neuronal somata: layer 1 (L1) is the most superficial cell-sparse layer; L5 contains cells with larger somata than superficial layers and L6; and L6 is higher in density of somata than L5. L2/3, a layer between L1 and L5, could be further divided into sublayers different in type 2 vesicular glutamate transporter (VGLUT2) immunoreactivity (Morishima et al., 2011) (see Fig. 2A): upper sublayer (L2/3a) with weaker staining and lower sublayer (L2/3b) with stronger staining. Similarly, both L1 and L5 were composed of two sublayers (Fig. 2A): upper L1 (L1a) with stronger VGLUT2 immunoreactivity than lower L1 (L1b); and lower L5 (L5b) with stronger VGLUT2 immunoreactivity than upper L5 (L5a). The L1a-L1b border was ∼50 μm deep from the pia, the L2/3a-L2/3b border was ∼250 μm deep, and the L5a-L5b border was ∼750 μm deep in the M2 oblique horizontal slice preparation (Morishima et al., 2011).
Figure 2.
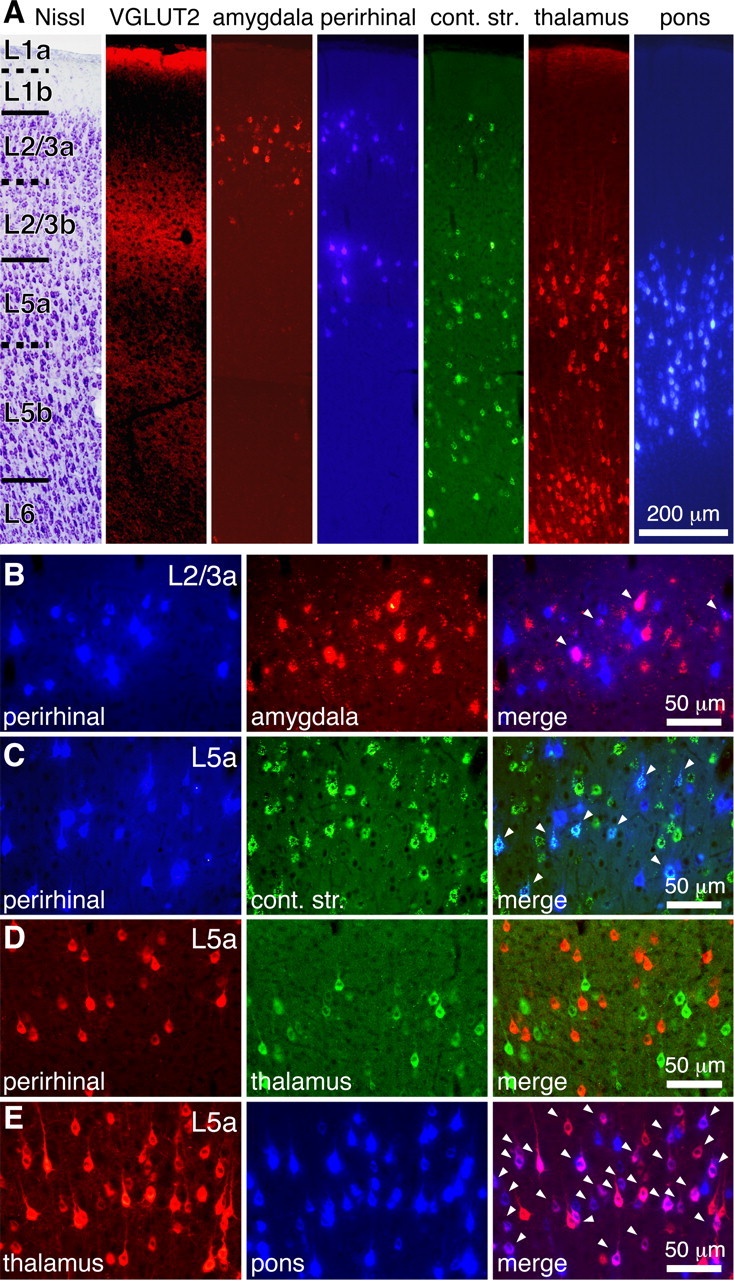
Target-dependent sublaminar distributions of frontal cortical pyramidal cells. A, Sublaminar distributions of retrogradely labeled cells. Layers and sublayers were identified by tionin staining (Nissl) and VGLUT2 immunoreaction. L1a, L2/3b, and L5b were more immunopositive for VGLUT2. amygdala, Amygdala-projecting neurons in L2/3a (labeled by red beads); perirhinal, PRC-projecting neurons in L2/3a and L5a (by Fast Blue); cont. str., contralateral striatum-projecting neurons mainly located in L5 (by green beads); thalamus, thalamus-projecting neurons in L5a and L6 (by CTB555); pons, pons-projecting neurons in L5 (by Fast Blue). B–E, Relationship of pyramidal cell projection subtypes identified by different fluorescent tracers. Arrowheads indicate colocalization of two fluorescent tracers. B, Partial colabeling in L2/3a from perirhinal cortex and amygdala injections (Fast Blue and red beads, respectively). C, Simultaneous labeling in L5a from perirhinal cortex and contralateral striatum injections (Fast Blue and green beads). D, No colabeling in L5a from perirhinal cortex and thalamus injections (CTB555 and CTB488). E, Simultaneous labeling in L5a from thalamus and pons injection (CTB555 and Fast Blue).
Immunohistochemistry.
For the immunofluorescence staining, sections were incubated with a mouse monoclonal antibody against calbindin D (C-8666, Sigma; 1:4000), a mouse monoclonal antibody against N200 (N0142, Sigma; 1:4000), a guinea pig antibody against VGLUT2 (AB2251, Millipore Bioscience Research Reagents; 1:2000), or a rabbit antibody against parvalbumin (PV-28, Swant; 1:4000) in 0.05 m Tris-HCl buffered saline (TBS) containing 10% normal goat serum, 2% bovine serum albumin, and 0.5% Triton X-100 (TX) overnight. After washes with TBS, the sections were incubated with an Alexa Fluor-conjugated secondary antibody (Invitrogen; 1:200). The sections were mounted on glass slides and coverslipped using Krystalon mounting medium (EM Science). The sections were observed by epifluorescence (excitation, 360–370 nm; emission, 420–460 nm for Fast Blue; excitation, 470–490 nm; emission 510–550 nm for Alexa Fluor 488 and green beads; excitation, 545–580 nm; emission, 610 nm for Alexa Fluor 555 and red beads).
Slice preparation.
Young male and female Wistar rats (P18–P21) were anesthetized with ketamine (40 mg/kg, i.m.) and xylazine (4 mg/kg, i.m.). CTB555 (80–100 nl) was injected into the perirhinal cortex, and red beads (80–100 nl) into the thalamus. Two or three days after the injection, the animals were deeply anesthetized with isoflurane and decapitated. Brains were quickly removed and submerged into ice-cold physiological Ringer's solution. Three hundred-micrometer-thick oblique horizontal sections of the frontal cortex including M2 were cut and immersed in a buffered solution containing the following (in mm): NaCl 125, KCl 2.5, CaCl2 2, MgCl2 1, NaHCO3 25, NaH2PO4 1.25, glucose 25, and lactic acid 4. The solution was continuously equilibrated with a mixture of 95% O2 and 5% CO2. During recording, lactic acid was omitted. Membrane potentials of retrogradely labeled cells were recorded in a whole-cell mode at 32°C. Retrogradely labeled cells were identified by epifluorescence under a 40× water-immersion objective. Pyramidal cells labeled with red beads could be discriminated from those with CTB555 because the former showed a granular staining pattern, while the latter were homogeneously stained in the cytosol (Morishima and Kawaguchi, 2006).
Electrophysiological recording.
The pipette solution consisted of (in mm): potassium gluconate 130, KCl 2, MgCl2 2, ATP 3, GTP 0.3, HEPES 10, and biocytin 20.1. The pH of the solution was adjusted to 7.3 with KOH and the osmolarity was ∼290 mOsm. Current-clamp and voltage-clamp recordings were made in MultiClamp 700B (Molecular Devices), and electrophysiological data were analyzed by IGOR Pro (WaveMetrics) with NeuroMatic functions (http://www.neuromatic.thinkrandom.com). The input resistance was determined by linear fitting of voltage responses to hyperpolarizing current injections (−20 to −100 pA in 20 pA steps), and the time constant by a transient response to a −50 pA current pulse. Firing patterns and dependency of firing frequency on the depolarizing current injection were investigated with a series of depolarizing pulses up to +600 pA (duration, 1 s; step, 50 pA) from resting membrane potentials. Somatic EPSCs were induced by single action potentials generated in presynaptic neurons by depolarizing current pulses (duration, 5 ms) and were measured in postsynaptic neurons voltage-clamped at −60 mV (sampling rate, 20 kHz). Series resistance (15–30 MΩ) of the postsynaptic whole-cell recording was monitored periodically by delivery of small voltage pulses (−5 mV, 10 ms). Postsynaptic currents evoked by single presynaptic action potentials were identified in individual traces. The current peak of each trace was determined from averaged amplitudes of a 0.2 ms moving time window (five sampling points). The peak amplitude was calculated as the difference in current at the peak of the EPSC and a baseline current calculated over a window of 10 ms before presynaptic excitation. The EPSC rise time was calculated from 20 to 80% of the peak amplitude. The onset was defined as the point at which a line extrapolated from the rise time crossed the baseline current. The latency was measured from the presynaptic spike peak to the EPSC onset. The decay time constant was obtained by fitting a single exponential to the current trace after the peak. To average EPSC traces, the presynaptic spike peaks were aligned. The paired-pulse ratio of EPSCs at 10 Hz was obtained from EPSCs with amplitudes >6 pA. The coefficient of variation (CV) for each pair was obtained from the traces including failures (>20 EPSCs). The CV of EPSC amplitudes was corrected for baseline noise by subtracting the variance of the baseline noise from the variance of the EPSC peak amplitude. The baseline noise was obtained by selecting a second baseline region and amplitude window same as in the peak amplitude determination, but 100 ms before the presynaptic spike.
Histology of biocytin-labeled cells.
Tissue slices containing biocytin-loaded cells were fixed by immersion in 4% paraformaldehyde, 1.25% glutaraldehyde, and 0.2% picric acid in PB overnight at 4C°, followed by a freezing–thawing procedure in sucrose-containing PB using liquid nitrogen twice. Slices were resectioned at a thickness of 50 μm. Sections were incubated with avidin–biotin–peroxidase complex (Vector Labs; 1:100) in 0.05 m TBS with 0.04% TX overnight at 4C°. After washing in TBS, the slices were reacted with DAB (0.02%), nickel ammonium sulfate (0.3%), and H2O2 (0.01%) in Tris-HCl buffer. They were then postfixed in 1% OsO4 in PB containing 7% glucose, dehydrated, and flat embedded on glass slides in Epon. After all the procedures, the tissues shrink to approximately 90% in length (Karube et al., 2004). The shrinkage was not corrected in the analysis.
Quantitative morphology.
Somata, axons, and dendrites of stained cells were reconstructed three-dimensionally with a 60× or 100× objective combined with a further 1.25× magnification, using the Neurolucida system (MicroBrightField). Contacts of an axonal bouton on a postsynaptic dendrite were defined as both elements in the same focal plane using a 100× objective (NA, 1.4) (see Fig. 6D). Reconstructed neurons were quantitatively analyzed with NeuroExplorer (MicroBrightField) and IGOR Pro. Internode intervals were lengths between two successive nodes (branch points) along the dendrite, including those from the soma origin to the first node. The apical tuft area was determined by measuring the area surrounded by the lines connecting tuft dendrite endings projected onto a plane perpendicular to the pia–white matter axis. To evaluate the basal dendrite extension, we measured direct distances between the soma origin and true endings (not including endings due to slice preparation) along both the horizontal and vertical axes (horizontal and vertical extents, respectively). Dendritic length was the distance along the dendritic course. From reconstructions of connected pairs, we computationally searched out dendritic locations in postsynaptic cells, where presynaptic axon came close within 2.5 μm (center-to-center). The locations where dendrites were the closest point in the neighborhood were called approaches, including contacts (Morishima and Kawaguchi, 2006).
Figure 6.
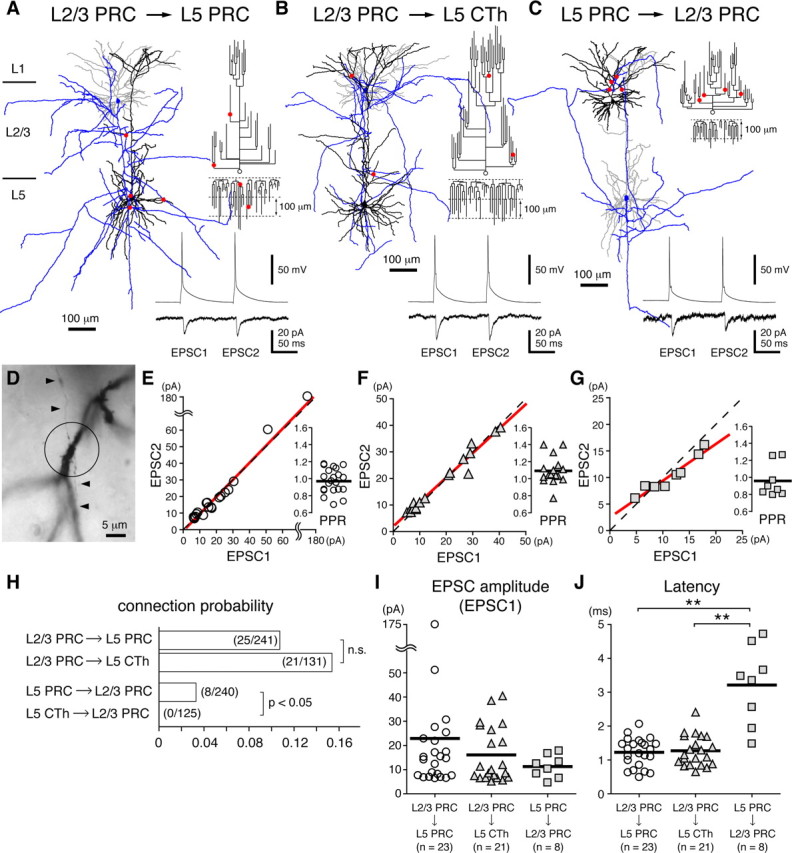
Synaptic connection properties between projection subtypes. A–C, Neurolucida reconstructions (left), postsynaptic cell dendrograms (upper right), and paired presynaptic spikes and evoked EPSCs (averaged trace) with 100 ms interval (lower right) of the representative pairs of connected cells: connection from L2/3 PRC-projecting cell (simply, PRC in figures) to L5 PRC-projecting cell (A); that from L2/3 PRC-projecting cell to CTh cell (B); that from L5 PRC-projecting cell to L2/3 PRC-projecting cell (C). Presynaptic axons, presynaptic dendrites and postsynaptic dendrites were colored blue, gray and black respectively, and axo-dendritic contacts were marked by red filled circles. Open circles and associated trees of the dendrogram represent soma and apical dendrite, and lower trees represent basal dendrites. D, Photograph of a contact in the connection from L2/3 PRC-projecting cell to L5 PRC-projecting cell. A presynaptic axon (indicated by arrowheads) and postsynaptic basal dendrites were crossed at the same focal plane (center of the circle). E–G, Relationships of the first EPSC amplitudes (EPSC1) and the second EPSC amplitudes (EPSC2) induced by two successive presynaptic spikes (100 ms intervals): L2/3 PRC-projecting cell to L5 PRC-projecting cell (E); L2/3 PRC-projecting cell to L5 CTh cell (F); L5 PRC-projecting cell to L2/3 PRC-projecting cell (G). Red line, Regression line; black dashed line, unit slope. Inset, Paired-pulse ratio (PPR; EPSC2/EPSC1 at 10 Hz); black line, mean. PPR was close to 1 in connections from L2/3 to L5 independently of the EPSC amplitude. Note that the regression line slope in the connection from L5 PRC-projecting to L2/3 PRC-projecting cells was smaller than the other two connections. H, Connection probabilities between projection subtypes. Numbers in parentheses are (No. of connected pairs)/(No. of pairs examined). Note that the probabilities from L2/3 PRC-projecting cells to two L5 subtypes were similar (p = 0.11, χ2 test), but connections from L5 subtypes to L2/3 PRC-projecting cells were found only from L5 PRC-projecting cells, and not from CTh cells (p < 0.05). I, EPSC amplitude distribution. Mean amplitudes (black horizontal lines) were not significantly different between three connections (ANOVA, p = 0.45). J, Latency from presynaptic spike peak to EPSC onset. Connections from L5 to L2/3 PRC-projecting cells had longer latency than the other two L2/3 to L5 interlaminar connections. **p < 0.01; black horizontal lines, means.
Statistics.
Data are given as the mean ± SD. One-way ANOVA and post hoc Tukey test were used for statistical comparisons among three cell classes and connection types, and Mann–Whitney U test was used for two-group comparisons. The difference of EPSC amplitude distribution and axon length distribution within superficial sublaminae were tested by Kolmogorov–Smirnov test. The data management and analysis were done by Microsoft Excel, Graphpad prism (Graphpad), and IGOR Pro.
Results
Origins of frontal projection pathways to the perirhinal cortex
The rat frontal cortex projects to perirhinal regions (Burwell and Amaral, 1998b), but the specific neuron subtypes involved in this projection pathway have not yet been determined. To address this issue, we first confirmed the presence of frontal projections to the perirhinal cortex by injecting CTB555 there, and examined the laminar distribution of retrogradely labeled cells in frontal cortex (PRC-projecting cells) (Fig. 1A). In parasagittal sections, we found labeled PRC-projecting cells to be distributed widely in several frontal cortical regions, including the LO, VO, M1, and M2 as well as in S1 (Fig. 1A).
PRC-projecting cells were scattered in multiple layers in all regions, but their laminar distribution patterns were different between LO and dorsal cortices (M1, M2, and S1). In LO, most labeled neurons were found in L2/3, with only few residing in deeper layers (L2/3, 74 ± 11%; L5, 12 ± 9%; L6, 13 ± 5%; n = 3 rats; obtained from a parasagittal frontal map, which was composed of four sections, each 50 μm thick). On the other hand, labeled neurons in the dorsal cortices clustered in the following three distinct sublaminae: upper L2/3, upper L5, and L6. One-third to one-half of labeled neurons were found in L2/3 (40 ± 17% in M1, 40 ± 9% in M2, 38 ± 5% in S1) with another one-third to one-half were found in L5 (37 ± 15% in M1, 38 ± 8% in M2, 49 ± 9% in S1). The remaining 10–25% of neurons were in L6 (23 ± 5% in M1, 22 ± 11% in M2, 13 ± 5% in S1). Because of the difficulty of identifying discrete layers in parasagittal sections, we did not quantify the layer distribution in VO, but found labeled neurons at depths presumed to also include L2/3, L5, and L6. Some labeled neurons were found within the white matter under the orbital cortex.
Importantly, L6 labeling in the frontal cortex depended on the injection site depth within the perirhinal cortex. Without tracer deposits in L6 of perirhinal cortex, frontal L6 labeling was rarely found (data not shown). Since it was difficult to inject tracers down into deep L6 without its spread into the white matter, which may label fibers of passage not innervating the perirhinal cortex, we restricted our study to retrogradely labeled PRC-projecting neurons in L2/3 and L5 in experiments in which injected tracers did not spread to the white matter under the perirhinal regions.
Axon collateralization of PRC-projecting cells to subcortical structures
To elucidate the interaction of PRC-projecting cells in other brain subsystems, we investigated other axonal projections of L2/3 and L5 PRC-projecting cells in M2. We compared the laminar distribution of frontal pyramidal cells projecting to the contralateral striatum (CCS cells), amygdala (amygdala-projecting cells), thalamus (CTh cells), and pons (CPn cells) with PRC-projecting cells by fluorescent retrograde labeling (Figs. 1, 2).
L2/3 PRC-projecting cells located in L2/3a (Fig. 2A) had a similar laminar distribution as did amygdala-projecting cells, which mainly distributed around M2 (Figs. 1C, 2A) (Mcdonald et al., 1996; Gabbott et al., 2005). Dual retrograde labeling indicated a partial overlap of L2/3 PRC-projecting and amygdala-projecting cells in the frontal cortex (Fig. 2B). In the three rats observed, dual labeled neurons were 5.7 ± 1.6% (113/2095) of L2/3 PRC-projecting cells and 5.4 ± 1.8% (113/2173) of amygdala-projecting cells. Basolateral amygdala injection with spilling of tracers into striatum dorsal to it labeled L2/3 cells with a few L5 cells, whereas the injection confined to amygdala did mostly L2/3 cells (Figs. 1C, 2A). In tracer injection into the ipsilateral striatum, labeling of L5 was intense, but that of L2/3a was rarely found (data not shown).
L5 PRC-projecting cells were distributed mostly in L5a (Fig. 2A). In comparison, CCS and CPn cells were distributed throughout the entire L5 (Figs. 1B,E, 2A), and CTh cells were localized in both L5a and L6 (Figs. 1D, 2A) (Deschênes et al., 1994; Gao and Zheng, 2004). Dual retrograde labeling revealed that L5 PRC-projecting cells were overlapped with the upper CCS group (Fig. 2C), but distinct from CPn and CTh cells (Fig. 2D). Quantitatively, 23.7 ± 0.8% (526/2228) of L5 PRC-projecting cells were also labeled retrogradely from contralateral striatum, whereas 0.6 ± 0.2% (7 of 1304) of L5 PRC-projecting cells were overlapped with CTh cells, and 1.1 ± 1.5% (9/1304) of L5 PRC-projecting cells with CPn cells (each data point was obtained from three rats).
On the other hand, CTh cells partially overlapped with the upper CPn cells (Fig. 2E). In the three rats observed, 22.0 ± 9.6% (782 of 3498) of CTh cells were overlapped with CPn cells. These tracer experiments indicated the following projection subtypes: (1) L2/3 PRC-projecting cells in the L2/3a; (2) amygdala-projecting cells in the L2/3a; (3) overlapping population of 1 and 2; (4) L5 PRC-projecting cells mainly in the L5a; (5) CCS cells in the L5 projecting to the both sides of the striatum (Wilson, 1987); (6) overlapping population of 4 and 5; (7) CTh cells in the L5a; (8) CPn cells in the L5 projecting to the pons; and (9) overlapping population of 7 and 8.
Frontal projection pattern to perirhinal subregions
The perirhinal cortex is dorsoventrally divided into two major subregions. The ventral part corresponds to Brodmann area 35, while the dorsal part corresponds to area 36, also known as ectorhinal cortex (Burwell et al., 1995; Burwell, 2001; Paxinos and Watson, 2007). These two areas can be objectively identified by immunohistochemical staining patterns for N200 and parvalbumin. We confirmed that N200 expression is very weak in the superficial layers of area 35, but moderate in area 36, when compared with adjacent cortices (Fig. 3A, middle). As previously shown, parvalbumin immunoreactivity was weak in the superficial layers of area 35 (Burwell et al., 1995), as identified by N200 immunoreactivity (Fig. 3A, right).
We next investigated how M2 innervates these temporal areas using small iontophoretic tracer depositions confined to areas 35 or 36, as identified by N200 immunoreactivity (Fig. 4A,D). First, we looked for retrograde labeling in M2 following injections into the perirhinal cortex and adjacent cortices dorsal and ventral to areas 35 and 36. Retrograde labeled neurons were found only when tracer depositions were delivered into perirhinal areas 35 or 36, but not after injections into the piriform cortex (situated ventrally) or the temporal association cortex (situated dorsally) (Fig. 3C, left). Next, we compared labeling in M2 after tracer injection at perirhinal sites located rostrocaudally along the rhinal sulcus. We defined the border of the perirhinal and insular cortices as the caudal end of the claustrum (Burwell, 2001). Retrogradely labeled cells were found only after injections into the rostral part of the perirhinal cortex, and not found after injections into caudal areas or the rostrally adjacent insular cortex (Fig. 3C, right). Thus, we found that M2 preferentially innervates the rostral part of the perirhinal cortex.
Figure 4.
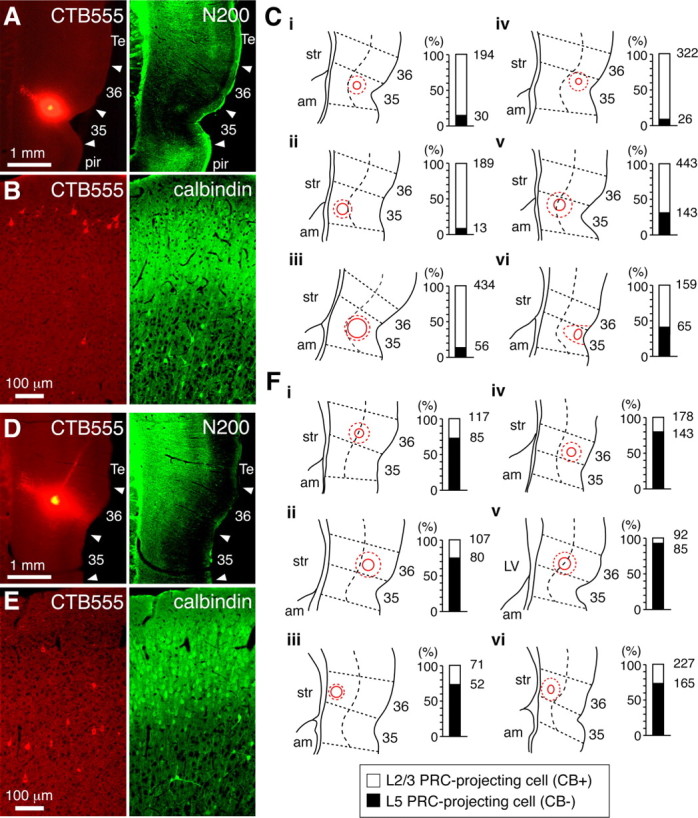
Perirhinal subregion-dependent differentiation of PRC-projecting cells. A–C, Preferential innervation of area 35 by L2/3 PRC-projecting cells. A, Electrophoretic focal injection of CTB555 into area 35 (left). Cortical region borders (arrowheads) were determined by N200 immunoreaction (right). B, Retrogradely labeled neurons in the frontal cortex by injection in A (left). L2/3 and L5 PRC-projecting cells were distinguished by calbindin immunoreactivity (right). The majority of labeled cells were L2/3 PRC-projecting cells. C, Labeled cell distributions by local injection of CTB555 into area 35 (six cases). Left, Injection sites marked by solid red circles, judging from localized intense fluorescence and columnar neuropil labeling at deeper layers. Broken red circles, strong fluorescence region due to neuropil incorporating the tracer; dotted straight lines, cortical region borders; dotted curves parallel to the surface, borders between superficial layers (L2/3 and L4) and upper L5. Right, Proportion of calbindin-positive L2/3 PRC-projecting (open part) and calbindin-negative L5 PRC-projecting cells (filled part) labeled by corresponding injection sites. Numbers indicate total labeled cells (100%) and L5 PRC-projecting cells counted. Tracers injected mainly into area 35 labeled more L2/3 PRC-projecting cells than L5 cells. On the other hand, the cortical depth of injection sites was not correlated with the laminar ratio of labeled PRC-projecting cells. D–F, Preferential innervation of area 36 by L5 PRC-projecting cells. D, Electrophoretic focal injection of CTB555 into area 36. E, Retrogradely labeled neurons in the frontal cortex by injection in D. More labeled cells were found in L5 PRC-projecting cells. F, Labeled cell distribution by local injection of CTB555 into area 36 (6 cases). Tracers injected mainly into area 36 labeled more L5 PRC-projecting cells than L2/3 cells, regardless of injected layers. 35, Perirhinal cortex area 35; 36, perirhinal cortex area 36; Te, temporal association cortex; pir, piriform cortex; str, striatum; am, amygdala; LV, lateral ventricle.
To further identify projections from the frontal cortex to areas 35 and 36, retrogradely labeled neurons in each cortical layer were separately counted from 20 to 40 serial sections (20 μm thick) in the area of M2 with the densest labeling, while L2/3 PRC-projecting cells were identified by calbindin expression since calbindin stained almost all L2/3a pyramidal cells, but not L5 pyramidal cells (Fig. 3B). Retrograde labeling from area 35 was mainly observed in calbindin-positive L2/3 PRC-projecting cells (81 ± 14% of the total; range, 59–92%; n = 6 rats) (Fig. 4B,C), whereas labeling from area 36 was mainly in calbindin-negative L5 PRC-projecting cells (79 ± 8%; range, 73–92%; n = 6 rats) (Fig. 4E,F). These innervation preferences were found regardless of the laminar patterns of deposition in perirhinal regions [Fig. 4C, case v (injections into both superficial and deep layers of area 35 preferentially labeled L2/3 cells); Fig. 4F, cases i and v (those of area 36 preferentially labeled L5 cells)], suggesting that L2/3 PRC-projecting cells preferentially innervate area 35, while L5 PRC-projecting cells preferentially innervate area 36.
Electrophysiological and morphological properties of L5 PRC-projecting and CTh cells
As shown in Figure 2, L5 pyramidal cells in frontal cortex are composed of multiple projection neuron subtypes, which are largely divided into two exclusive pyramidal groups: one includes PRC-projecting cells, CCS cells, and those cells projecting their axons to both targets; the other includes CTh cells, CPn cells, and those cells innervating both. The former may be classified in intratelencephalic-type pyramidal cells and later in pyramidal tract-type pyramidal cells (Wilson, 1987; Levesque et al., 1996; Reiner et al., 2003). Because our previous studies found that CCS and CPn cells have different characteristics in their dendritic morphology and electrophysiology (Morishima and Kawaguchi, 2006; Otsuka and Kawaguchi, 2008), we compared the morphology and electrophysiology of retrogradely labeled L5 PRC-projecting and CTh cells (Fig. 5).
Figure 5.

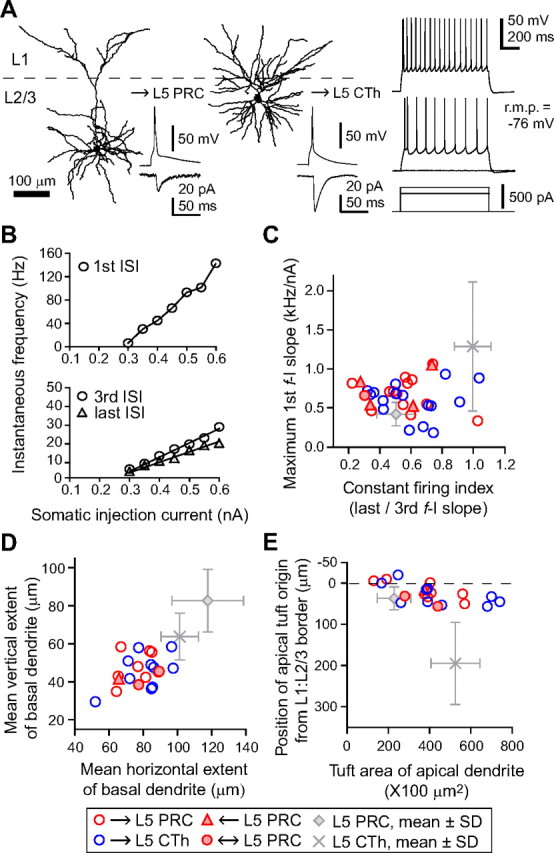
Comparison of morphological and electrophysiological properties between L5 PRC-projecting cells and CTh cells. A, Dendritic reconstructions of L5 PRC-projecting (left) and CTh (right) cells. The tuft of CTh cells was well developed and originated at the deeper L2/3 than that of L5 PRC-projecting cells (tuft origin, arrowheads). B, Repetitive firing patterns in response to constant depolarization. Left, L5 PRC-projecting cell. Right, CTh cell. Asterisk, Doublet firing often found in CTh cells (expanded at right). C, D, Plots of firing frequencies against the somatic injected current in L5 PRC-projecting (left) and CTh (right) cells (f-I curve). C, First ISI firing frequency against the current intensity. D, Third and last ISI firing frequencies against the current intensity. Note the nonlinear increase of the first ISI frequency in CTh cells due to the initial burst firing. E, Relationship of constant firing index (ratio of the slopes of last/third ISI f-I curve) and maximum slope of the first ISI f-I curve (maximum first f-I slope) between L5 PRC-projecting and CTh cells. Most CTh cells showed constant repetitive firing with higher value of maximum first f-I slope, whereas most L5 PRC-projecting cells showed adaptation in spike frequency. F, Mean horizontal and vertical extents of the basal dendrite measured from the soma origin. The basal dendritic field of L5 PRC-projecting cells was larger than that of CTh cells. G, Relationship between the depth of apical tuft origin and apical tuft area within L1. The tuft origin of CTh cells was deeper than L5 PRC-projecting cells, and the tuft area of L5 PRC-projecting cells was more compact than CTh cells. PRC, PRC-projecting cells; r.m.p., resting membrane potential.
CTh cells had more hyperpolarized resting membrane potentials than did L5 PRC-projecting cells (p < 0.01) (Table 1). Likewise, CTh cells had lower input resistances and faster membrane time constants than L5 PRC-projecting cells (p < 0.01) (Table 1). We also generated frequency–current (f-I) curves constructed from first-order, third-order, and last order interspike intervals (ISIs) in firing responses to individual current strengths (up to 0.6 nA; duration, 1 s) at the resting membrane potentials (Fig. 5C,D; Table 1), and f-I curves from median ISIs (Table 1). The f-I curves for the third, last, and median ISIs were linear in both L5 PRC-projecting and CTh cells [correlation coefficient (c.c.) = 0.99 ± 0.01 for all f-I curves in both subtypes] (Fig. 5D). The slopes of the median ISIs were also similar for the two neuron subtypes, but were different for the third and last ISIs (Table 1). The first ISI curve was linear for L5 PRC-projecting cells (Fig. 5C, left), but was sigmoidal for CTh cells (Fig. 5C, right), suggesting a nonlinear frequency increase in CTh cells representing the initial spike doublet typical of these neurons (Fig. 5B, right).
Table 1.
Comparisons of electrophysiological and morphological properties between projection subtypes
| (a) L2/3 PRC-projecting | n | (b) L5 PRC-projecting | n | (c) CTh | n | Comparisons, ANOVA/post hoc Tukey's test | |
|---|---|---|---|---|---|---|---|
| Passive membrane properties | |||||||
| Resting potential (mV) | −76.0 ± 5.0 | 60 | −65.7 ± 4.8 | 53 | −62.5 ± 3.3 | 53 | a < b** < c** |
| Input resistance (MΩ) | 89.0 ± 21.9 | 97.2 ± 21.7 | 58.1 ± 10.6 | c < a, b** | |||
| Time constant (ms) | 20.1 ± 5.7 | 18.3 ± 3.6 | 12.5 ± 2.7 | c < a, b** | |||
| Firing properties | |||||||
| Threshold current (pA) | 263 ± 65 | 60 | 148 ± 36 | 53 | 212 ± 54 | 53 | b < c** < a** |
| f-I curve characteristics | |||||||
| Maximum slope of 1st ISIs (kHz/nA) | 0.52 ± 0.26 | 60 | 0.41 ± 0.15 | 53 | 1.29 ± 0.83 | 53 | a, b < c** |
| Linear slope | |||||||
| Median ISIs (Hz/nA) | 50.9 ± 11.0 | 58 | 45.8 ± 12.7 | 53 | 49.6 ± 6.0 | 53 | b < a* |
| 3rd ISIs | 68.3 ± 19.7 | 78.4 ± 22.9 | 42.6 ± 333 | c < a, b** | |||
| last ISIs | 45.3 ± 11.7 | 39.5 ± 13.8 | 46.8 ± 6.7 | b < a*, b < c** | |||
| Linear slope ratio of last/third ISIs (constant firing index) | 0.67 ± 0.11 | 58 | 0.50 ± 0.12 | 53 | 1.00 ± 0.12 | 52 | b < a** < c** |
| Somatodendritic properties | |||||||
| Soma position from pia (μm) | 197 ± 50 | 21 | 539 ± 54 | 11 | 629 ± 67 | 10 | a < b** < c** |
| Basal dendrites | |||||||
| Primary dendrite number | 5.7 ± 1.6 | 6.5 ± 1.7 | 7.6 ± 1.6 | a < c* | |||
| Branching points (nodes) | 31.2 ± 9.5 | 26.5 ± 7.6 | 30.4 ± 5.5 | ||||
| Internode interval (μm) | 15.6 ± 3.1 | 21.5 ± 6.0 | 19.6 ± 3.0 | a < c*, a < b** | |||
| Mean horizontal extent (μm) | 79 ± 12 | 118 ± 21 | 101 ± 11 | a < c** < b* | |||
| Mean vertical extent (μm) | 46 ± 8 | 83 ± 16 | 64 ± 12 | a < c** < b** | |||
| Mean dendritic length from soma to each end (μm) | 124 ± 20 | 212 ± 35 | 162 ± 21 | a < c** < b** | |||
| Apical tufts | |||||||
| Tuft origin from L1-L2/3 border (μm) | 25 ± 23 | 36 ± 28 | 195 ± 101 | a, b** < c | |||
| Tuft area (×100 μm2) | 409 ± 171 | 227 ± 82 | 527 ± 120 | b < a**, c** | |||
| L1 dendritic length (μm) | 2368 ± 657 | 1661 ± 669 | 2987 ± 1029 | b < a*, b < c** | |||
| L1 branching point number | 15.2 ± 5.1 | 10.9 ± 6.1 | 14.8 ± 6.1 | ||||
Data are mean ± SD; n, number of cells.
*p < 0.05;
**p < 0.01.
To quantify spike frequency adaptation and the occurrence of initial doublet firing, we calculated the ratio of the last to third ISI slopes (last/third f-I slope; constant firing index) and the maximum slope of the first ISIs (Fig. 5E; Table 1). CTh cells showed more constant firing and less adaptation than L5 PRC-projecting cells (p < 0.01), and the maximum first f-I slope of CTh cells was larger than of L5 PRC-projecting cells (p < 0.01). The slopes of first ISIs were >1 kHz/nA (bursting cells) in most of the CTh cells (bursting cell number, 31 of 53 CTh cells and none of 53 L5 PRC-projecting cells). Although the difference in resting potentials might affect repetitive firing characteristics, the firing parameters were independent of resting potentials (maximum slope of first ISI vs resting potential, c.c. = −0.01 in L5 PRC-projecting cells and −0.04 in CTh cells; constant firing index vs resting potential, c.c. = −0.004 in L5 PRC-projecting cells and 0.01 in CTh cells). Since other physiological and morphological differences were not found between bursting and nonbursting CTh cells, they were grouped together for further analysis.
The somatic depth of CTh cells was 629 ± 67 μm measured from the pia (median, 617 μm; range, 560–752 μm), and that of L5 PRC-projecting cells 539 ± 54 μm (median, 516 μm; range, 472–661 μm). Since the border between L2/3 and L5a was 475 ± 25 μm, and that between L5a and L5b was ∼750 μm in the slice preparations (see Materials and Methods), the CTh cells recorded were distributed more in L5a than in L5b, and PRC-projecting cells were distributed mainly in L5a, in a similar L5 sublayer distribution found in retrograde labeling (Fig. 2A).
Finally, dendritic branching patterns were compared between the two subtypes. The mean horizontal and vertical dendritic extents and the mean dendritic lengths from soma origin to each end of the basal dendrites were smaller for CTh cells than L5 PRC-projecting cells (mean horizontal extent, p < 0.05; mean vertical extent and length, p < 0.01) (Fig. 5F; Table 1), suggesting CTh cells have more compact basal dendritic fields. On the other hand, the apical tufts of CTh cells were more developed with deeper tuft origins, wider horizontal spreads, and longer branches in L1 than L5 PRC-projecting cells (p < 0.01) (Fig. 5G; Table 1).
Connectivity between PRC-projecting and CTh cells
Next, we investigated interlaminar synaptic connectivity between the pair of L2/3 and L5 PRC-projecting cells and that of L2/3 PRC-projecting and L5 CTh cells aligned vertically (Fig. 6A–C). It is known that L2/3 pyramidal cells innervate several subtypes of L5 pyramidal cells (Otsuka and Kawaguchi, 2008, 2011; Anderson et al., 2010). However, this is the first study in which both L2/3 and L5 pyramidal cells were identified by retrograde labeling of projection neuron subtypes.
The probabilities for synaptic connections occurring from L2/3 PRC-projecting cells to L5 PRC-projecting or CTh cells were similar (0.10 for connections to L5 PRC-projecting cells and 0.16 to CTh cells, n = 241 and 131, respectively; p = 0.11) (Fig. 6H). In contrast, excitatory connections from L5 to L2/3 were found only between L5 and L2/3 PRC-projecting cells (probability, 0.03); no connections from CTh cells to L2/3 PRC-projecting cells were observed (Fig. 6H). Two of eight PRC-projecting cell pairs connected from L5 to L2/3 also had a reciprocal connection from the L2/3 to L5, suggesting selective formation of interlaminar reciprocal connections among PRC-projecting cells.
The mean EPSC amplitude and the mean paired-pulse ratio of the second to the first EPSC (EPSC2/EPSC1, interval 100 ms) were similar among the three connection types (Fig. 6I; Table 2). However, the correlations between first and second EPSCs were different (Fig. 6E–G). In the connections from L2/3 to L5 cells, the regression lines of EPSC2 on EPSC1 were quite close to the line of unit slope (Fig. 6E,F) [regression coefficient (r.c.) was 1.03 in the connection from L2/3 PRC-projecting cells to L5 PRC-projecting cells and 0.92 in that to CTh cells; not significantly deviated from unit slope, p = 0.31 and 0.91, respectively], whereas the regression line slope in the connection from L5 PRC-projecting cells to L2/3 PRC-projecting cells was <1 (Fig. 6G) (r.c. = 0.70; significantly deviated from the unit slope, p = 0.02). These suggest the differences in EPSC amplitude dependency of paired-pulse ratio among the connection types.
Table 2.
EPSC properties of the synaptic connection between projection subtypes
| (a) L2/3 PRC–L5 PRC | n | (b) L2/3 PRC–CTh | n | (c) L5 PRC–L2/3 PRC | n | Comparisons, ANOVA/post hoc Tukey's test | |
|---|---|---|---|---|---|---|---|
| Amplitude (pA) | 22.9 ± 34.9 | 23 | 16.1 ± 11.6 | 21 | 11.4 ± 4.7 | 8 | |
| CV of amplitude | 0.29 ± 0.10 | 21 | 0.25 ± 0.09 | 18 | 0.38 ± 0.11 | 7 | b < c* |
| Latency (ms) | 1.2 ± 0.4 | 23 | 1.3 ± 0.5 | 21 | 3.2 ± 1.2 | 8 | a, b < c** |
| CV of latency | 0.41 ± 0.13 | 20 | 0.40 ± 0.15 | 17 | 0.24 ± 0.09 | 7 | c < a, b* |
| Rise time (ms) | 1.3 ± 0.7 | 23 | 1.4 ± 0.7 | 21 | 1.2 ± 0.7 | 8 | |
| Decay time constant (ms) | 9.9 ± 5.3 | 23 | 10.8 ± 8.3 | 21 | 11.5 ± 11.3 | 8 | |
| Paired-pulse ratio at 10 Hz | 0.98 ± 0.14 | 21 | 1.09 ± 0.16 | 16 | 0.96 ± 0.19 | 8 |
Data are mean ± SD; n, number of cells.
*p < 0.05;
**p < 0.01.
The CV of EPSC amplitude was also different in the backward connection: that of the connection from L5 PRC-projecting cells to L2/3 PRC-projecting cells was slightly higher than that of the forward connections (Table 2). The EPSC rise time and the decay time constant were not significantly different, but the EPSC latency from L5 PRC-projecting cells to L2/3 PRC-projecting cells was longer than those in the two feedforward connections (p < 0.05) (Fig. 6J; Table 2).
Backward connections from L5 to L2/3 cells were found mostly from L5 PRC-projecting cells to L2/3 PRC-projecting cells. To see how L5 PRC-projecting and CTh cells innervate superficial cells, we stained ascending axonal arbors intracellularly (Fig. 7). Most cells in both subtypes had axon branches ascending toward L1, some extending widely in superficial layers, even while having few collateral branches (Fig. 7A,B). L5 PRC-projecting cells had axonal arborizations concentrated near the L1-L2/3 border, with collaterals in L1 frequently re-entered L2/3 (re-entered branches, 9 of 25 branches from five cells) (Fig. 7A, colored traces). On the other hand, CTh cells had arborizations in the middle of L1 without re-entering L2/3 (re-entered branches, 1 of 18 branches from five cells) (Fig. 7B). The axon length distribution at different depths was quantitatively different in the two subtypes (Fig. 7C) (p < 0.01, Kolmogorov–Smirnov test). Collaterals of CTh cells were mainly in the upper two-thirds of L1 (L1a), while those of L5 PRC-projecting cells extended widely in the lower half to one-third of L1 (L1b) and in L2/3a. Innervation around the L1-L2/3 border was denser for L5 PRC-projecting cells (Fig. 7C). These axonal arborization differences may affect the subtype-specific backward connection.
Figure 7.

Axonal branching patterns in superficial sublayers of L5 PRC-projecting and CTh cells. A, B, Axon reconstructions of a L5 PRC-projecting cell (A) and a CTh cell (B). Arrowhead, Soma location; x, cutting end of axon caused by slice preparation. Note that L5 PRC-projecting cells often had the axon that returned from L1 to L2/3 (colored branches), but that was rarely found in CTh cells. C, Axon length distribution of L5 PRC-projecting (red, n = 25) and CTh (blue, n = 18) cells within superficial sublayers. Cortical depth was normalized by L1 thickness in individual preparations. 0, Cortical surface; thin lines, individual axons; thick lines, mean ± SD for L5 PRC-projecting and CTh cells. The axonal length distributions were different between the two types (p < 0.01, Kolmogorov–Smirnov test). Asterisks indicate significant differences between L5 PRC-projecting and CTh cells in each bin (p < 0.05, Mann–Whitney U test).
Axo-dendritic contacts in the three connection types
To test for dendritic domain preferences in synaptic connections, we mapped axo-dendritic contacts of connected pairs along postsynaptic dendrites (Figs. 6A–D, 8A) and according to depth from the pia (Fig. 8B). Axons of L2/3 PRC-projecting cells made contacts mainly onto apical oblique branches and basal dendrites of both L5 subtypes, with most being within 300 μm from the postsynaptic soma [mean distance from the soma origin to contacts, 154 ± 94 μm for connections from L2/3 PRC-projecting cells to L5 PRC-projecting cells (13 sites in three connections) (Fig. 8A, left); 217 ± 154 μm for connections from L2/3 PRC-projecting cells to CTh cells (7 sites in three connections) (Fig. 8A, middle)]. Contacts were distributed mainly around the L2/3-L5 border [contact depth from the pia, 530 ± 128 μm for connections from L2/3 PRC-projecting cells to L5 PRC-projecting cells (Fig. 8B, left); 419 ± 142 μm for connections from L2/3 PRC-projecting cells to CTh cells (Fig. 8B, middle)]. Both the mean distances and depths were not significantly different between these two connections (p = 0.53 and 0.07, respectively), suggesting that feedforward interlaminar connections from L2/3a may be formed on similar dendritic domains of L5a cells regardless of postsynaptic cell subtype.
Figure 8.

Axo-dendritic contacts and approaches in three types of connections. A, B, Contacts and the postsynaptic dendrite length distributions along dendritic distance from soma (A) and along the cortical laminae (B). Black line, Dendritic length per 25 μm bin of distance for apical dendrites; gray line, that for basal dendrites; filled arrowhead, contact on apical dendrite; open arrowhead, that on basal dendrite. Left, Connections from L2/3 PRC-projecting cells (PRC) to L5 PRC-projecting cells; middle, that from L2/3 PRC-projecting cells to CTh cells; right, that from L5 PRC-projecting cells to L2/3 PRC-projecting cells. Three cases are shown in individual connections. Most contacts of L2/3 PRC-projecting cell axons onto L5 PRC-projecting and CTh cells distributed around the L2/3-L5 border (bottom dashed line in B, 475 ± 25 μm from pia, n = 7), while contacts of L5 PRC-projecting cell axons to L2/3 PRC-projecting cells were found around the L1-L2/3 border (top dashed line in B, 150 ± 9 μm from pia, n = 7). Gray zone, Sublayer more immunopositive for VGLUT2 (top, L1a; bottom, L2/3b). Note that ascending axons of L5 PRC-projecting cells ramified densely around the L1-L2/3 border compared with those of CTh cells, shown in Figure 7. C, Distance distributions of contacts and approaches along the cortical depth. Approach, Postsynaptic dendritic location where presynaptic axon came close within 2.5 μm (center-to-center). Left, Connections from L2/3 PRC-projecting cell to L5 PRC-projecting cell (n = 3); middle, that from L2/3 PRC-projecting cell to CTh cell (n = 3); right, that from L5 PRC-projecting cell to L2/3 PRC-projecting cell (n = 3). Note that contacts and approaches were similarly distributed.
According to the previous study, contacts in L5–L5 pyramidal cell connections seem to be formed depending on how often presynaptic axons and postsynaptic dendrites come close to within 2.5 μm between the centers of neurites (Morishima and Kawaguchi, 2006); that is, the number of approaches may represent the extent of potential contacts. We examined approach distributions along both the postsynaptic dendrites and cortical depth (Fig. 8C). Approaches in connections from L2/3 PRC-projecting cells to L5 PRC-projecting cells were 108 ± 89 μm in dendritic distance and 527 ± 107 μm in cortical depth (n = 46). Those from L2/3 PRC-projecting cells to CTh cells were 243 ± 191 μm in dendritic distance and 449 ± 193 μm in cortical depth (n = 22). In these cortical depths, L5 PRC-projecting and CTh cells developed basal dendrites and apical dendritic branches close to the soma. Contact and approach distributions were similar in two types of L2/3 to L5 connections (p = 0.06 in dendritic length and p = 0.97 in depth for connections to L5 PRC-projecting cell; p = 0.83 in dendritic length and p = 0.42 in depth for connections to CTh cells; Kolmogorov–Smirnov test). The similar distributions of contacts and approaches indicate that axonal arborizations of L2/3 PRC-projecting cell axons at specific cortical depth may produce input domain specificity in L5 pyramidal cells. Although contact and approach distributions were not significantly different in L2/3-to-L5 connections, some approaches were found in L1 in connections to CTh cells (Fig. 8C, middle). We may miss another type connection in which L2/3 PRC-projecting cells would innervate the apical tufts of L5 CTh cells due to their longer electrotonic distances. Otherwise, L2/3 PRC-projecting cell axons may avoid making synapses at the CTh cell tufts actively.
Ascending connections from L5 PRC-projecting cells to L2/3 PRC-projecting cells made contacts onto the apical branches and basal dendrites in L1b and L2/3a [dendritic distance, 92 ± 69 μm; cortical depth, 192 ± 79 μm (nine sites in three connections)] (Fig. 8B, right). These locations corresponded to the cortical sublayers where ascending axon branches of L5 PRC-projecting cells were well arborized (Fig. 7C). Similar to L2/3-to-L5 feedforward connections, most contacts from L5 to L2/3 were onto dendritic regions close to the soma (eight of nine contacts were within 200 μm from soma) (Fig. 8A, right). Contact and approach distributions were similar in both dendritic length and cortical depth (91 ± 69 μm in dendritic length, p = 1; 197 ± 77 μm in depth, p = 1; n = 17, Kolmogorov–Smirnov test). These data indicate that interlaminar connections are connected by synapses made preferentially onto the dendritic domains close to the soma.
Homogeneity of L2/3 PRC-projecting cells connected with L5 pyramidal cell subtypes
We next investigated whether L2/3 PRC-projecting cells were differentiated according to their synaptic connections with L5 PRC-projecting and CTh cells. Dendritic morphologies of L2/3 PRC-projecting cells were variable, ranging from those without obvious apical shafts to cells with prominent apical dendrites (Fig. 9A). The former type was often found at the L1-L2/3 border (van Brederode et al., 2000). However, diverse dendritic patterns and soma positions were found to be uncorrelated with connection patterns with L5 cells. Somatic depths from the pia were 205 ± 58 μm for L2/3 PRC-projecting cells innervating L5 PRC-projecting cells (range, 125–321 μm; n = 10), 194 ± 43 μm for L2/3 PRC-projecting cells innervating CTh cells (range, 143–275 μm; n = 10), and 230 ± 87 μm for L2/3 PRC-projecting cells receiving input from L5 PRC-projecting cells (range, 149–321 μm; n = 3; p = 0.41, ANOVA).
Figure 9.
Morphological and electrophysiological properties of L2/3 PRC-projecting cells. A, Dendritic reconstructions (left and middle) and representative repetitive firing responses against depolarizing current injection (right) of L2/3 PRC-projecting cells. Insets, Presynaptic spikes and averaged EPSCs (left, on L5 PRC-projecting cell; middle, on CTh cell). Note that L2/3 PRC-projecting cells had a variety of dendritic morphologies, especially in the apical dendrite. B, Plots of firing frequencies against the somatic injected current in L2/3 PRC-projecting cells: top, first ISI firing frequency against the current intensity; bottom, third and last ISI firing frequencies against the current intensity. C, Relationship of the maximum first f-I slope and constant firing index. D, Relationship of the mean horizontal and vertical extents of the basal dendrite measured from the soma. E, Relationship between the apical tuft area within L1 and depth of apical tuft origin of L2/3 PRC-projecting cells. L2/3 PRC-projecting cells were divided into four groups according to the synaptic connection partner: red open circle, unidirectional connection to L5 PRC-projecting cells (PRC); blue open circle, unidirectional connection to CTh cells; red filled triangle, unidirectional connection from L5 PRC-projecting cells; red filled circle, reciprocally connected with L5 PRC-projecting cells. Gray diamonds and crosses showed the mean ± SD obtained from L5 PRC-projecting and CTh cells, respectively (same data as in Fig. 5E–G; see Table 1 for comparison of three subtypes). These physiological and morphological parameters of L2/3 PRC-projecting cells were not correlated with connection patterns with L5 cells. r.m.p., Resting membrane potential.
L2/3 PRC-projecting cells were situated in the superficial calbindin-positive zone [140 ± 12 μm to 433 ± 46 μm from the pia (seven sections)] (Fig. 3B). Since the L2/3a-L2/3b border that defined by VGLUT2 immunoreactivity was ∼250 μm from the pia (see Materials and Methods), L2/3 PRC-projecting cells are positive for calbindin and locate mostly in L2/3a (Fig. 3B).
Mean horizontal and vertical extents of basal dendrites, locations of apical tuft origins, and total tuft area for L2/3 PRC-projecting cells were also independent of synaptic connectivity pattern [p = 0.83, 0.68, 0.75, 0.62 (ANOVA between three connection patterns, respectively)] (Fig. 9D,E). The basal dendritic field of L2/3 PRC-projecting cells was more compact than that found in L5 subtypes, but the apical tuft of L2/3 PRC-projecting cells was as well developed as those of CTh cells (Fig. 9D,E; Table 1).
The firing pattern of L2/3 PRC-projecting cells was found to be nonbursting (Fig. 9A, right), as indicated by the smaller maximum first f-I slope found to be similar to L5 PRC-projecting cells, but smaller than that of CTh cells (Table 1). On the other hand, spike frequency adaptation of L2/3 PRC-projecting cells was weaker than that found in L5 PRC-projecting cells, but stronger than in CTh cells (Fig. 9C; Table 1). The firing patterns of L2/3 PRC-projecting cells were not dependent on synaptic connectivity with the L5 neurons (maximum first f-I slope and constant firing index, p = 0.35 and 0.37, respectively, ANOVA).
Discussion
We found that distal connections from the frontal cortex to perirhinal cortex segregate into multiple channels involving neurons in specific cortical sublaminae specialized in their electrophysiological properties, dendritic morphologies, and extracortical projection targets. L2/3 PRC-projecting cells project mainly to area 35 of the perirhinal cortex, with a subgroup also sending axons to the amygdala (Fig. 10). On the other hand, L5 PRC-projecting cells project mainly to area 36, and overlap with CCS cells, but do not include CPn or CTh cells (Fig. 10). These observations suggest that specific neocortico-perirhinal channels differentially regulate other subsystems.
Figure 10.

Schematic representation of local/distal circuits and layer distributions of projection subtypes of frontal cortical neurons revealed in this study. A, Interlaminar connections and efferent projections of PRC-projecting cells and CTh cells. The fronto-perirhinal projection incorporates two pathways originating from L2/3 cells innervating the rostral part of perirhinal area 35 (L2/3 PRC-projecting cells) and from L5 cells innervating rostral part of perirhinal area 36 (L5 PRC-projecting cells). A subgroup of L2/3 PRC-projecting cells simultaneously sends axons to the amygdala (dashed line). L5 PRC-projecting cells also innervate both sides of the striatum (CCS cells) and are distinct from CTh cells, which send axons to the pons (CPn cells). Within the frontal cortex, ascending axon branches of L5 PRC-projecting cells are mainly innervating L1b and L2/3a, whereas those of CTh cells are innervating L1a. The axon collaterals of L2/3 PRC-projecting cells come at L1b, but not often at L1a, like those of L5 PRC-projecting cells. The L2/3 PRC-projecting group sends feedforward excitation to both L5 PRC-projecting and CTh cells, but the backward connection only occurs from L5 PRC-projecting cells. L5 PRC-projecting cells are assumed to send excitation unidirectionally to CTh cells (inferred from Morishima and Kawaguchi, 2006; the arrow with asterisk). B, Multiple projection subtypes are distributed in same layers of M2. Solid and dashed lines indicate qualitatively higher and lower density of individual projection types, respectively. L2/3a includes amygdala-projecting and PRC-projecting cells, and L5 includes PRC-projecting, CTh, CCS, and CPn cells. L5 PRC-projecting and CTh cells are located mainly in L5a. L6 includes PRC-projecting, CCS, and CTh cells. L6 CCS cells mostly locate in the upper part. C, Perirhinal cortex is composed of excitatory forward connection from area 36 to 35 (marked with †; Burwell and Amaral, 1998a). Note that L2/3 PRC-projecting cells make forward connections to L5 PRC-projecting cells but also innervate the downstream site of perirhinal cortex, area 35. In addition to the two direct projection channels from the frontal to perirhinal cortex, note an indirect pathway from L2/3 PRC-projecting cells by way of the amygdala (marked with ‡; Furtak et al., 2007).
In regard to local connections, we found two forward connections from L2/3 PRC-projecting cells with similar connection probabilities and EPSC properties regardless of the postsynaptic neuron subtypes, L5 PRC-projecting or CTh cells. On the other hand, backward connections from L5 to L2/3 were found exclusively between PRC-projecting cell subtypes (Fig. 10). Axonal arborizations of L5 PRC-projecting and CTh cells were also different in superficial layers. These observations suggest that the connectional selectivity of interlaminar feedback loops depends on the L5 projection subtype.
The laminar distribution of pyramidal cells projecting to other neocortical areas represents a functional areal hierarchy (Shipp, 2007). This study revealed that multiple neocortical sublaminae contain pyramidal cells projecting to the perirhinal cortex, but that these neurons exhibit selective extracortical and intracortical connections based on their laminae of origin. Thus, corticocortical cells in different layers have distinct intracortical connectivity and subcortical projection patterns.
Pyramidal cell subtyping on the basis of extracortical projection sites
Correlation of firing patterns and morphological characteristics of neocortical pyramidal cells according to extracortical projection targets has been described in the somatosensory (Hattox and Nelson, 2007; Le Bé et al., 2007), frontal (Morishima and Kawaguchi, 2006; Otsuka and Kawaguchi, 2008, 2011), and visual cortices (Kasper et al., 1994; Christophe et al., 2005; Brown and Hestrin, 2009). The three projection subtypes investigated here also differed in their electrophysiological and morphological properties. PRC-projecting cells responded linearly during tonic depolarization, whereas CTh cells showed more nonlinear frequency increases during phasic depolarization and more regular tonic firing. The apical tufts on pyramidal neurons are positioned to receive excitation from other cortical regions and thalamic nuclei, while basal dendrites and apical oblique branches close to the soma are innervated by nearby pyramidal cells (Fig. 8) (Morishima and Kawaguchi, 2006; Petreanu et al., 2009; Morishima et al., 2011). The dendritic morphology of individual projection subtypes may specify the recipient territories for distant and local excitatory inputs, or vice versa.
In the frontal cortex, L5 (both L5a and L5b) contains two major pyramidal cell subtypes that form corticostriatal projections: CCS cells innervating the bilateral striatum and CPn cells innervating only the ipsilateral striatum. In L5a, PRC-projecting cells are overlapped with CCS cells, while CTh cells are overlapped with CPn cells. These results suggest that crossed corticostriatal and corticopontine projections are further differentiated in relation to the cortico-parahippocampal and corticothalamic outputs, respectively.
Selective intracortical interactions between perirhinal and subcortical projection systems in frontal cortex
Feedforward excitation from L2/3 PRC-projecting cells went to both L5 PRC-projecting and CTh cells, but backward connection to L2/3 PRC-projecting cells was found only in pairs of L2/3 and L5 PRC-projecting cells. The excitatory connection from upper L5 to upper L2/3 has been established in primary motor, and primary and secondary somatosensory areas (Shepherd and Svoboda, 2005; Bureau et al., 2006; Weiler et al., 2008; Lefort et al., 2009; Hooks et al., 2011). In frontal cortex, backward connection from L5 to L2/3 PRC-projecting cells shows lower connection probability and somewhat smaller and more variable EPSCs than forward connections (Table 2). The synaptic strength at individual connections may depend on the L2/3 pyramidal neuron subtype. In the barrel cortex, L5a to L2/3 excitation was stronger in L2 pyramidal neurons in septa compared with those in barrels (Shepherd and Svoboda, 2005). These data suggest that interlaminar feedback connections may be more selective than feedforward connections (Thomson and Lamy, 2007). In L2/3 PRC-projecting cells, we could not find any dependency of dendritic morphologies and firing characteristics on their L5 connection partners. Since PRC-projecting cells are heterogeneous in projections to amygdala, their differentiation depending on extracortical innervation patterns remains to be investigated.
Presynaptic axon contacts to postsynaptic dendrites in interlaminar connections between L2/3a and L5a cells were shown to be distributed mainly around the border of L1-L2/3 and L2/3-L5, near the postsynaptic cell somata positioned. Because nearby connections between L5 pyramidal subtypes (CCS/CCS, CCS/CPn, and CPn/CPn) also make contacts on apical oblique branches and basal dendrite close to soma (Morishima and Kawaguchi, 2006; Morishima et al., 2011), which is similar to what investigated here, local connections between pyramidal cells may consist of innervations targeting dendritic domains close to soma, regardless of pyramidal subtypes.
Short-term synaptic plasticity may depend mainly on the presynaptic pyramidal subtype (Morishima et al., 2011). EPSCs from L2/3 PRC-projecting cells were less depressed regardless of postsynaptic cell types, suggesting reliable feedforward transmission from L2/3a to L5a. EPSCs from L5 PRC-projecting cells showed small paired-pulse depression, which was supportive of the idea that L5 PRC-projecting and CCS cells belong to the same pyramidal group (Morishima et al., 2011).
L5 CTh cells mainly innervated L1a, whereas L5 PRC-projecting cells innervated L1b (Fig. 10). In L1, there are GABAergic neurons, which have horizontal axonal arbors and extend dendrites in a sublamina-specific manner (Kubota et al., 2011). This suggests that L1 local inhibition may be differentially driven by specific types of excitatory inputs from L5 pyramidal neurons and thalamic nuclei: GABAergic neurons in L1a receiving inputs from the thalamic matrix (Jones, 2001, 2007) and L5 CTh cells, and GABAergic neurons in L1b receiving inputs from L5 PRC-projecting cells.
Multiple neocortico–perirhinal connection channels
Within perirhinal cortex, associative memory is hierarchically processed from area 36 to area 35 (Fujimichi et al., 2010). The excitatory transfer from area 36 to area 35 is regulated by GABAergic feedforward inhibition to area 35 (Pelletier et al., 2004), which is reduced by acetylcholine acting on GABAergic axon terminals (Apergis-Schoute et al., 2007). Acetylcholine increase in waking may enhance excitatory transfer from L5 PRC-projecting cells in frontal cortex to area 35 through area 36, whereas acetylcholine decrease in slow-wave sleep may reduce the transmission through area 36, but relatively facilitate the transfer from L2/3 PRC-projecting cells to area 35 and ultimately to the entorhinal cortex. Thus, two routes from the frontal cortex to perirhinal cortex may be differentially gated in a brain state-dependent manner (Apergis-Schoute et al., 2007).
The amygdala is reciprocally connected with the perirhinal cortex (Pitkänen et al., 2000; Furtak et al., 2007), and it may function to enhance declarative memory formation for emotionally arousing events (Cahill and McGaugh, 1998). Simultaneous excitation of the perirhinal cortex and amygdala promotes the propagation of area 35 activity to the entorhinal cortex (Kajiwara et al., 2003), suggesting that convergent excitation from the amygdala and neocortex is critical for transmission from the perirhinal cortex to the hippocampus (de Curtis and Paré, 2004). In M2 analyzed here, PRC-projecting cells innervated the rostral part of perirhinal cortex. Amygdala-projecting cells in L2/3a, partly belonging to L2/3 PRC-projecting cells, principally innervate the basal nucleus and accessory basal nucleus of the amygdala (Gabbott et al., 2005). Amygdala neurons in these nuclei project preferentially to the rostral part of perirhinal cortex (Pikkarainen and Pitkänen, 2001). These inter-regional connections may be involved in gating the inputs from the frontal cortex to hippocampus. In this study, we found reciprocal connections of L2/3 and L5 PRC-projecting cells. These data suggest that L5 PRC-projecting cell outputs to the hippocampus through the perirhinal cortex may be controlled by the interaction of specific L2/3 and L5 PRC-projecting cell pairs (Fig. 10).
The higher motor-related areas modulate activity in the primary motor cortex by direct corticocortical, basal ganglia-thalamocortical, and cerebello-thalamocortical connections (Middleton and Strick, 2000). The basal ganglia are involved in selection of motor patterns and their temporal sequences using reinforcement learning (Graybiel, 2008). Projections of single L5 PRC-projecting cells to both the perirhinal cortex and striatum suggest an intimate relationship between declarative memory formation and reinforcement learning. The L5 projection subtypes and their further differentiation according to their depth may provide independent channels for the transfer of information between discrete cortical and basal ganglia subsystems (Gerfen, 1992; Bolam et al., 2000; Lei et al., 2004; Morishima and Kawaguchi, 2006, Morishima et al., 2011).
It has been previously shown that frontal L5 projection subtypes are unidirectionally connected from CCS to CPn cells (Morishima and Kawaguchi, 2006), indicating preferential connections from L5 PRC-projecting to CTh cells (Fig. 10). Based on their projection patterns, L5 PRC-projecting cells likely contribute to declarative memory formation and reinforcement learning through interactions with the perirhinal cortex and striatum, whereas L5 CTh cells, sending outputs to the cerebellum through the pons, may be involved in supervised learning of procedural memory. Based on our observations showing that frontal pyramidal cells are diversified and connected in direction-dependent manners according to their projection targets, we propose that the frontal cortex is hierarchically organized consisting of subnetworks involved in distinct memory and learning systems.
Footnotes
This work was supported by Japan Science and Technology Agency, CREST, Grant-in-Aids for Scientific Research from the Ministry of Education, Culture, Sports, Science, and Technology, and Research Fellowship of the Japan Society for the Promotion of Science. We thank to Drs. Yoshifumi Ueta and Naoki Shigematsu for help of the tracer experiment, and Allan Gulledge for helpful comments on the manuscript.
References
- Anderson CT, Sheets PL, Kiritani T, Shepherd GM. Sublayer-specific microcircuits of corticospinal and corticostriatal neurons in motor cortex. Nat Neurosci. 2010;13:739–744. doi: 10.1038/nn.2538. [DOI] [PMC free article] [PubMed] [Google Scholar]
- Apergis-Schoute J, Pinto A, Paré D. Muscarinic control of long-range GABAergic inhibition within the rhinal cortices. J Neurosci. 2007;27:4061–4071. doi: 10.1523/JNEUROSCI.0068-07.2007. [DOI] [PMC free article] [PubMed] [Google Scholar]
- Bolam JP, Hanley JJ, Booth PA, Bevan MD. Synaptic organisation of the basal ganglia. J Anat. 2000;196:527–542. doi: 10.1046/j.1469-7580.2000.19640527.x. [DOI] [PMC free article] [PubMed] [Google Scholar]
- Brown SP, Hestrin S. Intracortical circuits of pyramidal neurons reflect their long-range axonal targets. Nature. 2009;457:1133–1136. doi: 10.1038/nature07658. [DOI] [PMC free article] [PubMed] [Google Scholar]
- Bureau I, von Saint Paul F, Svoboda K. Interdigitated paralemniscal and lemniscal pathways in the mouse barrel cortex. PLoS Biol. 2006;4:e382. doi: 10.1371/journal.pbio.0040382. [DOI] [PMC free article] [PubMed] [Google Scholar]
- Burwell RD. Borders and cytoarchitecture of the perirhinal and postrhinal cortices in the rat. J Comp Neurol. 2001;437:17–41. doi: 10.1002/cne.1267. [DOI] [PubMed] [Google Scholar]
- Burwell RD, Amaral DG. Perirhinal and postrhinal cortices of the rat: interconnectivity and connections with the entorhinal cortex. J Comp Neurol. 1998a;391:293–321. doi: 10.1002/(sici)1096-9861(19980216)391:3<293::aid-cne2>3.0.co;2-x. [DOI] [PubMed] [Google Scholar]
- Burwell RD, Amaral DG. Cortical afferents of the perirhinal, postrhinal, and entorhinal cortices of the rat. J Comp Neurol. 1998b;398:179–205. doi: 10.1002/(sici)1096-9861(19980824)398:2<179::aid-cne3>3.0.co;2-y. [DOI] [PubMed] [Google Scholar]
- Burwell RD, Witter MP, Amaral DG. Perirhinal and postrhinal cortices of the rat: a review of the neuroanatomical literature and comparison with findings from the monkey brain. Hippocampus. 1995;5:390–408. doi: 10.1002/hipo.450050503. [DOI] [PubMed] [Google Scholar]
- Cahill L, McGaugh JL. Mechanisms of emotional arousal and lasting declarative memory. Trends Neurosci. 1998;21:294–299. doi: 10.1016/s0166-2236(97)01214-9. [DOI] [PubMed] [Google Scholar]
- Christophe E, Doerflinger N, Lavery DJ, Molnár Z, Charpak S, Audinat E. Two populations of layer V pyramidal cells of the mouse neocortex: development and sensitivity to anesthetics. J Neurophysiol. 2005;94:3357–3367. doi: 10.1152/jn.00076.2005. [DOI] [PubMed] [Google Scholar]
- Cowan RL, Wilson CJ. Spontaneous firing patterns and axonal projections of single corticostriatal neurons in the rat medial agranular cortex. J Neurophysiol. 1994;71:17–32. doi: 10.1152/jn.1994.71.1.17. [DOI] [PubMed] [Google Scholar]
- de Curtis M, Paré D. The rhinal cortices: a wall of inhibition between the neocortex and the hippocampus. Prog Neurobiol. 2004;74:101–110. doi: 10.1016/j.pneurobio.2004.08.005. [DOI] [PubMed] [Google Scholar]
- Deschênes M, Bourassa J, Pinault D. Corticothalamic projections from layer V cells in rat are collaterals of long-range corticofugal axons. Brain Res. 1994;664:215–219. doi: 10.1016/0006-8993(94)91974-7. [DOI] [PubMed] [Google Scholar]
- Eichenbaum H. Remembering: functional organization of the declarative memory system. Curr Biol. 2006;16:R643–R645. doi: 10.1016/j.cub.2006.07.026. [DOI] [PubMed] [Google Scholar]
- Fujimichi R, Naya Y, Koyano KW, Takeda M, Takeuchi D, Miyashita Y. Unitized representation of paired objects in area 35 of the macaque perirhinal cortex. Eur J Neurosci. 2010;32:659–667. doi: 10.1111/j.1460-9568.2010.07320.x. [DOI] [PubMed] [Google Scholar]
- Furtak SC, Wei SM, Agster KL, Burwell RD. Functional neuroanatomy of the parahippocampal region in the rat: the perirhinal and postrhinal cortices. Hippocampus. 2007;17:709–722. doi: 10.1002/hipo.20314. [DOI] [PubMed] [Google Scholar]
- Gabbott PL, Warner TA, Jays PR, Salway P, Busby SJ. Prefrontal cortex in the rat: projections to subcortical autonomic, motor, and limbic centers. J Comp Neurol. 2005;492:145–177. doi: 10.1002/cne.20738. [DOI] [PubMed] [Google Scholar]
- Gao WJ, Zheng ZH. Target-specific differences in somatodendritic morphology of layer V pyramidal neurons in rat motor cortex. J Comp Neurol. 2004;476:174–185. doi: 10.1002/cne.20224. [DOI] [PubMed] [Google Scholar]
- Gerfen CR. The neostriatal mosaic: multiple levels of compartmental organization in the basal ganglia. Annu Rev Neurosci. 1992;15:285–320. doi: 10.1146/annurev.ne.15.030192.001441. [DOI] [PubMed] [Google Scholar]
- Glimcher PW. Understanding dopamine and reinforcement learning: the dopamine reward prediction error hypothesis. Proc Natl Acad Sci U S A. 2011;108(Suppl 3):15647–15654. doi: 10.1073/pnas.1014269108. [DOI] [PMC free article] [PubMed] [Google Scholar]
- Graybiel AM. Habits, rituals, and the evaluative brain. Annu Rev Neurosci. 2008;31:359–387. doi: 10.1146/annurev.neuro.29.051605.112851. [DOI] [PubMed] [Google Scholar]
- Hattox AM, Nelson SB. Layer V neurons in mouse cortex projecting to different targets have distinct physiological properties. J Neurophysiol. 2007;98:3330–3340. doi: 10.1152/jn.00397.2007. [DOI] [PubMed] [Google Scholar]
- Hooks BM, Hires SA, Zhang YX, Huber D, Petreanu L, Svoboda K, Shepherd GM. Laminar analysis of excitatory local circuits in vibrissal motor and sensory cortical areas. PLoS Biol. 2011;9:e1000572. doi: 10.1371/journal.pbio.1000572. [DOI] [PMC free article] [PubMed] [Google Scholar]
- Ito M. The cerebellum: brain for an implicit self. New Jersey: FT; 2011. [Google Scholar]
- Jones EG. The thalamic matrix and thalamocortical synchrony. Trends Neurosci. 2001;24:595–601. doi: 10.1016/s0166-2236(00)01922-6. [DOI] [PubMed] [Google Scholar]
- Jones EG. The thalamus. Ed 2. Cambridge, UK: Cambridge UP; 2007. [Google Scholar]
- Kajiwara R, Takashima I, Mimura Y, Witter MP, Iijima T. Amygdala input promotes spread of excitatory neural activity from perirhinal cortex to the entorhinal-hippocampal circuit. J Neurophysiol. 2003;89:2176–2184. doi: 10.1152/jn.01033.2002. [DOI] [PubMed] [Google Scholar]
- Karube F, Kubota Y, Kawaguchi Y. Axon branching and synaptic bouton phenotypes in GABAergic nonpyramidal cell subtypes. J Neurosci. 2004;24:2853–2865. doi: 10.1523/JNEUROSCI.4814-03.2004. [DOI] [PMC free article] [PubMed] [Google Scholar]
- Kasper EM, Larkman AU, Lübke J, Blakemore C. Pyramidal neurons in layer 5 of the rat visual cortex. I. Correlation among cell morphology, intrinsic electrophysiological properties, and axon targets. J Comp Neurol. 1994;339:459–474. doi: 10.1002/cne.903390402. [DOI] [PubMed] [Google Scholar]
- Kubota Y, Shigematsu N, Karube F, Sekigawa A, Kato S, Yamaguchi N, Hirai Y, Morishima M, Kawaguchi Y. Selective coexpression of multiple chemical markers defines discrete populations of neocortical GABAergic neurons. Cereb Cortex. 2011;21:1803–1817. doi: 10.1093/cercor/bhq252. [DOI] [PubMed] [Google Scholar]
- Le Bé JV, Silberberg G, Wang Y, Markram H. Morphological, electrophysiological, and synaptic properties of corticocallosal pyramidal cells in the neonatal rat neocortex. Cereb Cortex. 2007;17:2204–2213. doi: 10.1093/cercor/bhl127. [DOI] [PubMed] [Google Scholar]
- Lefort S, Tomm C, Floyd Sarria JC, Petersen CC. The excitatory neuronal network of the C2 barrel column in mouse primary somatosensory cortex. Neuron. 2009;61:301–316. doi: 10.1016/j.neuron.2008.12.020. [DOI] [PubMed] [Google Scholar]
- Lei W, Jiao Y, Del Mar N, Reiner A. Evidence for differential cortical input to direct pathway versus indirect pathway striatal projection neurons in rats. J Neurosci. 2004;24:8289–8299. doi: 10.1523/JNEUROSCI.1990-04.2004. [DOI] [PMC free article] [PubMed] [Google Scholar]
- Levesque M, Charara A, Gagnon S, Parent A, Deschenes M. Corticostriatal projections from layer V cells in rat are collaterals of long-range corticofugal axons. Brain Res. 1996;709:311–315. doi: 10.1016/0006-8993(95)01333-4. [DOI] [PubMed] [Google Scholar]
- Mcdonald AJ, Mascagni F, Guo L. Projections of the medial and lateral prefrontal cortices to the amygdala: a Phaseolus vulgaris leucoagglutinin study in the rat. Neuroscience. 1996;71:55–75. doi: 10.1016/0306-4522(95)00417-3. [DOI] [PubMed] [Google Scholar]
- Middleton FA, Strick PL. Basal ganglia and cerebellar loops: motor and cognitive circuits. Brain Res Brain Res Rev. 2000;31:236–250. doi: 10.1016/s0165-0173(99)00040-5. [DOI] [PubMed] [Google Scholar]
- Miller EK, Cohen JD. An integrative theory of prefrontal cortex function. Annu Rev Neurosci. 2001;24:167–202. doi: 10.1146/annurev.neuro.24.1.167. [DOI] [PubMed] [Google Scholar]
- Miyashita Y. Cognitive memory: cellular and network machineries and their top-down control. Science. 2004;306:435–440. doi: 10.1126/science.1101864. [DOI] [PubMed] [Google Scholar]
- Morishima M, Kawaguchi Y. Recurrent connection patterns of corticostriatal pyramidal cells in frontal cortex. J Neurosci. 2006;26:4394–4405. doi: 10.1523/JNEUROSCI.0252-06.2006. [DOI] [PMC free article] [PubMed] [Google Scholar]
- Morishima M, Morita K, Kubota Y, Kawaguchi Y. Highly differentiated projection-specific cortical subnetworks. J Neurosci. 2011;31:10380–10391. doi: 10.1523/JNEUROSCI.0772-11.2011. [DOI] [PMC free article] [PubMed] [Google Scholar]
- Otsuka T, Kawaguchi Y. Firing-pattern-dependent specificity of cortical excitatory feed-forward subnetworks. J Neurosci. 2008;28:11186–11195. doi: 10.1523/JNEUROSCI.1921-08.2008. [DOI] [PMC free article] [PubMed] [Google Scholar]
- Otsuka T, Kawaguchi Y. Cell diversity and connection specificity between callosal projection neurons in the frontal cortex. J Neurosci. 2011;31:3862–3870. doi: 10.1523/JNEUROSCI.5795-10.2011. [DOI] [PMC free article] [PubMed] [Google Scholar]
- Paxinos G, Watson C. The rat brain in stereotaxic coordinates. Ed 6. San Diego: Academic; 2007. [DOI] [PubMed] [Google Scholar]
- Pelletier JG, Apergis J, Paré D. Low-probability transmission of neocortical and entorhinal impulses through the perirhinal cortex. J Neurophysiol. 2004;91:2079–2089. doi: 10.1152/jn.01197.2003. [DOI] [PubMed] [Google Scholar]
- Petreanu L, Mao T, Sternson SM, Svoboda K. The subcellular organization of neocortical excitatory connections. Nature. 2009;457:1142–1145. doi: 10.1038/nature07709. [DOI] [PMC free article] [PubMed] [Google Scholar]
- Pikkarainen M, Pitkänen A. Projections from the lateral, basal and accessory basal nuclei of the amygdala to the perirhinal and postrhinal cortices in rat. Cereb Cortex. 2001;11:1064–1082. doi: 10.1093/cercor/11.11.1064. [DOI] [PubMed] [Google Scholar]
- Pitkänen A, Pikkarainen M, Nurminen N, Ylinen A. Reciprocal connections between the amygdala and the hippocampal formation, perirhinal cortex, and postrhinal cortex in rat. A review. Ann N Y Acad Sci. 2000;911:369–391. doi: 10.1111/j.1749-6632.2000.tb06738.x. [DOI] [PubMed] [Google Scholar]
- Reiner A, Jiao Y, Del Mar N, Laverghetta AV, Lei WL. Differential morphology of pyramidal tract-type and intratelencephalically projecting-type corticostriatal neurons and their intrastriatal terminals in rats. J Comp Neurol. 2003;457:420–440. doi: 10.1002/cne.10541. [DOI] [PubMed] [Google Scholar]
- Sah P, Faber ES, Lopez De Armentia M, Power J. The amygdaloid complex: anatomy and physiology. Physiol Rev. 2003;83:803–834. doi: 10.1152/physrev.00002.2003. [DOI] [PubMed] [Google Scholar]
- Schultz W, Dayan P, Montague PR. A neural substrate of prediction and reward. Science. 1997;275:1593–1599. doi: 10.1126/science.275.5306.1593. [DOI] [PubMed] [Google Scholar]
- Shepherd GM, Svoboda K. Laminar and columnar organization of ascending excitatory projections to layer 2/3 pyramidal neurons in rat barrel cortex. J Neurosci. 2005;25:5670–5679. doi: 10.1523/JNEUROSCI.1173-05.2005. [DOI] [PMC free article] [PubMed] [Google Scholar]
- Shipp S. Structure and function of the cerebral cortex. Curr Biol. 2007;17:R443–R449. doi: 10.1016/j.cub.2007.03.044. [DOI] [PubMed] [Google Scholar]
- Smith EE, Jonides J. Storage and executive processes in the frontal lobes. Science. 1999;283:1657–1661. doi: 10.1126/science.283.5408.1657. [DOI] [PubMed] [Google Scholar]
- Thomson AM, Lamy C. Functional maps of neocortical local circuitry. Front Neurosci. 2007;1:19–42. doi: 10.3389/neuro.01.1.1.002.2007. [DOI] [PMC free article] [PubMed] [Google Scholar]
- van Brederode JF, Foehring RC, Spain WJ. Morphological and electrophysiological properties of atypically oriented layer 2 pyramidal cells of the juvenile rat neocortex. Neuroscience. 2000;101:851–861. doi: 10.1016/s0306-4522(00)00430-9. [DOI] [PubMed] [Google Scholar]
- Weiler N, Wood L, Yu J, Solla SA, Shepherd GM. Top-down laminar organization of the excitatory network in motor cortex. Nat Neurosci. 2008;11:360–366. doi: 10.1038/nn2049. [DOI] [PMC free article] [PubMed] [Google Scholar]
- Wilson CJ. Morphology and synaptic connections of crossed corticostriatal neurons in the rat. J Comp Neurol. 1987;263:567–580. doi: 10.1002/cne.902630408. [DOI] [PubMed] [Google Scholar]