

Abstract
The developing spinal cord is subdivided into distinct progenitor domains, each of which gives rise to different types of neurons. However, the developmental mechanisms responsible for generating neuronal diversity within a domain are not well understood. Here, we have studied zebrafish V0 neurons, those that derive from the p0 progenitor domain, to address this question. We find that all V0 neurons have commissural axons, but they can be divided into excitatory and inhibitory classes. V0 excitatory neurons (V0-e) can be further categorized into three groups based on their axonal trajectories; V0-eA (ascending), V0-eB (bifurcating), and V0-eD (descending) neurons. By using time-lapse imaging of p0 progenitors and their progeny, we show that inhibitory and excitatory neurons are produced from different progenitors. We also demonstrate that V0-eA neurons are produced from distinct progenitors, while V0-eB and V0-eD neurons are produced from common progenitors. We then use birth-date analysis to reveal that V0-eA, V0-eB, and V0-eD neurons arise in this order. By perturbing Notch signaling and accelerating neuronal differentiation, we predictably alter the generation of early born V0-e neurons at the expense of later born ones. These results suggest that multiple types of V0 neurons are produced by two distinct mechanisms; from heterogeneous p0 progenitors and from the same p0 progenitor, but in a time-dependent manner.
Introduction
Neuronal diversity is a fundamental feature of the nervous system. In the vertebrate spinal cord, the first step toward achieving the diversity observed in adults occurs early in development with the division of neuronal progenitor cells into distinct domains along dorsoventral axis in response to signals emanating from local organizing centers. In the ventral spinal cord, five distinct domains, p3, pMN, p1, and p0 are formed (Goulding and Lamar, 2000; Jessell, 2000). Each domain is thought to produce neurons sharing common features (e.g., axonal trajectories). The next level of complexity arises within each specific domain. For example, the p1 domain in mammals produces ipsilaterally projecting inhibitory neurons with distinct, well identified functions, like Ia and Renshaw cells, as well as other ipsilateral inhibitory neurons whose function has yet to be determined (Sapir et al., 2004; Alvarez et al., 2005). Compared with the earlier step of domain formation, the developmental mechanisms responsible for the complexity arising from within a domain are less understood.
The p0 domain, the most dorsal domain in the ventral spinal cord, is defined by the expression of dbx1 (Pierani et al., 2001). In mice, neurons derived from p0 domain (V0 neurons) are predominantly commissural projecting, consisting of both excitatory and inhibitory neurons (Lanuza et al., 2004), but details about the potential morphological or functional heterogeneity of V0 neurons are not known. Here, we have begun to address this issue by studying V0 neurons in developing zebrafish. We first provide a detailed morphological characterization and classification of V0 neurons. Next, we obtain insight into developmental mechanisms responsible for generating multiple types of V0 neurons using time-lapse imaging and lineage analysis. Lineage analysis is a direct way to obtain insights into developmental mechanisms that has been used successfully in Drosophila (Doe and Technau, 1993; Doe and Skeath, 1996). Currently, information of neuronal lineages from progenitors to their progeny in the developing spinal cord is sparse in amniotes. This is because (1) time-lapse imaging from progenitors is difficult; and (2) detailed information about neuronal types produced has not been available for most of the domains. In addition to lineage analysis, we also investigate whether the time-dependent generation of different types of neurons is involved. This type of neurogenesis occurs in several areas of the developing CNS (Jacob et al., 2008), and thus, the temporal control of neuronal diversity might also be at work in developing spinal cord.
We show that V0 neurons in zebrafish are all commissural neurons consisting both excitatory and inhibitory neurons. Excitatory neurons can be categorized into three different subtypes. Lineage tracing studies demonstrate that excitatory and inhibitory neurons are generated from different progenitors. However, there was time-dependent emergence of the three classes of V0 excitatory neurons. Notably, neurons belonging to one of the classes were produced from distinct progenitors, while the other two classes of neurons were produced from common progenitors. Together, our results show that both heterogeneity among p0 progenitors and time-dependent neurogenesis contribute to the generation of multiple types of V0 neurons.
Materials and Methods
Animals.
Zebrafish adults, embryos and larvae were maintained at 28.5°C. Experiments were performed at room temperature (25–28°C). All procedures were performed in compliance with the guidelines approved by the animal care and use committees of the National Institutes of Natural Sciences. Animals were staged according to hours postfertilization (hpf) or days postfertilization (dpf).
DNA constructs and generation of transgenic fish.
To manipulate bacterial artificial chromosome (BAC) DNA, the BAC homologous recombination technique (Lee et al., 2001) was used. For the GFP construct, the template consists of EGFP, a poly(A) signal from bovine growth hormone (BGH), and a Kanamycin-resistant gene (Kmr) (Kimura et al., 2006). For DsRed and Cre constructs, 0.6 kb of the zebrafish hsp70 promoter (Halloran et al., 2000) was inserted in front of DsRed (or Cre) to enhance the expression level of DsRed (or Cre) in transgenic fish. The template DNA for DsRed constructs consists of hsp, loxP, DsRed, loxP, BGH poly(A), Kmr, EGFP, and SV40 poly(A) in this order (Kimura et al., 2006). A fusion protein of Cre-mCherry-NLS (nuclear localization signal) was used as Cre recombinase. For this, Cre, mCherry (Shaner et al., 2004), and NLS (synthesized DNA) were fused with their reading frame being in-frame. The purpose of adding mCherry was to identify transgenic fish by the presence of mCherry fluorescence. NLS was added to facilitate nuclear transportation of the fusion protein. The template DNA for the Cre construct consists hsp, Cre-mCherry-NLS, BGH poly(A), and Kmr in this order. The BAC DNAs used in this study were the following; zK17G17 for dbx1b, zK251E16 for gad1b (GAD67), zK76N24 for glyt2 (glycine transporter 2) (McLean et al., 2007), and zK145P24 for vglut2a (vesicular glutamate transporter 2a). These BAC clones were obtained from RZPD. BAC DNA constructs generated in this study were the following: dbx1b:GFP, dbx1b:lDl-GFP (lDl: loxP-DsRed-loxP cassette), dbx1b:Cre, glyt2:lDl-GFP, vglut2a:lDl-GFP, and gad1b:lDl-GFP.
For the generation of the gfap:dTomato construct, ∼7.3 kb of the 5′ upstream sequence of zebrafish gfap (Bernardos and Raymond, 2006) was PCR-amplified from a zebrafish BAC containing the gfap gene, zK15N1. The amplified gfap promoter, dTomato (Shaner et al., 2004), and BGH poly(A) were placed in this order in the pT2KXIGΔin vector that has zebrafish Tol2 transposable elements (Urasaki et al., 2006). For the generation of the huC:loxP-DsRed-loxP-GFP construct, the huC promoter (Higashijima et al., 2003) and the loxP-DsRed-loxP-GFP cassette were placed in this order in the pT2KXIGΔin vector.
For the generation of the hoxa9a:Cre construct, ∼3.9 kb of the 3′ downstream sequence of the zebrafish hoxa9a gene was cloned. This sequence (hoxa9a enhancer), when combined with heat shock promoter, was capable of driving gene expression in the trunk cells including spinal cells (not in the hindbrain) from the somite stage. We subcloned the hoxa9a enhancer, hsp, Cre-mCherry-NLS, and BGH poly(A) sequences in this order into pBluscript-SK (Stratagene).
Microinjection of BAC DNA for the generation of transgenic fish was performed as described previously (Kimura et al., 2006). Microinjection of Tol2-based plasmid DNA was performed as described previously (Kawakami, 2004; Urasaki et al., 2006). Transgenic zebrafish generated in this study are the followings: Tg[dbx1b:GFP], Tg[dbx1b:loxP-DsRed-loxP-GFP], Tg[vglut2a:loxP-DsRed-loxP], Tg[huC:loxP-DsRed-loxP-GFP] and Tg[gfap:dTomato]. The first three lines have been published previously (Miyasaka et al., 2009; Kani et al., 2010; Kinkhabwala et al., 2011; Koyama et al., 2011), and they have the following allele numbers: Tg[dbx1b:GFP]nns11, Tg[dbx1b:loxP-DsRed-loxP-GFP]nns13, Tg[slc17a6b (vglut2a):loxP-DsRed-loxP-GFP]nns14. In addition to these transgenic fish generated by us, Tg[glyt2:GFP] (Tg[slc6a5:GFP]cf3) (McLean et al., 2007) was used in this study.
Stochastic labeling of V0 neurons with GFP.
For stochastic expression of GFP in V0 neurons, DNA of vglut2a:lDl-GFP, glyt2:lDl-GFP, gad1b:lDl-GFP, or huC:lDl-GFP was injected into one to four cell stage embryos of Tg[dbx1b:Cre] stable transgenic fish. Embryonic/larval fish having GFP expression in a small number of neurons were selected using a fluorescent dissecting microscope. GFP-labeled neurons were imaged in the living fish by confocal microscopy.
Antibody staining.
Antibody staining was performed as described previously (Higashijima et al., 2004a). We used the following primary antibodies: anti-GAD65/67 antibody (GC3108, Sigma, 1:500), rabbit anti-Pax2 (ab37129, Abcam, 1:200), rabbit anti-GFP (A11122, Invitrogen, 1:200), rat anti-GFP (04404-26, Nacalai, 1:200), mouse anti-BrdU (G3G4, Developmental Studies Hybridoma Bank, 1:200), rabbit anti-Evx2, and guinea pig anti-Evx2 (these anti-Evx2 were generated in our laboratory using bacterially expressed proteins). The secondary antibodies used were Cy5- or Cy3-conjugated antibody (Jackson ImmunoResearch, 1:200) and Alexa Fluor 488-conjugated antibody (Invitrogen, 1:200). For sectioning, samples were fixed in 4% paraformaldehyde, soaked in 30% sucrose, and mounted in Tissue-Tek O.C.T. compound (Sakura). Twenty-five-micrometer frozen sections were generated with a Leica E2800 cryostat.
Time-lapse imaging.
For stochastic expression of GFP in p0 progenitors, hoxa9a:Cre DNA was injected into 32-cell or 64-cell stage embryos of Tg[dbx1b:lDl-GFP] transgenic fish. After 14 hpf, embryos were moved to a solution containing 0.002% phenyl thiourea (PTU; Nacalai) to prevent pigmentation. During the later phase of our experiments, we used pigment-free mutants, Casper (White et al., 2008). In this case, PTU treatment was omitted. Embryos having GFP expression in a small number of p0 progenitors were selected using a fluorescent dissecting microscope. GFP-labeled progenitors at segments 10–20 were the focus of our observations. Time-lapse imaging was performed in two ways. In the first way, embryos were embedded in agarose every time for imaging (after imaging, embryos were removed from the agarose). Imaging was performed from the dorsal side every 2–3 h. During the imaging process, the mounted embryos were covered with solution containing 0.013% 3-amino benzoic acid ethyl ester (MS222; Sigma). Between imaging periods, embryos were kept in MS222-free solution. Imaging was performed using a Zeiss LSM510 confocal microscope (inverted) with a 25× water-immersion objective lens. In the second way, embryos were placed in an imaging chamber designed for prolonged time-lapse imaging on an inverted microscope (Megason, 2009). Images were captured from the dorsal side every 1–2 h using a Nikon A1 confocal microscope (inverted) with a 20× air objective lens. The solution covering embryos contained 0.013% of MS222. In both cases, time-lapse imaging was performed from 24 hpf to 51–74 hpf in the experiments performed for Evx2 and Pax2 immunohistochemistry.
In our experiments, there was a concern that new Cre-mediated recombination events could occur in p0 progenitors that were different from the p0 progenitor under observation. If this occurred nearby, clonally unrelated p0 progenitors would express GFP, which would confound lineage analysis. We found that the occurrence of this type of new recombination was extremely rare (new recombination events could be detected by the appearance of very weakly labeled GFP cells). The rare occurrences we observed are probably a reflection of the activity of the hoxa9a enhancer at earlier developmental stages. Consequently, Cre-mediated recombination, if it occurred, tended to do so before the start of the observation. When new recombination events were observed, we did not continue to analyze the lineages. New recombination events were confined to 24–30 hpf. After 30 hpf, we did not encounter any new recombination events.
In the experiments designed to obtain axonal morphologies of V0 excitatory neurons, time-lapse observations were performed at 1–2 h intervals from 24 hpf to 30–36 hpf. During this time period, we wanted to be sure that new recombination events did not occur and obscure our ability to identify the progeny at later time points. After 36 hpf, we stopped 1–2 h interval time-lapse observations because new recombination events do not occur after this time, but more importantly, repeated imaging could cause bleaching of GFP-labeled cells, making the final observation of the identification of neurons difficult (dbx1b mRNA is not expressed in postmitotic neurons, so GFP fluorescence in neurons becomes dimmer over time). We let animals grow until 3.5 dpf. The final observation was made from the lateral side.
BrdU labeling.
Dechorionated embryos at a given developmental time point were placed in a solution of 10 mm BrdU and 15% DMSO and incubated for 20 min on ice. The time points we chose were 20, 24, 30, 36, 42, 48, 54, and 60 hpf. The embryos were then placed in a solution of 10 mm BrdU and 1% DMSO and incubated at 28.5°C. The animals were moved to BrdU-free solution at 72 hpf. At 5 dpf, morphological observations of V0 excitatory neurons were made. The larvae were then fixed with 4% paraformaldehyde. The fixed larvae were immersed in 2 m HCl for 1 h and then processed for anti-BrdU and anti-GFP immunohistochemistry.
Dibenzazepine treatment.
Dibenzazepine (DBZ; Calbiochem) was reconstituted with DMSO to make a stock concentration of 1.6 mm. Aliquots were diluted to 1.6 μm in 1/3 Ringer solution. Embryos were dechorionated and incubated at 28.5°C in the DBZ solution from the shield stage (6 hpf).
Results
Visualization of V0 neurons in living zebrafish
To visualize p0 progenitors and the neurons that derive from them, we generated Tg[dbx1b:GFP] transgenic fish (Fig. 1A; 2.5 dpf). In the transgenic fish, weak expression of GFP in p0 domain progenitors was initiated at ∼13 hpf (data not shown). Figure 1B shows a confocal stacked image of a cross section of spinal cord at 36 hpf. GFP expression was observed in a stripe-like pattern. Within this stripe (p0/V0 domain), both dbx1b-expressing p0 progenitors and postmitotic neurons derived from p0 progenitors (V0 neurons) were present, as ventrally extending GFP-positive processes were already recognized at this stage (Fig. 1B, arrows). Postmitotic neurons are located in the lateral region of the stripe at this stage. Figure 1C shows a lateral view of the spinal cord at 2.5 dpf. Intense GFP signal was observed in p0/V0 domain. In addition, many GFP-positive cells located in a more dorsal region were observed. All of these cells appeared to be postmitotic neurons, as inferred by their circular shapes. These results suggest that after being generated in the p0 domain, some of the postmitotic V0 neurons migrated in a dorsal direction. It should be noted that the presence of these dorsally located GFP-positive cells was not due to ectopic expression of GFP in the transgenic fish, because gfp mRNA expression was confined to the p0/V0 domain throughout the stages we examined (from 24 hpf to 2.5 dpf; data not shown).
Figure 1.
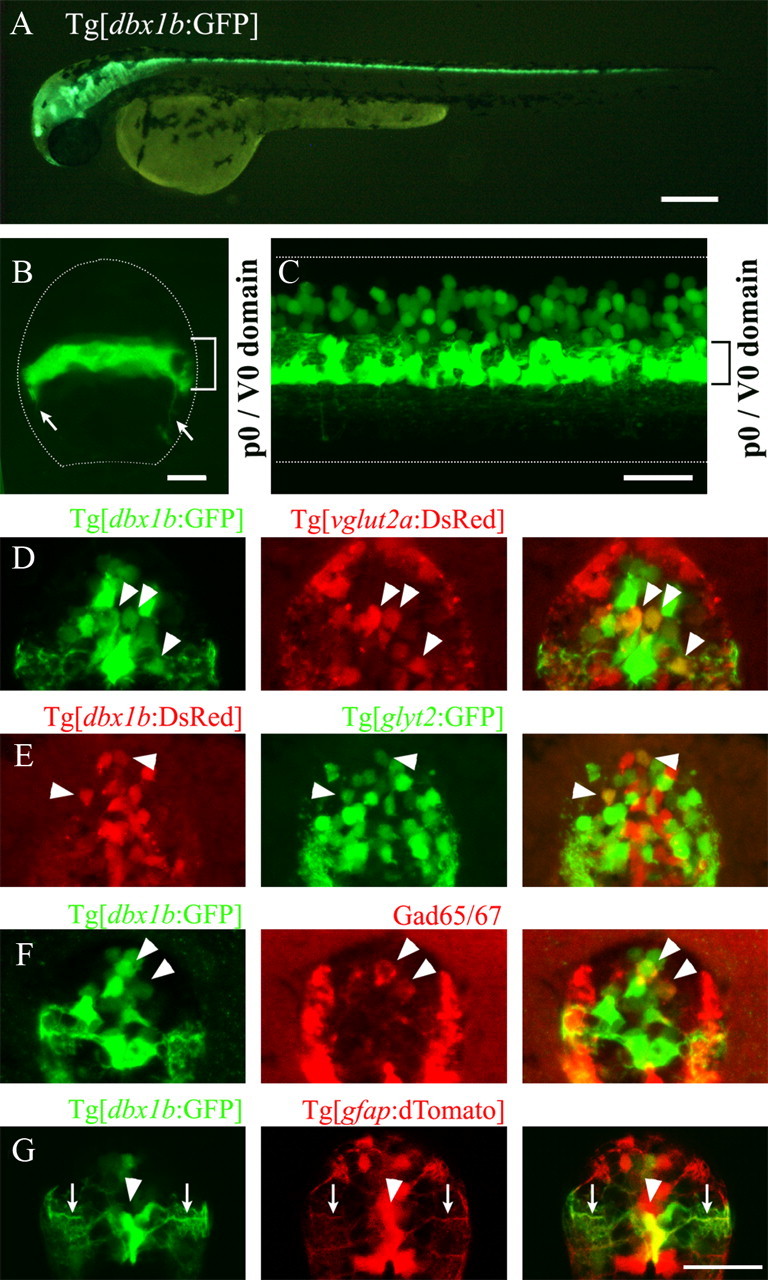
Visualization of p0/V0 cells and neurotransmitter properties of V0 neurons. A, Tg[dbx1b:GFP] transgenic fish at 2.5 dpf. B, Cross section of the spinal cord of a Tg[dbx1b:GFP] transgenic fish at 36 hpf. A stacked image of confocal optical sections. Arrows indicate axons from GFP-expressing neurons. C, Lateral view of the spinal cord of a 2.5 dpf embryo. A stacked image of confocal optical sections. D–G, Cross sections were observed using confocal microscopy (stacked images). D, Compound transgenic fish of Tg[dbx1b:GFP] and Tg[vglut2a:DsRed] at 2.5 dpf. Arrowheads indicate cells that are dually positive for GFP and DsRed. E, Compound transgenic fish of Tg[dbx1b:DsRed] and Tg[glyt2:GFP] at 2.5 dpf. Arrowheads indicate cells that are dually positive for GFP and DsRed. F, Immunostaining with GAD65/67 in Tg[dbx1b:GFP] at 2.5 dpf. Arrowheads indicate cells that are dually positive for GFP and GAD65/67. G, Compound transgenic fish of Tg[dbx1b:GFP] and Tg[gfap:dTomato] at 5.5 dpf. An arrowhead indicates cells that are dually positive for GFP and dTomato. Arrows indicate GFP/dTomato-positive fiber-like processes extending outwards toward the pial surface. Scale bars: A, 250 μm; B, 10 μm; C, 50 μm; D–G, 20 μm.
Both excitatory and inhibitory neurons are produced from p0 progenitors
Next, we investigated the neurotransmitter properties (glutamate, glycine and GABA) of V0 neurons using transgenic fish and immunohistochemistry. We generated Tg[vglut2a:loxP-DsRed-loxP-GFP] transgenic fish to visualize glutamatergic neurons. Because the fish expressed just DsRed without applying Cre recombinase, the line will be referred to as Tg[vglut2a:DsRed] in this section. For glycinergic neurons, we used Tg[glyt2:GFP] transgenic fish (McLean et al., 2007). To reveal dbx1b-derived glycinergic neurons in this strain, we generated Tg[dbx1b:loxP-DsRed-loxP-GFP] (referred to as Tg[dbx1b:DsRed] in this section). For GABAergic neurons, we used an antibody against GAD65/67.
Figure 1D shows cross sections of the spinal cord of compound transgenic fish Tg[dbx1b:GFP] and Tg[vglut2a:DsRed] at 2.5 dpf and Figure 1E shows cross sections of compound transgenic fish Tg[dbx1b:DsRed] and Tg[glyt2:GFP] at 2.5 dpf. Cells dually positive for GFP and DsRed (Fig. 1D,E, arrowheads) were present in both cases. Figure 1F shows GAD65/67 immunohistochemistry in Tg[dbx1b:GFP] at 2.5 dpf. Cells dually positive for GFP and GAD were present. Together, these results indicated that glutamatergic, glycinergic and GABAergic neurons are included among V0 neurons. This is consistent with the situation in amniotes: in mice and chicks, both excitatory (glutamatergic) and inhibitory (glycinergic and GABAergic) neurons are generated from p0 progenitors (Lanuza et al., 2004).
In amniotes, p0 progenitors have been shown to produce astrocytes at later stages of development (Fogarty et al., 2005). We asked whether astrocytes were produced from p0 progenitors by crossing Tg[dbx1b:GFP] to Tg[gfap:dTomato]. Figure 1G shows cross sections of the spinal cord at 5.5 dpf. Cell bodies that were clearly positive for GFP were only recognized in the medial region of the spinal cord (Fig. 1G, arrowhead). Laterally extending processes originating from these cells were observed (Fig. 1G, arrows). These are likely to be astrocytes, because the GFP-positive cell bodies and processes were also positive for dTomato signal. Thus, as in mice, p0 progenitors produce astrocytes after producing V0 neurons. At this later stage of development, recognition of V0 neurons by GFP expression became difficult because of decreases in GFP expression levels in postmitotic V0 neurons.
Morphology of V0 inhibitory neurons
For morphological analysis of V0 neurons, we combined the Cre/loxP recombination system and a transient stochastic labeling technique. For this purpose, we generated Tg[dbx1b:Cre] transgenic fish. For promoters of the reporter constructs (loxP-DsRed-loxP-GFP), we used glyt2, gad1b (gad67) and vglut2a. DNA constructs were injected into Tg[dbx1b:Cre] embryos at the one- to four-cell stage, and GFP-labeled neurons in isolation were analyzed at 5dpf.
First, we describe the morphology of inhibitory (glycinergic and GABAergic) neurons. The features that could apply to all of the GFP-labeled inhibitory neurons were commissural axons and unipolar somata (Fig. 2A–D, n = 28 for glycinergic neurons and n = 21 for GABAergic neurons). Axons on the contralateral side often bifurcated with one ascending and the other descending. Two representative examples of glycinergic neurons are shown in Figure 2, A and B. Two representative examples of GABAergic neurons are shown in Figure 2, C and D. GABAergic neurons occasionally had ipsilateral axons (or this could be very long dendrites extending in a rostro-caudal direction) in addition to contralateral axons (Fig. 2D,D′, n = 6 of 21). Other than that, glycinergic neurons and GABAergic neurons were morphologically similar, although the axonal length of GABAergic neurons tended to be much shorter than that of glycinergic neurons (Fig. 2A–D; data for axonal length are summarized in Fig. 2E). Hereafter, we will call V0 glycinergic neurons and GABAergic neurons V0-iB (inhibitory and bifurcating) neurons.
Figure 2.

Morphological analysis of GFP-labeled V0 inhibitory neurons. A–D, Fish in which a small number of V0 inhibitory neurons expressed GFP were obtained by injecting either the glyt2:loxP-DsRed-loxP-GFP (glyt2:lDl-GFP) or gad1b:lDl-GFP DNA constructs into Tg[dbx1b:Cre] transgenic fish. Images (at 5–5.5 dpf) were made from confocal optical sections. A, B, Two examples of V0 glycinergic neurons. A′, Depth-code image of A, showing that the axon crosses midline, and projects to the contralateral side. C, D, D′, Two examples of V0 GABAergic neurons. D and D′ are the same neuron. In D′, optical sections for only the ipsilateral side are stacked. E, Axonal length of GFP-labeled V0 glycinergic and GABAergic neurons (V0-iBs). The scale of the x and y axes is body segments. Scale bar, 100 μm.
V0 excitatory neurons are morphologically categorized into three groups
We next examined the morphology of V0 excitatory neurons. We found that all the glutamatergic neurons were commissural. In addition to their commissural nature, V0 glutamatergic neurons were clearly morphologically heterogeneous. Based on the axonal trajectories on the contralateral side, we categorized the neurons into three types: commissural ascending neurons (Fig. 3A,B), commissural bifurcating neurons (Fig. 3C) and commissural descending neurons (Fig. 3D,E). They are respectively named V0-eA (excitatory and ascending), V0-eB (excitatory and bifurcating) and V0-eD (excitatory descending) neurons.
Figure 3.
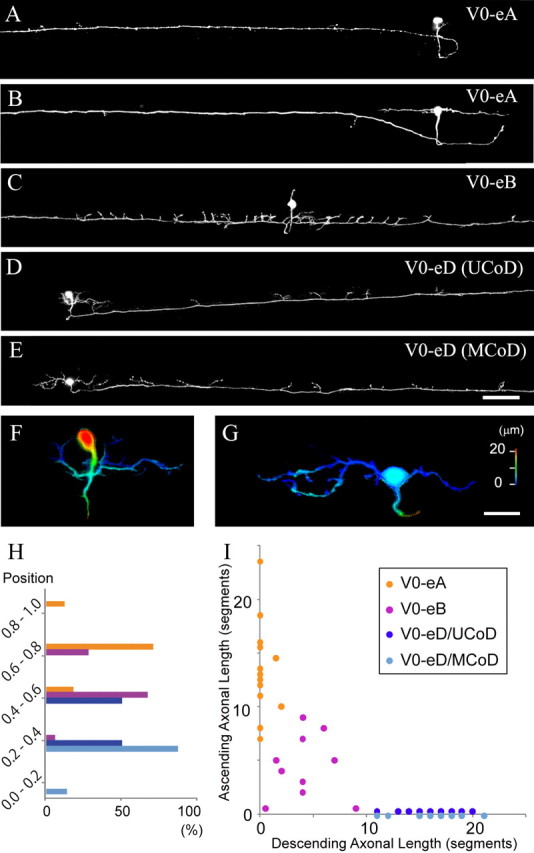
Morphological analysis of GFP-labeled V0 excitatory neurons. A–G, Fish in which a small number of V0 excitatory neurons expressed GFP were obtained by injecting the vglut2a:lDl-GFP DNA construct into Tg[dbx1b:Cre] transgenic fish. Images (at 5–5.5 dpf) were made from confocal optical sections. A, B, Two examples of V0-eA (excitatory and ascending) neurons. C, An example of V0-eB (excitatory and bifurcating) neurons. D, An example of a unipolar type V0-eD (excitatory and descending) neuron. The morphological features match previously identified UCoD neurons. E, An example of a multipolar type V0-eD neuron. The morphological features match previously identified MCoD neurons. F, Depth-code view of D. The unipolar soma is located in the medial region of the spinal cord, while dendrites, which come off from the primary process are located superficially. G, Depth-code view of E. The soma and dendrites, which come off from the soma, are both located superficially. H, Location of somata of V0-eA, V0-eB, V0-eD (UCoD), and V0-eD (MCoD) neurons along the dorsoventral axis. The dorsal edge of the spinal cord is assigned as 1, while the ventral edge is assigned as 0. I, Axonal length of GFP-labeled V0-eA, V0-eB, V0-eD (UCoD), and V0-eD (MCoD) neurons. The scale of the x and y axes is body segments. Scale bars: A–E, 100 μm; F, G, 20 μm.
Figure 3, A and B, shows two representative examples of V0-eA neurons. They were either unipolar (Fig. 3A) or multipolar (Fig. 3B). V0-eA neurons were located in a relatively dorsal region of the spinal cord (soma position = 0.76 ± 0.08, n = 17; Fig. 3H; the dorsal edge of the spinal cord is assigned as 1 and the ventral edge is assigned as 0). Occasionally, V0-eA neurons had short and thin secondary descending axons on the contralateral side (Fig. 3B; n = 2 of 17).
Figure 3C shows a representative example of V0-eB neurons. Neurons belonging to this class had oval cell bodies that were located at the middle of the spinal cord (soma position = 0.62 ± 0.09, n = 18, Fig. 3H). On the contralateral side, the axon bifurcated, and projected in rostral and caudal directions. Along the way, the axon sent off many prominent collaterals in a dorsal direction. These prominent collaterals were most densely distributed in the proximal region of the axons (within a few segments).
Figure 3, D and E, shows two representative examples of V0-eD neurons. Their soma positions were most ventral among V0 excitatory neurons (soma position = 0.42 ± 0.09, n = 31). V0-eD neurons could be further subcategorized into a unipolar type (Fig. 3D,F) and a multipolar type (Fig. 3E,G). Unipolar V0-eD neurons fulfill all the hallmarks of the unipolar commissural descending (UCoD) neurons that were previously identified by backfilling studies (Hale et al., 2001; Higashijima et al., 2004b). The features include: (1) unipolar, mediolaterally elongate cell bodies, (2) medially located somata midway along the dorso-ventral axis (soma position = 0.49 ± 0.06, n = 16, Fig. 3H), and (3) a laterally extending primary process from which dendrites come off (Fig. 3F). Multipolar V0-eD neurons fulfill all the hallmarks of the multipolar commissural descending (MCoD) neurons that were also previously identified by backfilling studies (Hale et al., 2001; Higashijima et al., 2004b). The features include: (1) irregularly shaped cell bodies, (2) elaborate dendritic arbors, which often arise from the rostral and caudal margins of the soma (Fig. 3G), and (3) superficially located cell bodies (Fig. 3G) in relatively ventral spinal cord (soma position = 0.34 ± 0.06, n = 15, Fig. 3H). Based on this anatomical evidence, we conclude that MCoD and UCoD neurons constitute V0-eD neurons.
Figure 3I shows the axonal length of V0-eA, V0-eB, and V0-eD (UCoD and MCoD) neurons. There is virtually no overlap validating the grouping. In summary, V0 excitatory neurons can be categorized into three groups; V0-eA, V0-eB and V0-eD. V0-eD neurons can further be subgrouped into two previously identified classes, UCoDs and MCoDs, based on their morphological characteristics and the locations of the soma. For most of this paper, UCoDs and MCoDs will be collectively handled as V0-eDs.
Evx2 and Pax2 can serve as markers for V0 excitatory and inhibitory neurons, respectively
Next, we asked how the generation of different V0 neurons is developmentally regulated. We first focused on the neurotransmitter differences (excitatory and inhibitory). For developmental analysis, we needed markers to distinguish V0 excitatory and V0 inhibitory neurons early in development. Studies in amniotes suggest that Evx2 could function as a V0 excitatory neuron-specific marker (Bouvier et al., 2010), while Pax2 could serve as a marker for many classes of inhibitory neurons, including V0 inhibitory neurons (Cheng et al., 2004). We found that this was indeed the case in zebrafish. Evx2 and Pax2 expression patterns are nonoverlapping (see Fig. 5). Figure 4A shows that all the V0 glutamatergic neurons are positive for Evx2 (n > 400; 5 fish were examined). Figure 4, B and C, shows that all the inhibitory (glycinergic and GABAergic) V0 neurons are positive for Pax2 (n > 100 for each neurotransmitter; 8 fish were examined for each). We further asked whether or not all V0 neurons were marked by the combination of Evx2 or Pax2. For this purpose, we generated huC:loxP-DsRed-loxP-GFP (huC:lDl-GFP) transgenic line. huC is a pan neuronal marker, so all classes of V0 neurons are labeled by GFP in compound transgenic fish for Tg[dbx1b:Cre] and Tg[huC:lDl-GFP]. Virtually, all GFP-positive cells were marked by the combination of Evx2 and Pax2 (>500 cells were examined in 5 fish and except for 5 cells all the GFP-positive cells were positive). A representative example is shown in Figure 4D.
Figure 5.

Time-lapse imaging of p0 progenitors and their progeny. hoxa9a:Cre DNA was injected into32-cell or 64-cell stage embryos of Tg[dbx1b:lDl-GFP] transgenic fish. Embryos having isolated GFP-labeled p0 progenitors were selected, and monitored by time-lapse imaging. All time-lapse images (black and white images) are stacked images (dorsal views) made from confocal optical sections. The right-most color panels show immunostaining with Evx2 (red) and Pax2 (green). These are montage images made from several confocal optical sections (the locations of GFP cells are highly three-dimensional, and thus, montages were generated using several optical sections for clear presentation). The dotted line in each panel shows the midline. A, The p0 progenitor produced three Pax2-positive cells (arrows in the right-most two panels). The first division of the progenitor appears to be an asymmetric one. The cell marked by the arrow in the middle panel is likely to be a postmitotic neuron (corresponds to the lateral-most Pax2 cell in the right-most panel), while the cell marked by the arrowhead is likely to be a progenitor; the cell divided once to generate the other two Pax2 cells. B, The p0 progenitor produced two Pax2-positive cells (arrows in the right-most two panels) and two marker-negative cells (arrowheads). C, The p0 progenitor produced three Evx2-positive cells (arrows in the right-most two panels). The first division of the progenitor appears to be an asymmetric one. The cell marked by the arrow in the middle panel is likely to be a postmitotic neuron (corresponds to the lateral-most Evx2 cell in the right-most panel), while the cell marked by the arrowhead is likely to be a progenitor; the cell divided once to generate the other two Evx2 cells. D, The p0 progenitor produced three Evx2-positive cells (arrows in the right-most two panels) and one marker-negative cell (arrowhead). E, The p0 progenitor directly differentiated into one Evx2-positive cell (arrows in the right-most two panels). Scale bar, 10 μm.
Figure 4.
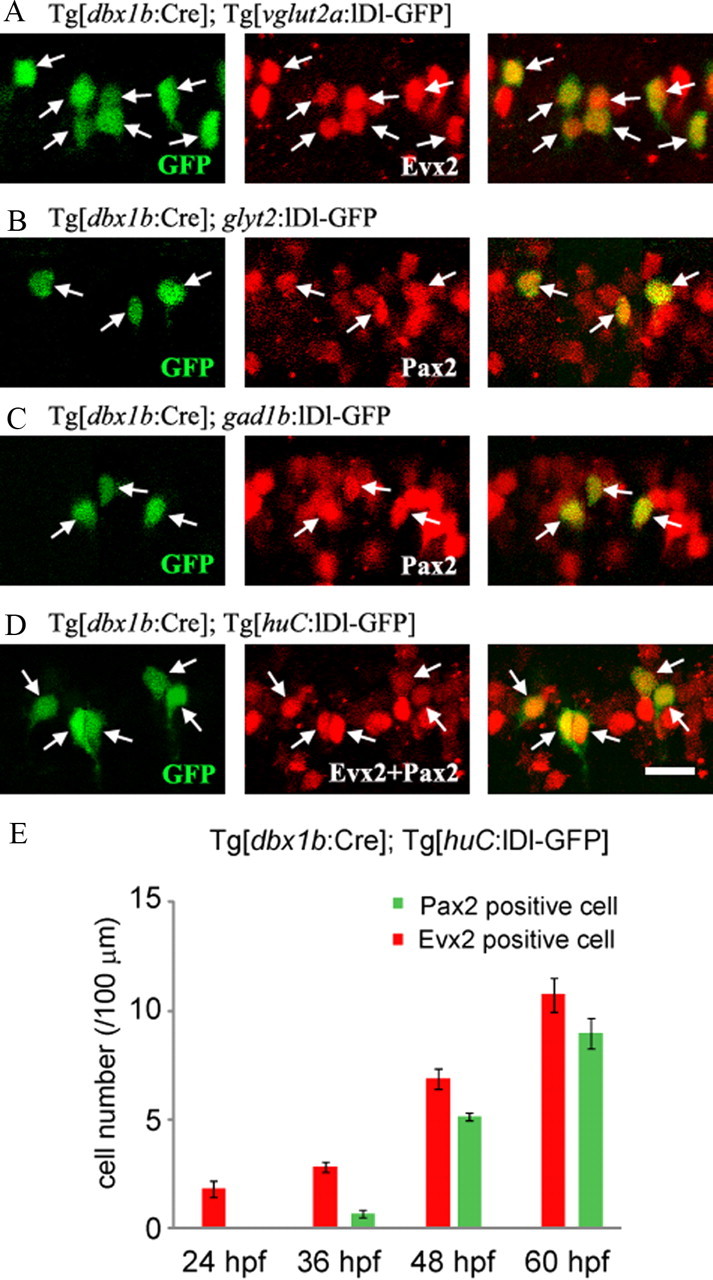
Evx2 and Pax2 expression in V0 neurons, and the timing of V0 neurogenesis. A–D, All are stacked images made from confocal optical sections. Red channels are Cy5 images. A, V0 excitatory neurons are labeled by GFP in compound transgenic fish of Tg[dbx1b:Cre] and Tg[vglut2a:lDl-GFP]. All the GFP-positive cells are positive for Evx2 (at arrows). B, V0 glycinergic neurons are labeled by GFP by injecting glyt2:lDl-GFP DNA into a Tg[dbx1b:Cre] transgenic embryo. All the GFP-positive cells are positive for Pax2 (at arrows). C, V0 GABAergic neurons are labeled by GFP by injecting gad1b:lDl-GFP DNA into a Tg[dbx1b:Cre] transgenic embryo. All the GFP-positive cells are positive for Pax2 (at arrows). D, V0 neurons are labeled by GFP in compound transgenic fish of Tg[dbx1b:Cre] and Tg[huC:lDl-GFP]. All the GFP-positive cells are positive for the combination of Evx2 and Pax2 (at arrows). E, Timing of appearance of Evx2- and Pax2-positive V0 neurons. V0 neurons were a broadly labeled by GFP in compound transgenic fish of Tg[dbx1b:Cre] and Tg[huC:lDl-GFP]. Numbers of Evx2-positive GFP cells and Pax2-positive cells were counted at 24, 36, 48, and 60 hpf. Evx2-expressing cells (V0 excitatory neurons) arose earlier than Pax2-expressing cells (V0 inhibitory neurons). Scale bar, 20 μm.
Timing of genesis of V0 excitatory and inhibitory neurons
We then examined the timing of differentiation of V0 excitatory and inhibitory neurons. For this purpose, we counted Evx2-positive and Pax2-positive GFP neurons through embryonic development in compound transgenic fish for Tg[dbx1b:Cre] and Tg[huC:lDl-GFP]. At 24 hpf, all GFP neurons were Evx2-positive, indicating that neurons are all excitatory at this early stage (Fig. 4E). At 36 hpf, the number of Evx2-positive neurons increased, and in addition, a small number of Pax2-positive neurons appeared (Fig. 4E). During subsequent development (48 hpf and 60 hpf), the number of Evx2- and Pax2-positive neurons steadily increased (Fig. 4E). These results indicate that p0 progenitors produce only excitatory neurons at the earliest phase. After passing this early phase, the p0 progenitor pool keeps producing both excitatory and inhibitory neurons.
V0 excitatory and inhibitory neurons are produced from different progenitors
We next asked whether the V0 excitatory and inhibitory neurons share the same progenitors. To address this issue, we performed confocal time-lapse imaging of p0 progenitors and their progeny, followed by immunohistochemistry with Evx2 and Pax2. p0 progenitors were stochastically labeled by GFP using Tg[dbx1b:lDl-GFP] transgenic fish and transient expression of hoxa9a:Cre. Embryos having singly isolated GFP-expressing cells were chosen at 24 hpf, and GFP-labeled cells (and their offspring) were imaged every 2–3 h or every 1–2 h from the dorsal side until 51–74 hpf. In total, 67 lineages were analyzed. Five representative examples of time-lapse imaging are shown in Figure 5. The results are summarized in Table 1. Marker-negative cells could be attributable to the difference in the timing of protein expression or non-neuronal cells such as progenitors and glial cells. There is one clear feature: in the vast majority, if not all, of clones, Evx2-positive and Pax2-positive cells did not coexist (Fig. 5; clone #1–64 in Table 1). There were three outliers (clone #65–67). In these three outliers, the progenitors, which were elongated in the mediolateral dimension, appeared to generate two mediolaterally elongating cells (likely to be clonally related progenitors) before they produced spherical prospective neurons (data not shown). Thus, Evx2- and Pax2-positive cells may have been produced from two clonally related, but different p2 progenitors. In summary, our results strongly suggest that the vast majority (possibly all) of p0 progenitors produce either excitatory or inhibitory neurons, once they enter the mode to produce neurons.
Table 1.
Summary of lineage analysis
| Clone # | Pax2 | Evx2 | Marker negative | Total cell number |
|---|---|---|---|---|
| 1 | ○○○○○ | ○ | 6 | |
| 2 | ○○○○ | 4 | ||
| 3 | ○○○○ | 4 | ||
| 4 | ○○○ | ○ | 4 | |
| 5 | ○○○ | ○ | 4 | |
| 6 | ○○○ | 3 | ||
| 7 | ○○○ | 3 | ||
| 8 | ○○○ | 3 | ||
| 9 | ○○○ | 3 | ||
| 10 | ○○○ | 3 | ||
| 11 | ○○ | ○○○ | 5 | |
| 12 | ○○ | ○○ | 4 | |
| 13 | ○○ | ○○ | 4 | |
| 14 | ○○ | ○○ | 4 | |
| 15 | ○○ | ○○ | 4 | |
| 16 | ○○ | ○○ | 4 | |
| 17 | ○○ | ○ | 3 | |
| 18 | ○○ | ○ | 3 | |
| 19 | ○○ | ○ | 3 | |
| 20 | ○○ | 2 | ||
| 21 | ○○ | 2 | ||
| 22 | ○○ | 2 | ||
| 23 | ○ | ○○○ | 4 | |
| 24 | ○ | ○○ | 3 | |
| 25 | ○ | ○○ | 3 | |
| 26 | ○ | ○○ | 3 | |
| 27 | ○ | ○○ | 3 | |
| 28 | ○ | ○○ | 3 | |
| 29 | ○ | ○○ | 3 | |
| 30 | ○ | ○○ | 3 | |
| 31 | ○ | ○○ | 3 | |
| 32 | ○ | ○○ | 3 | |
| 33 | ○○○○ | ○ | 5 | |
| 34 | ○○○ | ○ | 4 | |
| 35 | ○○○ | ○ | 4 | |
| 36 | ○○○ | ○ | 4 | |
| 37 | ○○○ | ○ | 4 | |
| 38 | ○○○ | ○ | 4 | |
| 39 | ○○○ | 3 | ||
| 40 | ○○○ | 3 | ||
| 41 | ○○○ | 3 | ||
| 42 | ○○ | ○○ | 4 | |
| 43 | ○○ | ○○ | 4 | |
| 44 | ○○ | ○○ | 4 | |
| 45 | ○○ | ○ | 3 | |
| 46 | ○○ | ○ | 3 | |
| 47 | ○○ | 2 | ||
| 48 | ○○ | 2 | ||
| 49 | ○○ | 2 | ||
| 50 | ○ | ○○ | 3 | |
| 51 | ○ | ○○ | 3 | |
| 52 | ○ | ○○ | 3 | |
| 53 | ○ | ○○ | 3 | |
| 54 | ○ | ○ | 2 | |
| 55 | ○ | ○ | 2 | |
| 56 | ○ | 1 | ||
| 57 | ○ | 1 | ||
| 58 | ○ | 1 | ||
| 59 | ○ | 1 | ||
| 60 | ○ | 1 | ||
| 61 | ○ | 1 | ||
| 62 | ○ | 1 | ||
| 63 | ○ | 1 | ||
| 64 | ○ | 1 | ||
| 65 | ○○○ | ○○○ | 6 | |
| 66 | ○○ | ○○○ | 5 | |
| 67 | ○○ | ○ | ○○ | 5 |
The numbers of cells produced ranged from 1 to 6 (as mentioned above, some of clones could be derived from two-clonally related p0 progenitors). Nine lineages resulted in single cells (clone #56–64). There is one consistent feature in these lineages: the resultant single cells were always positive for Evx2. A representative example of this type of clone is shown in Figure 5E. The p0 progenitor lost its apical process, and the cell directly differentiated into a neuron. This type of differentiation mode was never observed in lineages that produced Pax2-positive neurons.
Time-lapse imaging also suggested a division mode when multiple cells were produced. It appeared that asymmetric divisions (divisions that produced progenitors and neurons) were involved. Examples are shown in Figure 5, A and C. In the middle time point, cells denoted by the arrow are prospective neurons, while cells denoted by the arrowheads are prospective progenitors (two cells were derived from the same progenitor). The latter underwent divisions during subsequent development.
V0-eAs are produced by distinct progenitors
V0 excitatory neurons are clearly separable into three subtypes, V0-eAs, V0-eBs, and V0-eDs. We wanted to know whether there was any relationship between lineages and the types of V0 excitatory neurons produced. For this analysis, time-lapse imaging of p0 progenitors, as described above, was performed from 24 hpf to 30–36 hpf. This was done to ensure that clonally unrelated GFP cells did not appear nearby (see Materials and Methods). Then, we let animals grow until 3.5 dpf, the time when axonal trajectories were apparent. The final observations were made from the lateral side. Only clones that contained V0 excitatory neurons were analyzed.
We found that there was a relationship between the cell types and the cell division types. Progeny clones that consisted of just single cells were always V0-eAs (Fig. 6A,B; clone #1 and 2 in E). This was also the case in the experiment described in the previous section. In all of the 9 clones constituting single cells (clone #56–64 in Table 1), we traced axons at the final time of the observation (∼51–55 hpf), and they always had commissural ascending axons. By contrast, progeny clones that consisted of more than two neurons contained both V0-eBs, and V0-eDs (Fig. 6C,D,D′ and clone #3–7 in E). Notably, V0-eA neurons were never observed among clones that consisted of more than one cell, strongly suggesting that V0-eAs were always produced by the direct differentiation of distinct, nonproliferating p0 progenitors.
Figure 6.
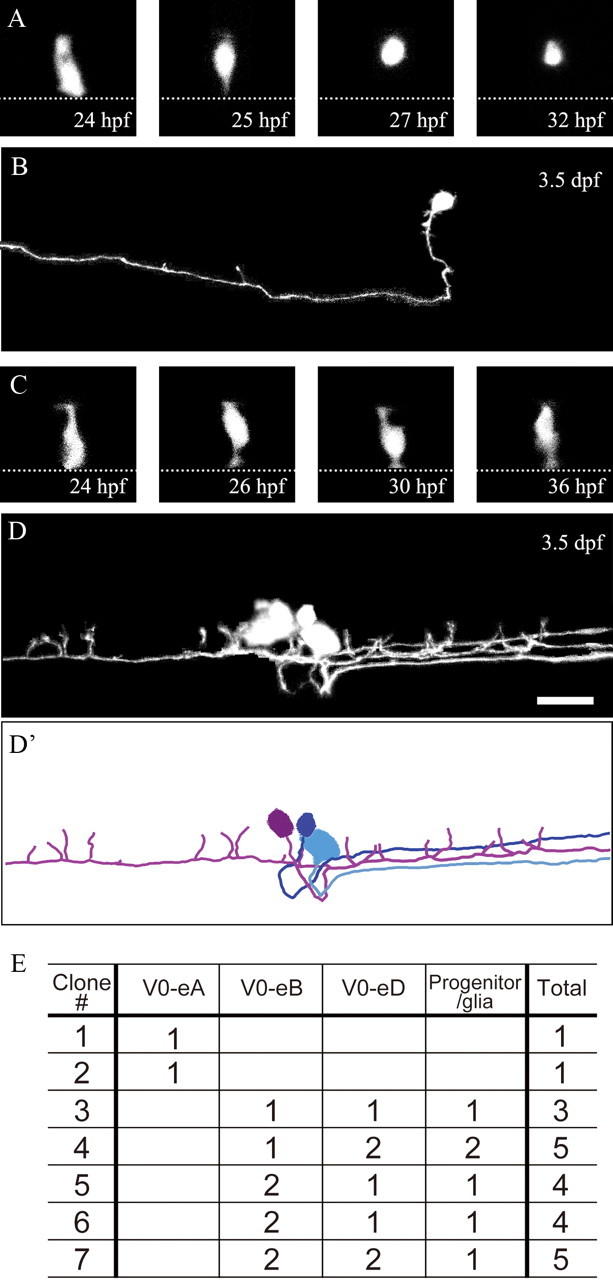
Time-lapse imaging of p0 progenitors and their progeny. After time-lapse imaging (A and C; dorsal views), animals were left to grow until 3.5 dpf, when the final images (B and D; lateral views) were taken. hoxa9a:Cre DNA was injected into 32-cell or 64-cell stage embryos of Tg[dbx1b:lDl-GFP] transgenic fish. Embryos having GFP-labeled p0 progenitors in isolation were selected, and monitored by time-lapse imaging. All pictures (black and white images) are stacked images made from confocal optical sections. A, B, The p0 progenitor directly differentiated into one V0-eA neuron. C, D, D′, The p0 progenitor produced one V0-eB neuron, two V0-eD neurons, and one progenitor or glial cell. D′ shows a camera-lucida image of D. Only neurons are traced (the progenitor/glia is not traced). E, Summary of lineage analysis. Scale bar, 20 μm.
Time-lapse imaging experiments also suggest an early neurogenesis of V0-eAs. In all the 11 clones (9 for Table 1, and 2 for Fig. 6E), the precursors of V0-eAs lost their apical processes by 29 hpf (Figs. 5E, 6A), and in most cases, the ascending axons on the contralateral could be recognized as early as 35 hpf (data not shown).
Differentiation of three classes of V0 excitatory neurons are temporally regulated
Our data thus far indicate that V0-eB and V0-eD neurons are produced from common progenitors. How might the genesis of these two types of neurons be developmentally regulated? One possible mechanism is that differentiation of V0-eB and V0-eD neurons is temporally regulated. To test this idea and to corroborate the early neurogenesis of V0-eA neurons, we investigated the timing of differentiation of three classes of V0 excitatory neurons. Two approaches were used: (1) observation of stochastically labeled V0 excitatory neurons at different time points, and (2) BrdU incorporation experiments. For the first approach, the vglut2a:lDl-GFP construct was injected into embryos of Tg[dbx1b:Cre] (the same experiment shown in Fig. 3). The morphology of isolated GFP-labeled neurons was examined at 1.5, 2.5, and 3.5 dpf. Figure 7A shows representative examples at each time point. The frequency of observed neuronal types at each time point is shown in Figure 7B (it should be noted that neurons whose axons could not be clearly traced were not included in our analysis. In this sense, the frequency shown does not purely reflect the numbers of GFP-labeled neurons at each time point). At 1.5 dpf, the vast majority of neurons were V0-eA type neurons (Fig. 7A top panel, B). At 2.5 dpf, in addition to the V0-eA neurons, neurons with short bifurcating axons were often observed (Fig. 7A middle, B). This corresponded to an early developing V0-eB (the same neuron was observed at 3.5 dpf to verify its morphology). At 2.5 dpf, no V0-eD neurons were observed (Fig. 7B). Only by 3.5 dpf were V0-eD neurons observed (Fig. 7A bottom, B). Thus, the appearance of V0-excitatory neurons obeyed the following order: V0-eAs, V0-eBs, and V0-eDs.
Figure 7.
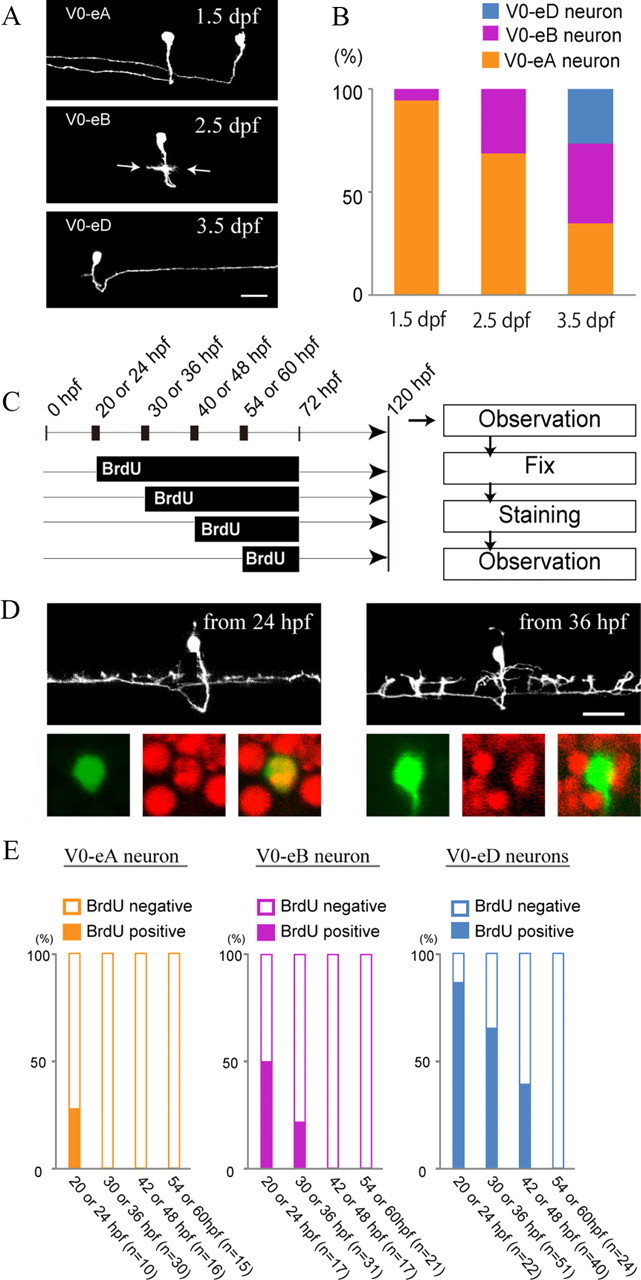
Temporal order of V0 excitatory neurogenesis. In all the experiments, fish in which a small number of V0 excitatory neurons expressed GFP were obtained by injecting the vglut2a:lDl-GFP DNA construct into Tg[dbx1b:Cre] transgenic fish. A, Examples of three different time points. Top, 1.5 dpf. Two V0-eA neurons are labeled. Middle, 2.5 dpf. A V0-eB neuron is labeled (arrows indicate growing bifurcating axon). Bottom, A V0-eD neuron is labeled. B, Observation frequency of three classes of V0 excitatory neurons at three different time points. C, Schematics of BrdU incorporation experiments. BrdU was applied at a given time point, and embryos were incubated in the presence of BrdU until 72 hpf. Then, animals were moved to BrdU-free solution. At 120 hpf (5 dpf), neuronal morphology was examined. The animals were then processed for BrdU immunohistochemistry. D, Examples of V0-eB neurons. In each panel, the top images shows a stack of images from the living fish at 5 dpf, while the bottom three show images after BrdU immunohistochemistry. The GFP images are in green and the BrdU images are in red. Left, BrdU was applied at 24 hpf in this animal. The cell is positive for BrdU. Right, BrdU was applied at 36 hpf in this animal. The cell is negative for BrdU. E, Summary of BrdU incorporation experiments. Percentage of BrdU-positive and -negative cells for each cell type at a given time point of BrdU application is indicated. Scale bar, 20 μm.
For the second approach, V0 excitatory neurons were stochastically labeled as above. In addition, during development, mitotically active cells were labeled with BrdU. The experimental scheme is shown in Figure 7C. The final observations for cell-type identification were made at 5 dpf (120 hpf). Essentially, the experiments were performed to determine when neurons for a given cell-type became postmitotic. Representative examples for V0-eB neurons are shown in Figure 7D. The V0-eB neuron in the left panel was positive for BrdU, indicating that the progenitors that produced the V0-eB neuron had undergone at least one division after 24 hpf. The V0-eB neuron in the right panel was negative for BrdU, indicating that the cell had become postmitotic before 36 hpf. The frequency of BrdU-positive and -negative cells versus application timing of BrdU for each cell type is summarized in Figure 7E, which shows the following pattern; V0-eA neurons were the earliest to become postmitotic, V0-eB neurons were the next, and V0-eD neurons were the last.
Together, the results of the two experiments show that there is a temporal order to the differentiation of V0 excitatory neurons. They arise in the following order: V0-eAs, V0-eBs, and V0-eDs.
Acceleration of neuronal differentiation by reducing Notch signaling changes the identity of cell types
We have thus far shown that the generation of V0 neurons is temporally regulated. This led us to speculate that changing the timing of neuronal differentiation might influence the neuronal types generated (Aizawa et al., 2007). We tested this idea by reducing Notch signaling in neuronal precursors, which would result in precocious neuronal differentiation at the expense of progenitor pool. We used DBZ, a pharmacological inhibitor of gamma-secretase, which effectively interferes with Notch pathway functions (van Es et al., 2005). We performed this experiment using Tg[dbx1b:Cre] and Tg[huC:lDl-GFP] crossed fish in which V0 neurons were broadly labeled by GFP. As expected, DBZ-treated embryos had excess numbers of V0 neurons at 24 hpf (Fig. 8A). Compared with DMSO-treated control embryos, in which the numbers of GFP-positive cells steadily increased during development, the numbers of GFP-positive cells in DBZ-treated embryos did not increase much between 24 and 60 hpf (Fig. 8A), consistent with the idea that forced production of excess neurons at early stages depleted the p0 progenitor pool. We then examined neurotransmitter phenotypes of V0 neurons in DBZ-treated and control embryos at 48 hpf. The vast majority of the GFP-labeled neurons were Evx2-positive in DBZ-treated embryos; while the percentage of Pax2-positive cells was greatly decreased compared with controls (Fig. 8B). This indicates that excitatory neurons were overproduced at the expense of inhibitory neurons. Finally, we examined the morphology of V0 neurons in DBZ-treated embryos using a transient expression system (the huC:lDl-GFP construct was injected into Tg[dbx1b:Cre] embryos). Morphological examinations were made at 2.5 dpf. Thirty-seven of 44 (84%) GFP neurons whose axons were followed had commissural ascending axons (in DBZ-treated embryos, some of GFP-positive cells did not have obvious axons, and these cells were excluded from the analysis). Representative examples are shown in Figure 8C, in which two labeled neurons had V0-eA like morphology. These results indicate that acceleration of neuronal differentiation at early stages results in preferential production of V0-eA neurons in p0/V0 domain.
Figure 8.

Acceleration of neurogenesis by reducing Notch signaling results in overproduction of V0-eA neurons. In A and B, V0 neurons were broadly labeled by GFP in compound transgenic fish of Tg[dbx1b:Cre] and Tg[huC:lDl-GFP]. A, Numbers of GFP-labeled V0 neurons in control (DMSO-treated) and DBZ-treated embryos at different developmental time points. B, Percentage of Pax2- and Evx2-positive cells among GFP-labeled V0 neurons at 48 hpf. C, V0 neurons were stochastically labeled with GFP by injecting the huC:lDl-GFP construct into a Tg[dbx1b:Cre] transgenic embryo. The embryo was treated with DBZ. The two neurons shown have V0-eA like morphology. Scale bar, 20 μm.
Discussion
Heterogeneous p0 progenitors and the temporal order of neuronal differentiation generate multiple types of V0 neurons
In this study, we have demonstrated the following regarding the development of V0 neurons. (1) V0 neurons are comprised of both excitatory and inhibitory neurons. (2) V0 excitatory neurons are categorized into three subtypes, V0-eA, V0-eB, and V0-eD. (3) In the earliest phase, only V0 excitatory neurons are produced. After passing this stage, both V0 excitatory and inhibitory neurons are continuously produced. (4) V0 excitatory neurons and V0 inhibitory neurons are produced from different p0 progenitors. (5) V0-eA neurons directly differentiate from distinct, nonproliferating progenitors, while V0-eB and V0-eD neurons are produced from common progenitors. (6) There is a temporal order in the differentiation of V0 excitatory neurons. They arise in the following order, V0-eAs, V0-eBs, and V0-eDs. (7) Forced production of neurons at earlier stages, by modifying Notch signaling, results in overproduction of V0-eAs at the expense of other neuronal types.
Taking all of the results into account, we propose a model of V0 neuron differentiation (Fig. 9). The model first assumes that p0 progenitors are homogeneous populations at the beginning (a). Then, p0 progenitors enter a “first phase” of neurogenesis. At this stage, the p0 progenitor pool only produces V0-eA neurons. Because V0-eAs are produced from distinct, nonproliferating progenitors, the model assumes that heterogeneity is formed among p0 progenitors (b). Namely, a certain population of p0 progenitors is selected to become precursors of V0-eAs, which then differentiate into V0-eA neurons without further divisions. Then, the p0 progenitor pool enters a “second phase” when both excitatory and inhibitory neurons are continuously produced. Because excitatory neurons and inhibitory neurons are produced from different progenitors, segregation of the progenitor pool also likely occurs at this stage (c). Progenitors for inhibitory neurons only produce inhibitory neurons. Progenitors for excitatory neurons only produce excitatory neurons. Progenitors for excitatory neurons preferentially produce V0-eB neurons at the early stage of the second phase. The same progenitors then preferentially produce V0-eD neurons later. The model well explains the results of the present study. However, whether the first phase and second phase represent clearly defined boundaries is uncertain.
Figure 9.

A proposed model of V0 neuron differentiation. In this model, V0 neurogenesis is roughly subdivided into two phases: a first phase and a second phase. At the beginning, the model assumes that p0 progenitors are homogeneous populations (A). In the first phase, distinct, nonproliferating progenitors for V0-eA neurons are selected from the p0 progenitor pool (B). The selected progenitors then directly differentiate into V0-eA neurons without any further divisions. In the second phase, p0 progenitors are subdivided into two types: progenitors for V0 inhibitory neurons and those for V0 excitatory neurons (C). In the early stage of the second phase, progenitors for V0 excitatory neurons preferentially generate V0-eB neurons. In the late stage of the second phase, the same progenitors, after producing V0-eB neurons, preferentially produce V0-eD neurons.
The present study revealed that two mechanisms are used to produce three classes of V0 excitatory neurons. Overall, the genesis of V0 excitatory neurons obeys the following temporal order; V0-eAs, V0-eBs, and V0-eDs. This temporal order, however, is an end result of a mixture between the production of V0-eAs from distinct, nonproliferating progenitors (for V0-eAs) and temporal order of neurogenesis from common progenitors (for V0-eBs and V0-eDs). A temporal order of neurogenesis occurs in many region of the developing CNS including the cerebral cortex and the retina (Cepko et al., 1996; Molyneaux et al., 2007; Jacob et al., 2008). In these regions, recent studies have revealed the presence of heterogeneity among progenitor pool (Mizutani et al., 2007; Brzezinski et al., 2011). Thus, it may be that the interplay between heterogeneity among progenitors and the temporal control of neurogenesis is a widely used strategy in many areas of the developing CNS.
How are precursors of V0-eAs selected among the p0 progenitor pool? One possible mechanism is that Notch-mediated lateral inhibition among p0 progenitors can sort out precursors of V0-eAs. In our experiments, in which Notch signaling was reduced during early neurogenesis, excess V0-eA neurons were formed. This result is compatible with the idea that Notch signaling is involved in the selection process of V0-eA precursors. However, the result can be interpreted in a different way. Reducing Notch activity accelerates neurogenesis at early stages, and p0 progenitors only have the competence to generate V0-eA neurons at this early stage. Thus, further study is needed to clarify the molecular mechanism for the selection of distinct, nonproliferating progenitors for V0-eAs.
How is the segregation of progenitors for inhibitory neurons and those for excitatory neurons achieved? In amniotes, Evx1/2-positive excitatory V0 neurons have been shown to arise from the ventral region of the p0 domain. Thus, the p0 domain is presumed to be subdivided into dorsal and ventral subdomains, with the former producing inhibitory neurons and the latter producing excitatory neurons (Lanuza et al., 2004). A spatial subdivision in the p0 domain may also occur in zebrafish. However, such a subdivision, if present, should not be fixed or should at least be plastic at early stages, because the forced production of neurons at early stages by modifying Notch-signaling resulted in an overproduction of excitatory neurons (V0-eAs) at the expense of inhibitory neurons. If a subdivision is present, then, it is gradually generated over the course of development.
V0-eBs and V0-eDs are generated from common progenitors in a sequential manner. What are the molecular mechanisms that account for this sequential genesis of different types of neurons? One potential mechanism is that the properties of progenitors intrinsically change over time, which probably depends on a change in gene expression within progenitors (Jacob et al., 2008). Temporal changes in gene expression within p0 progenitors for V0-eBs and V0-eDs may occur in zebrafish. Extrinsic factors could also influence cell-fate decisions, as are suggested to during cortical and retinal development (Cepko, 1999; Fukumitsu et al., 2006; Seuntjens et al., 2009). During p0/V0 development, for example, signals secreted by differentiated cells (e.g., V0-eBs) could act on progenitors to tune their lineages such that they preferentially generate V0-eDs in the later phase of neurogenesis.
In Drosophila embryonic neurogenesis, sequential generation of different types of neurons is accompanied by a temporal change in gene expression patterns within progenitors (Isshiki et al., 2001). In this species, progenitors, called neuroblasts, produce multiple types of neurons in a completely stereotyped manner, including the number of neurons (Bossing et al., 1996). In our lineage analyses, the numbers of V0-eB and V0-eD neurons that were produced from a single p0 progenitor were variable (Fig. 6E), indicating that lineages from the progenitors are not as stereotyped as those observed in Drosophila. During retinal development, progenitors produce multiple classes of neurons in a temporal order, but lineages from progenitors are not completely fixed (Cayouette et al., 2006). It may be that chronological production of several classes of neurons without a fixed lineage from a progenitor is a common phenomenon in vertebrate neural development.
Previously, we analyzed neurogenesis in the p2 domain (Kimura et al., 2008). There, excitatory neurons and inhibitory neurons are reproducibly generated by the final division of pair-producing progenitors. This is vastly different from the pattern of p0 neurogenesis revealed in this study. In p0 neurogenesis, excitatory and inhibitory neurons are generated from different progenitors. Division modes are also very different. In the p0 domain, the earliest differentiating neurons (V0-eAs) are generated by the direct differentiation of progenitors. Later on, progenitors for both inhibitory neurons and excitatory neurons appear to undergo asymmetric divisions that produce progenitors and neurons (Fig. 5). Thus, each domain in the developing spinal cord employs a very different strategy for producing multiple types of neurons.
V0 neurons in zebrafish
We have shown that V0 neurons are all commissural neurons, consisting of both excitatory and inhibitory neurons. The situation is similar in amniotes (Lanuza et al., 2004). Therefore, the types of neurons generated in the p0 domain are largely conserved across vertebrate species. One notable difference, however, does appear to exist. In mice, ipsilaterally projecting cholinergic (V0c) neurons that are labeled by Pitx2 develop from the p0 domain (Zagoraiou et al., 2009). In zebrafish V0c-corresponding neurons seem to be absent, as Evx2- and Pax2-positive neurons appear to account for all the population of V0 neurons, and Pitx2 is not expressed in V0 neurons (our unpublished observation).
Glycinergic V0-iB neurons have a morphology that is characteristic of glycinergic CoBL (commissural bifurcating longitudinal) neurons (Higashijima et al., 2004b). Therefore, glycinergic CoBLs are likely to be included among what we have designated as glycinergic V0-iBs. Glycinergic CoBLs were shown to fire in phase with motoneurons located nearby during swimming, and thus, they are suggested to play a role in left-right reciprocal inhibition of body movements during swimming (Liao and Fetcho, 2008). A study in dbx1 mutant mice suggests that V0 inhibitory neurons in mammals play an important role in coordinating movements across the left and right sides of the body (Lanuza et al., 2004). These observations suggest that the function of V0 inhibitory neurons is conserved across vertebrate species.
V0 excitatory neurons are categorized into three types, V0-eAs, V0-eBs, and V0-eDs (UCoDs and MCoDs). MCoDs, a subclass of V0-eDs, have been shown to be involved in slow swimming, by providing excitation to contralateral motoneurons located far caudally (McLean et al., 2008), and thus, at least a subset of V0 excitatory neurons are involved in locomotion. This suggests that V0 excitatory neurons in mammals are also involved in locomotion. Currently, the function of other types of V0 excitatory neurons is not known. Because the axonal trajectories of V0-eAs and V0-eBs are clearly distinct from MCoDs, we speculate that the functions of V0-eAs and V0-eBs are different from MCoDs. Clarification of this point awaits future physiological studies.
Footnotes
This work was supported in part by grants from the Ministry of Education, Science, Technology, Sports and Culture of Japan. We thank T. Fujimori and Spectrography/Bioimaging Facility, National Institute for Basic Biology Core Research Facilities for equipment; R. Y. Tsien for mCherry and dTomato DNA; and K. Kawakami for Tol2 DNA.
References
- Aizawa H, Goto M, Sato T, Okamoto H. Temporally regulated asymmetric neurogenesis causes left-right difference in the zebrafish habenular structures. Dev Cell. 2007;12:87–98. doi: 10.1016/j.devcel.2006.10.004. [DOI] [PubMed] [Google Scholar]
- Alvarez FJ, Jonas PC, Sapir T, Hartley R, Berrocal MC, Geiman EJ, Todd AJ, Goulding M. Postnatal phenotype and localization of spinal cord V1 derived interneurons. J Comp Neurol. 2005;493:177–192. doi: 10.1002/cne.20711. [DOI] [PMC free article] [PubMed] [Google Scholar]
- Bernardos RL, Raymond PA. GFAP transgenic zebrafish. Gene Expr Patterns. 2006;6:1007–1013. doi: 10.1016/j.modgep.2006.04.006. [DOI] [PubMed] [Google Scholar]
- Bossing T, Udolph G, Doe CQ, Technau GM. The embryonic central nervous system lineages of Drosophila melanogaster. I. Neuroblast lineages derived from the ventral half of the neuroectoderm. Dev Biol. 1996;179:41–64. doi: 10.1006/dbio.1996.0240. [DOI] [PubMed] [Google Scholar]
- Bouvier J, Thoby-Brisson M, Renier N, Dubreuil V, Ericson J, Champagnat J, Pierani A, Chédotal A, Fortin G. Hindbrain interneurons and axon guidance signaling critical for breathing. Nat Neurosci. 2010;13:1066–1074. doi: 10.1038/nn.2622. [DOI] [PubMed] [Google Scholar]
- Brzezinski JA, 4th, Kim EJ, Johnson JE, Reh TA. Ascl1 expression defines a subpopulation of lineage-restricted progenitors in the mammalian retina. Development. 2011;138:3519–3531. doi: 10.1242/dev.064006. [DOI] [PMC free article] [PubMed] [Google Scholar]
- Cayouette M, Poggi L, Harris WA. Lineage in the vertebrate retina. Trends Neurosci. 2006;29:563–570. doi: 10.1016/j.tins.2006.08.003. [DOI] [PubMed] [Google Scholar]
- Cepko CL. The roles of intrinsic and extrinsic cues and bHLH genes in the determination of retinal cell fates. Curr Opin Neurobiol. 1999;9:37–46. doi: 10.1016/s0959-4388(99)80005-1. [DOI] [PubMed] [Google Scholar]
- Cepko CL, Austin CP, Yang X, Alexiades M, Ezzeddine D. Cell fate determination in the vertebrate retina. Proc Natl Acad Sci U S A. 1996;93:589–595. doi: 10.1073/pnas.93.2.589. [DOI] [PMC free article] [PubMed] [Google Scholar]
- Cheng L, Arata A, Mizuguchi R, Qian Y, Karunaratne A, Gray PA, Arata S, Shirasawa S, Bouchard M, Luo P, Chen CL, Busslinger M, Goulding M, Onimaru H, Ma Q. Tlx3 and Tlx1 are post-mitotic selector genes determining glutamatergic over GABAergic cell fates. Nat Neurosci. 2004;7:510–517. doi: 10.1038/nn1221. [DOI] [PubMed] [Google Scholar]
- Doe CQ, Skeath JB. Neurogenesis in the insect central nervous system. Curr Opin Neurobiol. 1996;6:18–24. doi: 10.1016/s0959-4388(96)80004-3. [DOI] [PubMed] [Google Scholar]
- Doe CQ, Technau GM. Identification and cell lineage of individual neural precursors in the Drosophila CNS. Trends Neurosci. 1993;16:510–514. doi: 10.1016/0166-2236(93)90195-r. [DOI] [PubMed] [Google Scholar]
- Fogarty M, Richardson WD, Kessaris N. A subset of oligodendrocytes generated from radial glia in the dorsal spinal cord. Development. 2005;132:1951–1959. doi: 10.1242/dev.01777. [DOI] [PubMed] [Google Scholar]
- Fukumitsu H, Ohtsuka M, Murai R, Nakamura H, Itoh K, Furukawa S. Brain-derived neurotrophic factor participates in determination of neuronal laminar fate in the developing mouse cerebral cortex. J Neurosci. 2006;26:13218–13230. doi: 10.1523/JNEUROSCI.4251-06.2006. [DOI] [PMC free article] [PubMed] [Google Scholar]
- Goulding M, Lamar E. Neuronal patterning: Making stripes in the spinal cord. Curr Biol. 2000;10:R565–R568. doi: 10.1016/s0960-9822(00)00615-1. [DOI] [PubMed] [Google Scholar]
- Hale ME, Ritter DA, Fetcho JR. A confocal study of spinal interneurons in living larval zebrafish. J Comp Neurol. 2001;437:1–16. doi: 10.1002/cne.1266. [DOI] [PubMed] [Google Scholar]
- Halloran MC, Sato-Maeda M, Warren JT, Su F, Lele Z, Krone PH, Kuwada JY, Shoji W. Laser-induced gene expression in specific cells of transgenic zebrafish. Development. 2000;127:1953–1960. doi: 10.1242/dev.127.9.1953. [DOI] [PubMed] [Google Scholar]
- Higashijima S, Masino MA, Mandel G, Fetcho JR. Imaging neuronal activity during zebrafish behavior with a genetically encoded calcium indicator. J Neurophysiol. 2003;90:3986–3997. doi: 10.1152/jn.00576.2003. [DOI] [PubMed] [Google Scholar]
- Higashijima S, Mandel G, Fetcho JR. Distribution of prospective glutamatergic, glycinergic, and GABAergic neurons in embryonic and larval zebrafish. J Comp Neurol. 2004a;480:1–18. doi: 10.1002/cne.20278. [DOI] [PubMed] [Google Scholar]
- Higashijima S, Schaefer M, Fetcho JR. Neurotransmitter properties of spinal interneurons in embryonic and larval zebrafish. J Comp Neurol. 2004b;480:19–37. doi: 10.1002/cne.20279. [DOI] [PubMed] [Google Scholar]
- Isshiki T, Pearson B, Holbrook S, Doe CQ. Drosophila neuroblasts sequentially express transcription factors which specify the temporal identity of their neuronal progeny. Cell. 2001;106:511–521. doi: 10.1016/s0092-8674(01)00465-2. [DOI] [PubMed] [Google Scholar]
- Jacob J, Maurange C, Gould AP. Temporal control of neuronal diversity: common regulatory principles in insects and vertebrates? Development. 2008;135:3481–3489. doi: 10.1242/dev.016931. [DOI] [PubMed] [Google Scholar]
- Jessell TM. Neuronal specification in the spinal cord: inductive signals and transcriptional codes. Nat Rev Genet. 2000;1:20–29. doi: 10.1038/35049541. [DOI] [PubMed] [Google Scholar]
- Kani S, Bae YK, Shimizu T, Tanabe K, Satou C, Parsons MJ, Scott E, Higashijima S, Hibi M. Proneural gene-linked neurogenesis in zebrafish cerebellum. Dev Biol. 2010;343:1–17. doi: 10.1016/j.ydbio.2010.03.024. [DOI] [PubMed] [Google Scholar]
- Kawakami K. Transgenesis and gene trap methods in zebrafish by using the Tol2 transposable element. Methods Cell Biol. 2004;77:201–222. doi: 10.1016/s0091-679x(04)77011-9. [DOI] [PubMed] [Google Scholar]
- Kimura Y, Okamura Y, Higashijima S. alx, a zebrafish homolog of Chx10, marks ipsilateral descending excitatory interneurons that participate in the regulation of spinal locomotor circuits. J Neurosci. 2006;26:5684–5697. doi: 10.1523/JNEUROSCI.4993-05.2006. [DOI] [PMC free article] [PubMed] [Google Scholar]
- Kimura Y, Satou C, Higashijima S. V2a and V2b neurons are generated by the final divisions of pair-producing progenitors in the zebrafish spinal cord. Development. 2008;135:3001–3005. doi: 10.1242/dev.024802. [DOI] [PubMed] [Google Scholar]
- Kinkhabwala A, Riley M, Koyama M, Monen J, Satou C, Kimura Y, Higashijima S, Fetcho J. A structural and functional ground plan for neurons in the hindbrain of zebrafish. Proc Natl Acad Sci U S A. 2011;108:1164–1169. doi: 10.1073/pnas.1012185108. [DOI] [PMC free article] [PubMed] [Google Scholar]
- Koyama M, Kinkhabwala A, Satou C, Higashijima S, Fetcho J. Mapping a sensory-motor network onto a structural and functional ground plan in the hindbrain. Proc Natl Acad Sci U S A. 2011;108:1170–1175. doi: 10.1073/pnas.1012189108. [DOI] [PMC free article] [PubMed] [Google Scholar]
- Lanuza GM, Gosgnach S, Pierani A, Jessell TM, Goulding M. Genetic identification of spinal interneurons that coordinate left-right locomotor activity necessary for walking movements. Neuron. 2004;42:375–386. doi: 10.1016/s0896-6273(04)00249-1. [DOI] [PubMed] [Google Scholar]
- Lee EC, Yu D, Martinez de Velasco J, Tessarollo L, Swing DA, Court DL, Jenkins NA, Copeland NG. A highly efficient Escherichia coli-based chromosome engineering system adapted for recombinogenic targeting and subcloning of BAC DNA. Genomics. 2001;73:56–65. doi: 10.1006/geno.2000.6451. [DOI] [PubMed] [Google Scholar]
- Liao JC, Fetcho JR. Shared versus specialized glycinergic spinal interneurons in axial motor circuits of larval zebrafish. J Neurosci. 2008;28:12982–12992. doi: 10.1523/JNEUROSCI.3330-08.2008. [DOI] [PMC free article] [PubMed] [Google Scholar]
- McLean DL, Fan J, Higashijima S, Hale ME, Fetcho JR. A topographic map of recruitment in spinal cord. Nature. 2007;446:71–75. doi: 10.1038/nature05588. [DOI] [PubMed] [Google Scholar]
- McLean DL, Masino MA, Koh IY, Lindquist WB, Fetcho JR. Continuous shifts in the active set of spinal interneurons during changes in locomotor speed. Nat Neurosci. 2008;11:1419–1429. doi: 10.1038/nn.2225. [DOI] [PMC free article] [PubMed] [Google Scholar]
- Megason SG. In toto imaging of embryogenesis with confocal time-lapse microscopy. Methods Mol Biol. 2009;546:317–332. doi: 10.1007/978-1-60327-977-2_19. [DOI] [PMC free article] [PubMed] [Google Scholar]
- Miyasaka N, Morimoto K, Tsubokawa T, Higashijima S, Okamoto H, Yoshihara Y. From the olfactory bulb to higher brain centers: genetic visualization of secondary olfactory pathways in zebrafish. J Neurosci. 2009;29:4756–4767. doi: 10.1523/JNEUROSCI.0118-09.2009. [DOI] [PMC free article] [PubMed] [Google Scholar]
- Mizutani K, Yoon K, Dang L, Tokunaga A, Gaiano N. Differential Notch signalling distinguishes neural stem cells from intermediate progenitors. Nature. 2007;449:351–355. doi: 10.1038/nature06090. [DOI] [PubMed] [Google Scholar]
- Molyneaux BJ, Arlotta P, Menezes JR, Macklis JD. Neuronal subtype specification in the cerebral cortex. Nat Rev Neurosci. 2007;8:427–437. doi: 10.1038/nrn2151. [DOI] [PubMed] [Google Scholar]
- Pierani A, Moran-Rivard L, Sunshine MJ, Littman DR, Goulding M, Jessell TM. Control of interneuron fate in the developing spinal cord by the progenitor homeodomain protein Dbx1. Neuron. 2001;29:367–384. doi: 10.1016/s0896-6273(01)00212-4. [DOI] [PubMed] [Google Scholar]
- Sapir T, Geiman EJ, Wang Z, Velasquez T, Mitsui S, Yoshihara Y, Frank E, Alvarez FJ, Goulding M. Pax6 and engrailed 1 regulate two distinct aspects of Renshaw cell development. J Neurosci. 2004;24:1255–1264. doi: 10.1523/JNEUROSCI.3187-03.2004. [DOI] [PMC free article] [PubMed] [Google Scholar]
- Seuntjens E, Nityanandam A, Miquelajauregui A, Debruyn J, Stryjewska A, Goebbels S, Nave KA, Huylebroeck D, Tarabykin V. Sip1 regulates sequential fate decisions by feedback signaling from postmitotic neurons to progenitors. Nat Neurosci. 2009;12:1373–1380. doi: 10.1038/nn.2409. [DOI] [PubMed] [Google Scholar]
- Shaner NC, Campbell RE, Steinbach PA, Giepmans BN, Palmer AE, Tsien RY. Improved monomeric red, orange and yellow fluorescent proteins derived from Discosoma sp. red fluorescent protein. Nat Biotechnol. 2004;22:1567–1572. doi: 10.1038/nbt1037. [DOI] [PubMed] [Google Scholar]
- Urasaki A, Morvan G, Kawakami K. Functional dissection of the Tol2 transposable element identified the minimal cis-sequence and a highly repetitive sequence in the subterminal region essential for transposition. Genetics. 2006;174:639–649. doi: 10.1534/genetics.106.060244. [DOI] [PMC free article] [PubMed] [Google Scholar]
- van Es JH, van Gijn ME, Riccio O, van den Born M, Vooijs M, Begthel H, Cozijnsen M, Robine S, Winton DJ, Radtke F, Clevers H. Notch/gamma-secretase inhibition turns proliferative cells in intestinal crypts and adenomas into goblet cells. Nature. 2005;435:959–963. doi: 10.1038/nature03659. [DOI] [PubMed] [Google Scholar]
- White RM, Sessa A, Burke C, Bowman T, LeBlanc J, Ceol C, Bourque C, Dovey M, Goessling W, Burns CE, Zon LI. Transparent adult zebrafish as a tool for in vivo transplantation analysis. Cell Stem Cell. 2008;2:183–189. doi: 10.1016/j.stem.2007.11.002. [DOI] [PMC free article] [PubMed] [Google Scholar]
- Zagoraiou L, Akay T, Martin JF, Brownstone RM, Jessell TM, Miles GB. A cluster of cholinergic premotor interneurons modulates mouse locomotor activity. Neuron. 2009;64:645–662. doi: 10.1016/j.neuron.2009.10.017. [DOI] [PMC free article] [PubMed] [Google Scholar]