

Abstract
Adjustment of response threshold for speed compared with accuracy instructions in two-choice decision-making tasks is associated with activation in the fronto-striatal network, including the pre-supplementary motor area (pre-SMA) and striatum (Forstmann et al., 2008). In contrast, increased response conservativeness is associated with activation of the subthalamic nucleus (STN) (Frank et al., 2007). We investigated the involvement of these regions in trial-by-trial adjustments of response threshold in humans, using a cued-trials task-switching paradigm. Fully and partially informative switch cues produced more conservative thresholds than repeat cues. Repeat cues were associated with higher activation in pre-SMA and striatum than switch cues. For all cue types, individual variability in response threshold was associated with activation level in pre-SMA, with higher activation linked to lower threshold setting. In the striatum, this relationship was found for repeat cues only. These findings support the notion that pre-SMA biases the striatum to lower response threshold under more liberal response regimens. In contrast, a high threshold for switch cues was associated with greater activation in right STN, consistent with increasing response caution under conservative response regimens. We conclude that neural models of response threshold adjustment can help explain executive control processes in task switching.
Introduction
Contextual cues often provide guidance as to the degree of cautiousness required in decision making. For example, when there is little traffic on the road, the driver's decision to change lanes can be made quickly, with little sampling of information. However, in heavy traffic, a more cautious decision is required as more information must be sampled. In evidence accumulation models (Ratcliff, 1978; Grasman et al., 2009), response cautiousness is indexed using the response threshold parameter, which represents the amount of information that needs to be accumulated before a decision can be made.
Adjustments in response threshold have been shown to be supported by cortico-basal ganglia networks (Bogacz et al., 2010). In two-choice response tasks, trial-by-trial threshold adjustment in response to instructions emphasizing response speed over accuracy was associated with higher activation and increased structural connectivity in a network including the pre-supplementary motor area (pre-SMA) and striatum (Forstmann et al., 2008, 2010). Forstmann et al. (2008) argued that, under conditions that emphasize speeded responding, the striatum is activated to lower the response threshold, releasing the motor system from a baseline state of global inhibition and thereby enabling rapid execution of a planned action. In contrast, the subthalamic nucleus (STN) was shown to respond to the need for greater response cautiousness (Frank, 2006; Fleming et al., 2010). Under high levels of response conflict, excitatory input from cortical regions [including anterior cingulate cortex (ACC) and inferior frontal cortex] to the STN slows the output of the basal ganglia, thereby allowing more information to accumulate before a decision is made (Aron et al., 2007; Frank et al., 2007). In summary, distinct cortico-basal ganglia networks support adjustments in response caution as a function of speed compared with accuracy instructions, consistent with basal ganglia models of speed–accuracy tradeoff (Bogacz et al., 2010).
Using a task-switching paradigm, we have shown previously that fully and partially informative switch cues produce higher response threshold estimates than repeat cues, indicating that participants set a more conservative threshold in response to cues that indicate upcoming conflict between action sets (Karayanidis et al., 2009). In this study, we test whether the cortico-basal ganglia networks that support adjustment of response caution in speed–accuracy manipulations are also involved in adjustment of response threshold as a function of trial-by-trial variation in cue informativeness in task switching. We use an anatomical region of interest (ROI) approach that focuses on regions previously shown to form specialized networks for the adjustment of response threshold and examine the relationship between inter-individual variation in threshold setting and activation within these regions. We hypothesize that (1) repeat cues will show greater activation in the pre-SMA and striatum than switch cues, (2) switch cues will show greater activation in the STN than repeat cues, (3) response threshold on repeat cues will be inversely related with pre-SMA and striatal activation, and (4) response threshold on switch cues will be positively related to STN activation.
Materials and Methods
Participants.
Twenty participants (8 males and 12 females; 25.35 ± 4.8 years, all right-handed, $20 reimbursement for travel costs) with no previous exposure to the paradigm underwent an initial training session, an ERP test session, and an fMRI/diffusion tensor imaging (DTI) test session (ERP and DTI data are not reported here).
Stimuli and tasks.
Three tasks were defined, each requiring a binary decision: a letter task (vowel/consonant), digit task (odd/even), and color task (hot/cold). A circle divided into six segments was continuously displayed, with groups of two adjacent segments demarcating three task regions (see Fig. 1A). On each trial, a target appeared in one segment and consisted of a pair of characters (letter, number, or symbols) presented in color or gray. Each target included three dimensions: one was relevant to the current task, one was incongruently mapped to the response on the current task, and one was neutral (i.e., non-alphanumeric character or target presented in gray). The same target could not appear on two successive trials. Responses were made with both hands, with response–hand mappings counterbalanced across participants.
Figure 1.
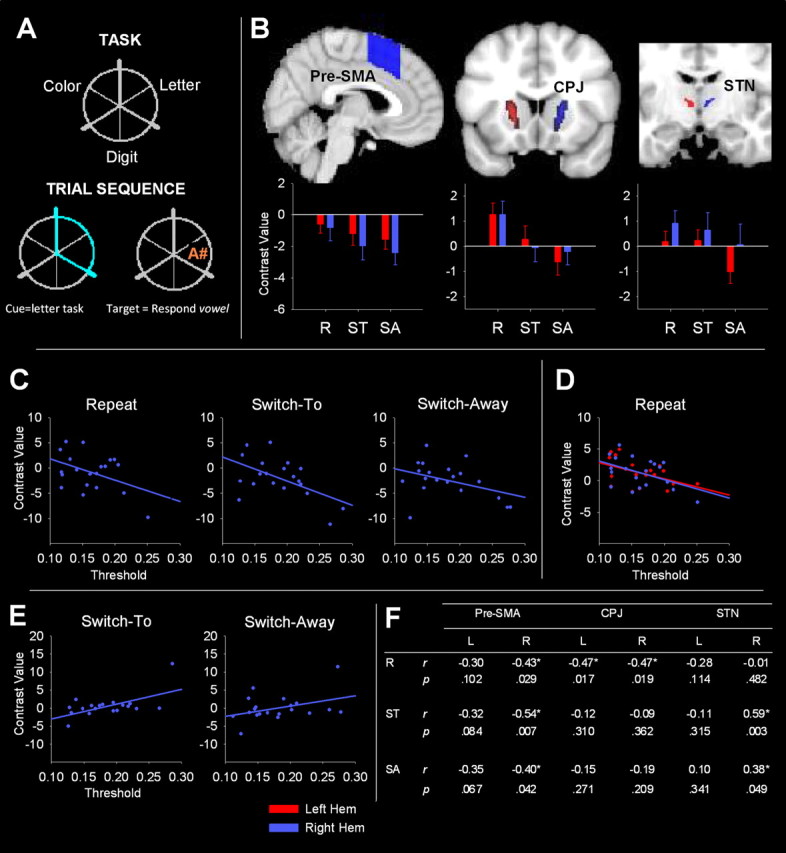
A, Top, Task-location mapping. Bottom, Example trial sequence. B, Top, ROI masks. Bottom, Mean contrast value for each cue type. C–E, Significant correlations between threshold estimates and pre-SMA, CPJ, and STN contrast values, respectively. F, Coefficients and p values for all correlations (see Materials and Methods). Significant correlations are marked with an asterisk. R, Repeat; ST, switch-to; SA, switch-away.
Each trial began with a cue that highlighted two of the six segments (see Fig. 1A). Four cue types were presented with equal probability (Karayanidis et al., 2009, their Fig. 1). The same cue could not appear on more than three consecutive trials. Cue to target interval (1000 ms) and response to target interval (1400 ms) were fixed. “Repeat” cues indicated that the same task would be repeated. “Switch-to” cues indicated that the task would change and defined the new task. “Switch-away” cues indicated that the task would not repeat but did not specify which of the other two tasks would be relevant (i.e., the cue overlapped two segments mapped to tasks that were not relevant on the previous trial). In this case, the location of the target defined which task would be performed. Non-informative cues indicated that a switch or a repeat trial was equally likely and were included to differentiate between preparatory and cue encoding processes in ERP waveforms. They are not included in the present analyses because, by definition, they provide no information that could contribute to threshold adjustment in preparation for the upcoming target.
Procedure.
Participants attended three sessions. Session 1 involved task training (768 trials of single-task and mixed-task blocks). Training was repeated at onset of session 2. Sessions 2 and 3 included fMRI testing (five blocks of 101 trials) or ERP testing (10 blocks of 101 trials). All but five participants completed the fMRI session first.
For the fMRI session, participants lay supine in the scanner bore. Stimuli were presented against a white background and back-projected onto a mirror that was mounted on the head coil (visual angle 5°). Responses and scanner pulses were relayed through a custom-built response box. Participants were instructed to perform the task as quickly and as accurately as possible. Auditory error feedback was provided after each incorrect response using MRI-compatible piezoelectric headphones. Mean response time (RT) and error feedback was given after each block.
Behavioral and EZ2 parameter analysis.
The first five trials of each block, trials associated with or immediately after an error, and trials with RT <200 ms or RT >3 SD from participant's mean RT were excluded from analysis. Response threshold was derived using the EZ2 diffusion model of Grasman et al. (2009; cf. Karayanidis et al., 2009). Mean RT, error rate, and all model parameters essentially replicated our previous findings (see Table 1 for a summary of model parameters). Our hypotheses are specific to adjustments in response threshold, and hence we only report results relevant to this measure. There was no main effect or interaction of session (ERP vs fMRI) or session order (i.e., ERP/fMRI vs fMRI/ERP) on threshold. We report data from the ERP session because it had twice the number of trials and produced stronger effects than the fMRI session.
Table 1.
Diffusion parameter estimates
| Response threshold | Drift rate | Non-decision time | |
|---|---|---|---|
| Repeat | 0.163 ± 0.011 | 0.244 ± 0.013 | 383 ± 12 |
| Switch-to | 0.189 ± 0.007 | 0.194 ± 0.012 | 384 ± 21 |
| Switch-away | 0.180 ± 0.011 | 0.202 ± 0.011 | 550 ± 21 |
Means ± SEs for each of the diffusion parameters for each cue type.
Response threshold was analyzed using a 3 task (letter, digit, color) × 3 cue type (repeat, switch-to, switch-away) repeated-measures ANOVA. There was a main effect of task (p = 0.033), with the letter task producing a higher threshold than both the digit and the color task. However, because there was no interaction between task and cue type, all analyses were averaged over task. We examined differences between cue types using simple comparisons between repeat and each of the switch cues with Bonferroni's correction.
Functional magnetic resonance image acquisition and data analysis.
MRI data were acquired using a Siemens Avanto 1.5 T whole-body MR scanner equipped with a Siemens quadrature head coil. Anatomical images were collected using a T1-weighted MPRAGE protocol (TR, 1980 ms; TE, 4.3 ms; flip angle, 15°; 256 × 256 matrix; FOV, 256 mm; voxel size, 1 × 1 × 1 mm; 176 slices). Functional images were acquired using a T2*-weighted echo planar imaging (EPI) sequence (4 mm slice thickness; 32 slices; TR, 3700 ms; TE, 70 ms; flip angle, 90°; FOV, 256 mm; 64 × 64 matrix; voxel size, 4 × 4 × 4 mm; 92 scans per run). EPIs were obtained as ascending slices (with no gap) relative to the anterior—posterior commissural line.
Image preprocessing and statistical analyses were performed using SPM8 (Wellcome Department of Neurology, London, UK). To allow for T1 saturation effects, the first five images from each run were removed. All images were checked for excessive motion or artifact using ArtRepair (http://spnl.stanford.edu/tools/ArtRepair/Docs/ArtRepairHBM2009.html); none of the images showed evidence of either excessive motion or artifact. Differences in EPI slice acquisition timing were corrected using the central slice as reference. Imaging time series were then realigned to the first EPI image, and a mean realigned EPI image created. Motion was corrected using a rigid-body rotation and translation correction (Andersson et al., 2001). Each participant's T1 image was coregistered to the mean image and normalized to the SPM8 T1 template. The parameters from this transformation were then applied to all EPI images. Accuracy of registration between functional and structural data was assessed by visual inspection of the overlay of each individual subject's mean EPI and normalized structural image. Normalized EPIs were then smoothed with a 8 mm FWHM Gaussian kernel.
fMRI time series were analyzed by fitting a convolved canonical hemodynamic response function and its temporal derivative (Josephs et al., 1997) to the onset of the cue for each cue type separately. Trials associated with errors were modeled as a separate factor, resulting in four experimental regressors (repeat, switch-to, switch-away, errors). Realignment parameters were modeled as regressors of no interest to account for motion artifact in the data. For each subject, each run was modeled separately.
ROI analysis.
ROIs were selected based on the networks identified by Forstmann et al. (2008) and Frank et al. (2007). Anatomically defined ROIs were drawn onto the standard-space MNI152 template (voxel size, 2 × 2 × 2 mm) provided with FSLView (Functional MRI of the Brain Analysis Group, Oxford University, Oxford, UK; see Fig. 1B). A pre-SMA mask was defined with rostrocaudal boundaries ranging from y = 0 to y = 30, based on the mask used by Johansen-Berg et al. (2004). A mask was also drawn over the region joining the caudate and putamen (caudate–putamen junction, or CPJ mask). The selection of this striatal region was motivated by a previous finding (B. U. Forstmann, G. Dutilh, S. Brown, J. Neumann, D. Y. von Cramon, K. R. Ridderinkhof, and E.-J. Wagenmakers, unpublished data) that individual peak activations for threshold shifts under speed instructions lie between the caudate and putamen. Finally, an STN mask was derived from the structural 7 T MRI scans identified in the study by Forstmann et al. (2010). Each mask was drawn bilaterally, resulting in a total of six ROIs. These masks were applied to contrast maps comparing each cue type to baseline (repeat > baseline, switch-to > baseline, switch-away > baseline, herein referred to as repeat, switch-to, and switch-away contrasts, respectively). The mean contrast value within each ROI for each participant was extracted using MarsBar version 0.42 (Brett et al., 2002).
Mean contrast values for each ROI were analyzed with a 2 hemisphere (left, right) × 3 cue type (repeat, switch-to, switch-away) repeated-measures ANOVA. Critical values were adjusted using Greenhouse–Geisser correction (Vasey and Thayer, 1987). Significant effects of cue were examined using polynomial contrasts and simple comparisons with Bonferroni's correction. At each ROI, we examined correlations between mean ROI contrast value and response threshold value using Pearson's coefficients with one-tailed values given the directional nature of hypotheses and α = 0.05 (uncorrected).
Results
Response threshold showed a significant main effect of cue (F(2,38) = 10.76, p = 0.001), with a strong quadratic trend (p = 0.001; see Table 1). This resulted from the large increase in response threshold from repeat to switch-to cues (F(1,19) = 19.16, p < 0.001) and a smaller marginally significant difference between repeat and switch-away cues (F(1,19) = 5.78, p = 0.027).
ROI analyses
Figure 1B shows ROI masks and activation values in pre-SMA, CPJ, and STN. Pre-SMA activation showed a significant main effect of cue type (F(2,38) = 3.87, p = 0.039) and a significant cue type × hemisphere interaction (F(2,38) = 4.77, p = 0.025). All cue types showed deactivation relative to baseline, with greater deactivation in the right than the left hemisphere, especially for switch cues. The right pre-SMA showed a significant linear trend across repeat, switch-to, and switch-away cues (F(1,19) = 7.27, p = 0.014), with a significant difference between repeat and switch-away cues (F(1,19) = 7.27, p = 0.014) and a marginally significant difference between repeat and switch-to cues (F(1,19) = 4.73, p = 0.042). Weaker effects in the same direction were evident in the left pre-SMA.
Activation in the CPJ showed a significant main effect of cue type (F(2,38) = 12.32, p < 0.001). A strong linear decline in activation was found across cue type (F(1,19) = 28.24, p < 0.001) (Fig. 1B), and simple comparisons showed higher activation for repeat relative to switch-to cues (F(1,19) = 8.58, p = 0.009) and switch-away cues (F(1,19) = 28.24, p < 0.001). These differences were more pronounced in the left CPJ.
Although there was no significant effect of hemisphere or interaction with cue type (p > 0.10), the effect of cue type was significant when analyzing activation in the left STN alone (F(2,38) = 4.85, p = 0.016). Activation was smaller for switch-away cues than either repeat or switch-to cues (F(1,19) = 6.45, p = 0.02; F(1,19) = 10.38, p = 0.004, respectively). Although the right STN showed a similar pattern of findings, the effects were not significant.
Individual differences
We examined whether individual variation in cortico-basal ganglia activation was associated with variability in response threshold. Figure 1, C and F, shows significant negative correlations between right pre-SMA activity and response threshold estimates for repeat, switch-to, and switch-away cues. A significant negative correlation between CPJ activation bilaterally and response threshold was found for repeat cues only (Fig. 1D,F). In contrast, the right STN (Fig. 1E,F) showed positive correlations between contrast values and response threshold for both switch cue types. The correlation for switch-to cues was weakened with the removal of one participant whose right STN contrast value was an outlier (r = 0.33, p = 0.082). There was no significant correlation between contrast values in the STN and response threshold for repeat cues. It is important to note that these correlations must be interpreted with caution, because they were obtained with one-tailed, uncorrected α = 0.05.
Discussion
This study aimed to determine whether cortico-basal ganglia networks shown to be responsible for threshold shifts in two-choice decision-making paradigms (e.g., Forstmann et al., 2008) are also involved in threshold shifts in response to cues of different information value within a task-switching paradigm. The findings support a role of these networks in the adjustment of response threshold. In addition, they show that these models may be extended to higher-order threshold adjustment processes involved in setting an appropriate degree of conservativeness for an upcoming task-repetition or task-switch trial. Moreover, individual differences analyses delineate the distinct role of these cortical and basal ganglia regions in dynamically adjusting response threshold.
As predicted, repeat cues showed the greatest activation in pre-SMA. In addition, the pattern of cue type effects in the pre-SMA showed that this region was particularly sensitive to the degree of information provided by the cue, such that higher activation was elicited by repeat cues, followed by switch-to and switch-away cues. The parametric pattern of activation in pre-SMA in response to cue information is consistent with a prominent role in the preparation of action plans (Cunnington et al., 2005). Repeat cues that signal that the previous action set is to be maintained, result in very high readiness for action. Switch-to cues that signal that an abandoned action set needs to be reloaded result in less readiness for action and hence less pre-SMA activation than repeat cues. Switch-away cues do not signal which action set will need to be loaded and hence show the least preparation for action and the least pre-SMA activation.
In line with the pre-SMA findings, activation in the striatum was also larger for repeat cues relative to switch cues. Thus, the fronto-striatal network that is engaged to adjust response threshold in response to speed instructions on a two-choice decision-making task (Forstmann et al., 2008) was activated here in response to repeat cues, which specify with certainty which task will be required and that the demand for cognitive control will be low. In addition, a linear pattern of activation was seen across cue types in CPJ, similar to that found for pre-SMA. It is interesting to note that this pattern of effects is inconsistent with the quadratic pattern of threshold differences between cue types, which showed threshold increasing from repeat to switch-away to switch-to cues. Based on these effects, we would have expected less activation in these regions for switch-to relative to switch-away cues, but this was not the case. This inconsistency between threshold setting for switch cues and activation in these regions again supports the notion that this network is activated to adjust threshold in response to repeat cues only.
To further examine whether this was the case, we tested whether pre-SMA and striatal activation was associated with threshold estimates for each participant. Striatal activation was negatively correlated with threshold estimates for repeat cues only, consistent with the finding of Forstmann et al. (2008) that increased striatal activation is associated with more liberal response thresholds. However, we found negative correlations between right pre-SMA activation and threshold estimates for all cue types. Thus, although striatal activation was specifically associated with threshold setting in response to repeat cues, i.e., when participants were informed that a more liberal response regimen could be implemented on the upcoming trial, right pre-SMA activation was associated with threshold setting in response to any type of cue information.
This unexpected finding that pre-SMA is related to threshold setting regardless of cue type may be explained by previous anatomical tracing studies in monkeys showing projections between pre-SMA and dorsolateral prefrontal cortex (DLPFC) (Lu et al., 1994; Wang et al., 2005), a region coding for goal-directed behavior, including the maintenance and manipulation of action sets (Fassbender et al., 2006; Hester et al., 2007; Jamadar et al., 2010). The DLPFC is believed to increase baseline activity in motor-related and decision-related networks to control the speed–accuracy tradeoff (van Veen et al., 2008). Applied to our findings, this would predict that the DLPFC biases activation in pre-SMA according to the degree of cautiousness required for the upcoming task. Thus, pre-SMA may be involved in threshold setting whenever the need for some form of goal-directed behavior is required, whether this involves maintenance of a particular task (repeat cues) or disengagement from the currently active task (switch-to and switch-away cues).
Together, our findings suggest that pre-SMA biases the striatum to set an appropriate response threshold specifically in situations in which cues call for more liberal response regimens. This provides additional evidence that these two regions represent a “go” pathway that releases the motor system from global inhibition, thereby facilitating execution of rapid responses when minimal response conflict is encountered (Mink, 1996).
Also in line with our hypotheses, we found that activation in right STN was positively correlated with threshold estimates for both types of switch cues but not repeat cues. This provides strong evidence that the right STN plays a significant role in setting response threshold more conservatively so that more information can be accumulated before making a decision (Frank, 2006). These findings are inconsistent with the cue-related differences in left STN, which showed decreased activation for switch-away cues relative to repeat and switch-to cues. The present hemispheric differences offer the intriguing possibility of a dissociation in function between the left and right STN in terms of responsiveness to conflict. The decrease in activation for switch-away cues in the left STN is in line with Frank's suggestion that excessive uncertainty may result in the STN being switched off altogether. In contrast, the right STN appears to be involved in increasing response conservativeness when conflict is detected, despite not showing any overall change in activation depending on cue information. This discrepancy between hemispheres may be explained by the argument of Aron et al. (2007) for a right-lateralized network in which the STN is responsible for conflict-induced slowing. Thus, the right STN may be specifically involved in setting response criteria to produce slowing of output.
Our finding of right STN involvement in adjusting response caution is novel. Although Forstmann et al. (2008) found that response threshold adjustment was related to activation in a fronto-striatal network, including pre-SMA and striatum, they found no relationship with STN activation. This may have been attributable to the use of a whole-brain approach, which is less sensitive to activation in small regions such as the STN. In this study, we defined a very precise STN mask using 7 T structural scans from Forstmann et al. (2010), which allowed for a more sensitive analysis of STN involvement.
Finally, it should be noted that, although we have discussed differences between cue types within these ROIs as relative differences in activation, in some cases, we actually recorded deactivation relative to an implicit baseline. This effect was especially present in the pre-SMA, in which all cue types showed deactivation from baseline. Although, to our knowledge, no other study has shown this effect in pre-SMA, other studies have shown that nearby medial prefrontal regions, such as ACC, are deactivated in response to external cues demanding complex cognitive control (Lawrence et al., 2003; Hester et al., 2004). This suggests that the pre-SMA, along with regions in medial prefrontal cortex, may be globally inhibited in response to demanding cognitive tasks involving high levels of uncertainty and released from inhibition according to the ease with which action sets are retrieved.
Our findings reveal that prefrontal and basal ganglia regions play distinct roles in threshold adjustments depending on cue information. Although pre-SMA is involved in more general threshold adjustments in response to any type of information, the striatum and STN appear to control threshold adjustment under different circumstances. Bilateral striatum is involved specifically in threshold adjustments in situations in which the upcoming task is well defined in advance of the target, whereas the right STN is involved in shifting criteria when conflict between task sets is anticipated. These findings highlight the importance of considering basal ganglia networks in neural models of executive control processes in task switching (Karayanidis et al., 2010).
Footnotes
This work was supported by VENI (B.U.F.) from the Netherlands Organization for Scientific Research, an Australian Postgraduate Award and University of Newcastle Vice Chancellor's Award for Outstanding Research Higher Degree Candidate (E.L.M.), and a University of Newcastle Research Grant (F.K.).
References
- Andersson JL, Hutton C, Ashburner J, Turner R, Friston K. Modeling geometric deformations in EPI time series. Neuroimage. 2001;13:903–919. doi: 10.1006/nimg.2001.0746. [DOI] [PubMed] [Google Scholar]
- Aron AR, Behrens TE, Smith S, Frank MJ, Poldrack RA. Triangulating a cognitive control network using diffusion-weighted magnetic resonance imaging (MRI) and functional MRI. J Neurosci. 2007;27:3743–3752. doi: 10.1523/JNEUROSCI.0519-07.2007. [DOI] [PMC free article] [PubMed] [Google Scholar]
- Bogacz R, Wagenmakers EJ, Forstmann BU, Nieuwenhuis S. The neural basis of the speed-accuracy tradeoff. Trends Neurosci. 2010;33:10–16. doi: 10.1016/j.tins.2009.09.002. [DOI] [PubMed] [Google Scholar]
- Brett M, Anton JL, Valabregue R, Poline JB. Region of interest analysis using the MarsBar toolbox for SPM99. Presented at the Eighth International Conference on Functional Mapping of the Human Brain; June 2–6; Sendai, Japan. 2002. [Google Scholar]
- Cunnington R, Windischberger C, Moser E. Premovement activity of the pre-supplementary motor area and the readiness for action: studies of time-resolved event-related functional MRI. Hum Mov Sci. 2005;24:644–656. doi: 10.1016/j.humov.2005.10.001. [DOI] [PubMed] [Google Scholar]
- Fassbender C, Foxe JJ, Garavan H. Mapping the functional anatomy of task preparation: priming task-appropriate brain networks. Hum Brain Mapp. 2006;27:819–827. doi: 10.1002/hbm.20223. [DOI] [PMC free article] [PubMed] [Google Scholar]
- Fleming SM, Thomas CL, Dolan RJ. Overcoming status quo bias in the human brain. Proc Natl Acad Sci U S A. 2010;107:6005–6009. doi: 10.1073/pnas.0910380107. [DOI] [PMC free article] [PubMed] [Google Scholar]
- Forstmann BU, Dutilh G, Brown S, Neumann J, von Cramon DY, Ridderinkhof KR, Wagenmakers EJ. Striatum and pre-SMA facilitate decision-making under time pressure. Proc Natl Acad Sci U S A. 2008;105:17538–17542. doi: 10.1073/pnas.0805903105. [DOI] [PMC free article] [PubMed] [Google Scholar]
- Forstmann BU, Anwander A, Schäfer A, Neumann J, Brown S, Wagenmakers EJ, Bogacz R, Turner R. Cortico-striatal connections predict control over speed and accuracy in perceptual decision making. Proc Natl Acad Sci U S A. 2010;107:15916–15920. doi: 10.1073/pnas.1004932107. [DOI] [PMC free article] [PubMed] [Google Scholar]
- Frank MJ. Hold your horses: a dynamic computational role for the subthalamic nucleus in decision making. Neural Networks. 2006;19:1120–1136. doi: 10.1016/j.neunet.2006.03.006. [DOI] [PubMed] [Google Scholar]
- Frank MJ, Scheres A, Sherman SJ. Understanding decision-making deficits in neurological conditions: insights from models of natural action selection. Philos Trans R Soc Lond B Biol Sci. 2007;362:1641–1654. doi: 10.1098/rstb.2007.2058. [DOI] [PMC free article] [PubMed] [Google Scholar]
- Grasman RP, Wagenmakers EJ, van der Maas HL. On the mean and variance of response times under the diffusion model with an application to parameter estimation. J Math Psychol. 2009;53:55–68. [Google Scholar]
- Hester R, D'Esposito M, Cole MW, Garavan H. Neural mechanisms for response selection: comparing selection of responses and items from working memory. Neuroimage. 2007;34:446–454. doi: 10.1016/j.neuroimage.2006.08.001. [DOI] [PubMed] [Google Scholar]
- Hester RL, Murphy K, Foxe JJ, Foxe DM, Javitt DC, Garavan H. Predicting success: patterns of cortical activation and deactivation prior to response inhibition. J Cogn Neurosci. 2004;16:776–785. doi: 10.1162/089892904970726. [DOI] [PubMed] [Google Scholar]
- Jamadar S, Hughes M, Fulham WR, Michie PT, Karayanidis F. The spatial and temporal dynamics of anticipatory preparation and response inhibition. Neuroimage. 2010;51:432–449. doi: 10.1016/j.neuroimage.2010.01.090. [DOI] [PubMed] [Google Scholar]
- Johansen-Berg H, Behrens TE, Robson MD, Drobnjak I, Rushworth MF, Brady JM, Smith SM, Higham DJ, Matthews PM. Changes in connectivity profiles define functionally distinct regions in human medial frontal cortex. Proc Natl Acad Sci U S A. 2004;101:13335–13340. doi: 10.1073/pnas.0403743101. [DOI] [PMC free article] [PubMed] [Google Scholar]
- Josephs O, Turner R, Friston K. Event-related fMRI. Hum Brain Mapp. 1997;5:243–248. doi: 10.1002/(SICI)1097-0193(1997)5:4<243::AID-HBM7>3.0.CO;2-3. [DOI] [PubMed] [Google Scholar]
- Karayanidis F, Mansfield EL, Galloway KL, Smith JL, Provost A, Heathcote A. Anticipatory reconfiguration elicited by fully and partially informative cues that validly predict a switch in task. Cogn Affect Behav Neurosci. 2009;9:202–215. doi: 10.3758/CABN.9.2.202. [DOI] [PubMed] [Google Scholar]
- Karayanidis F, Jamadar S, Ruge H, Phillips N, Heathcote A, Forstmann BU. Advance preparation in task-switching: converging evidence from behavioral, brain activation, and model-based approaches. Front Psychol. 2010;1:25. doi: 10.3389/fpsyg.2010.00025. [DOI] [PMC free article] [PubMed] [Google Scholar]
- Lawrence NS, Ross TJ, Hoffmann R, Garavan H, Stein EA. Multiple neuronal networks mediate sustained attention. J Cogn Neurosci. 2003;15:1028–1038. doi: 10.1162/089892903770007416. [DOI] [PubMed] [Google Scholar]
- Lu MT, Preston JB, Strick PL. Interconnections between the premotor cortex and prefrontal areas. J Comp Neurol. 1994;341:375–392. doi: 10.1002/cne.903410308. [DOI] [PubMed] [Google Scholar]
- Mink JW. The basal ganglia: focused selection and inhibition of competing motor programs. Prog Neurobiol. 1996;50:381–425. doi: 10.1016/s0301-0082(96)00042-1. [DOI] [PubMed] [Google Scholar]
- Ratcliff R. A theory of memory retrieval. Psychol Rev. 1978;85:59–108. [Google Scholar]
- van Veen V, Krug MK, Carter CS. The neural and computational basis of controlled speed-accuracy tradeoff during task performance. J Cogn Neurosci. 2008;20:1952–1965. doi: 10.1162/jocn.2008.20146. [DOI] [PubMed] [Google Scholar]
- Vasey MW, Thayer JF. The continuing problem of false positives in repeated measures ANOVA in psychophysiology: a multivariate solution. Psychophysiology. 1987;24:479–486. doi: 10.1111/j.1469-8986.1987.tb00324.x. [DOI] [PubMed] [Google Scholar]
- Wang Y, Isoda M, Matsuzaka Y, Shima K, Tanji J. Prefrontal cortical cells project to the supplementary eye field and the presupplementary motor area in the monkey. Neurosci Res. 2005;53:1–7. doi: 10.1016/j.neures.2005.05.005. [DOI] [PubMed] [Google Scholar]