

Abstract
Background
Pharmaceuticals are important interventions that could improve people's health. Pharmaceutical pricing and purchasing policies are used as cost‐containment measures to determine or affect the prices that are paid for drugs. Internal reference pricing establishes a benchmark or reference price within a country which is the maximum level of reimbursement for a group of drugs. Other policies include price controls, maximum prices, index pricing, price negotiations and volume‐based pricing.
Objectives
To determine the effects of pharmaceutical pricing and purchasing policies on health outcomes, healthcare utilisation, drug expenditures and drug use.
Search methods
We searched the Cochrane Central Register of Controlled Trials (CENTRAL), part of The Cochrane Library (including the Effective Practice and Organisation of Care Group Register) (searched 22/10/2012); MEDLINE In‐Process & Other Non‐Indexed Citations and MEDLINE, Ovid (searched 22/10/2012); EconLit, ProQuest (searched 22/10/2012); PAIS International, ProQuest (searched 22/10/2012); World Wide Political Science Abstracts, ProQuest (searched 22/10/2012); INRUD Bibliography (searched 22/10/2012); Embase, Ovid (searched 14/12/2010); NHSEED, part of The Cochrane Library (searched 08/12/2010); LILACS, VHL (searched 14/12/2010); International Political Science Abstracts (IPSA), Ebsco (searched (17/12/2010); OpenSIGLE (searched 21/12/10); WHOLIS, WHO (searched 17/12/2010); World Bank (Documents and Reports) (searched 21/12/2010); Jolis (searched 09/10/2011); Global Jolis (searched 09/10/2011) ; OECD (searched 30/08/2005); OECD iLibrary (searched 30/08/2005); World Bank eLibrary (searched 21/12/2010); WHO ‐ The Essential Drugs and Medicines web site (browsed 21/12/2010).
Selection criteria
Policies in this review were defined as laws; rules; financial and administrative orders made by governments, non‐government organisations or private insurers. To be included a study had to include an objective measure of at least one of the following outcomes: drug use, healthcare utilisation and health outcomes or costs (expenditures); the study had to be a randomised trial, non‐randomised trial, interrupted time series (ITS), repeated measures (RM) study or a controlled before‐after study of a pharmaceutical pricing or purchasing policy for a large jurisdiction or system of care.
Data collection and analysis
Two review authors independently extracted data and assessed the risk of bias. Results were summarised in tables. There were too few comparisons with similar outcomes across studies to allow for meta‐analysis or meaningful exploration of heterogeneity.
Main results
We included 18 studies (seven identified in the update): 17 of reference pricing, one of which also assessed maximum prices, and one of index pricing. None of the studies were trials. All included studies used ITS or RM analyses. The quality of the evidence was low or very low for all outcomes. Three reference pricing studies reported cumulative drug expenditures at one year after the transition period. Two studies reported the median relative insurer's cumulative expenditures, on both reference drugs and cost share drugs, of ‐18%, ranging from ‐36% to 3%. The third study reported relative insurer's cumulative expenditures on total market of ‐1.5%. Four reference pricing studies reported median relative insurer's expenditures on both reference drugs and cost share drugs of ‐10%, ranging from ‐53% to 4% at one year after the transition period. Four reference pricing studies reported a median relative change of 15% in reference drugs prescriptions at one year (range ‐14% to 166%). Three reference pricing studies reported a median relative change of ‐39% in cost share drugs prescriptions at one year (range ‐87% to ‐17%). One study of index pricing reported a relative change of 55% (95% CI 11% to 98%) in the use of generic drugs and ‐43% relative change (95% CI ‐67% to ‐18%) in brand drugs at six months after the transition period. The same study reported a price change of ‐5.3% and ‐1.1% for generic and brand drugs respectively six months after the start of the policy. One study of maximum prices reported a relative change in monthly sales volume of all statins of 21% (95% CI 19% to 24%) after one year of the introduction of this policy. Four studies reported effects on mortality and healthcare utilisation, however they were excluded because of study design limitations.
Authors' conclusions
The majority of the studies of pricing and purchasing policies that met our inclusion criteria evaluated reference pricing. We found that internal reference pricing may reduce expenditures in the short term by shifting drug use from cost share drugs to reference drugs. Reference pricing may reduce related expenditures with effects on reference drugs but the effect on expenditures of cost share drugs is uncertain. Reference pricing may increase the use of reference drugs and may reduce the use of cost share drugs. The analysis and reporting of the effects on patients' drug expenditures were limited in the included studies and administration costs were not reported. Reference pricing effects on health are uncertain due to lack of evidence. The effects of other purchasing and pricing policies are until now uncertain due to sparse evidence. However, index pricing may reduce the use of brand drugs, increase the use of generic drugs, and may also slightly reduce the price of the generic drug when compared with no intervention.
Plain language summary
The effect of pricing policies for pharmaceuticals
Researchers in The Cochrane Collaboration conducted a review of the effect of reference pricing and other pricing policies for pharmaceuticals. In 2012, they searched for all relevant studies and finally included 18 studies. Their findings are summarised below.
What are reference pricing and other pricing policies for pharmaceuticals?
Large amounts of healthcare funds are spent on medicines and these amounts are increasing. Spending more on medicines could mean less money for other healthcare or non‐health care services. Health insurers are therefore looking for ways of controlling the costs of medicines while still ensuring that patients get the medicines they need.
One approach that health insurers can use is reference pricing. Here insurers group together medicines that have the same active ingredients or that are used for the same purpose and are just as effective and safe. They then set a 'reference price' that they are willing to pay. If the patient chooses the 'reference medicine', his expenses will be paid. If he chooses a more expensive medicine he will have to pay the difference.
Another approach is index pricing. Again, insurers group together similar medicines. They then set an 'index price' that they refund to pharmacies each time they dispense a medicine from this group. As the pharmacy is refunded the same amount for any of the medicines in this group it is in their interest to dispense a medicine that costs less than the index price.
A number of other pricing policies also exist that aim to control medicine costs. It is assumed that these types of policies can lead patients to switch to cheaper medicines and can encourage medicine producers to lower their prices.
What happens when new payment policies are introduced?
Most of the studies focused on the effect of reference pricing. These studies looked at the impact of reference pricing one year after it was introduced. They showed that this policy may lead to:
‐ an increase in 'reference medicine' prescriptions and a decrease in prescriptions for more expensive medicines (low certainty of evidence);
‐ a decrease in the amount of money insurers spend on medicines overall (low certainty of evidence).
None of these studies looked at the effect of reference pricing on people’s health, their use of healthcare services, or adverse effects.
A summary of this review for policy‐makers is availablehere
Summary of findings
Background
See Additional Table 5 for a list of abbreviations used in this review.
1. Abbreviations.
| Abbreviations | Complete name |
| ACE | Angiotensin converting enzyme |
| ARIMA | Autoregressive integrated moving average |
| CBA | Controlled before and after |
| CCB | Dihydropyridine channel blocker |
| CRM | Controlled repeated measures |
| EPOC | Effective Practice and Organisation of Care |
| H2RA | Histamine‐2 receptor antagonist |
| INN | International non‐proprietary name |
| ITS | Interrupted time series |
| OECD | Organisation for Economic Co‐operation and Development |
| PPI | Proton pump inhibitors |
| PPRS | Pharmaceutical Price Regulation Scheme |
| RCT | Randomised controlled trial |
| RM | Repeated measures |
| ROR | Rate of return |
| RP | Reference pricing |
| RR | Risk ratio (intervention vs control group) |
| RR (adj) | Risk ratio (adjusted for pre‐intervention differences) = RR post‐intervention/RR pre‐intervention |
| WHO | World Health Organization |
Description of the condition
Pharmaceuticals can be important for people's health. At the same time drugs are major components of healthcare costs. Organisation for Economic Co‐operation and Development (OECD) countries spent USD 569 billion on pharmaceuticals (excluding pharmaceuticals for in‐patients) in 2005; US pharmaceutical expenditure amounted to USD 235 billion, accounting for 41% of total expenditure on pharmaceuticals in OECD countries (OECD 2008). Pharmaceutical expenditure in Mexico represents 21% of total health spending, exceeding the average of OECD countries; and in 2003 88% of pharmaceutical expenditure in Mexico was out of pocket expenditure (Moïse 2008).
Data on total pharmaceutical expenditure for 2006 confirm that pharmaceuticals account for an important share of all expenditure on health. This proportion varies considerably between high‐ and low‐income countries; pharmaceutical spending as a share of total health expenditure ranges from a mean of 19.7% in the high‐income countries to a mean of 30.4% in the low‐income countries (WHO 2011). Per capita pharmaceutical expenditures in 2005 and 2006 ranged from USD 7.61 in low‐income countries to USD 431.6 in high‐income countries and, compared to 1995, the rate of increase is greater in middle‐ and low‐income countries (WHO 2011). These increases put pressure on policy makers and insurers to control drug expenditure and to do this without causing adverse effects on health or increasing healthcare utilisation or other costs.
Description of the intervention
Pharmaceutical pricing and purchasing policies intend to determine or affect the prices that are paid for drugs. They can be targeted at different components of drug prices, such as wholesale prices, retail prices, drug taxes and reimbursement prices. Examples are price controls, maximum prices, price negotiations, reference pricing, index pricing and volume‐based pricing policies. Although this review also deals with purchasing policies, for simplicity we will use the term pricing policies (Table 6).
2. Intervention description.
| STUDY ID / INTERVENTION PERIOD IN STUDY | DRUGS INCLUDED IN ANALYSIS | INTENSITY AND INCENTIVES | EXEMPTIONS |
| POLICY: REFERENCE PRICING | |||
|
Aronsson 2001 1993‐1996 |
12 different brand drugs: cimetidine, furosemide, atenolol, pindolol, propranolol, indomethacin, naproxen, allopurinol, paracetamol/codeine, diazepam, clomipramine, timolol | Reference price: 10% above the price of the least expensive generic substitute | No information provided |
|
Brekke 2011 2003 |
Drugs included in the analysis: brand‐names and generics and pharmaceutical expenditures | Under a reference pricing (RP) system, firms are free to set drug prices, but patient copayment is based on a RP, that is set by a regulator.More specifically, if a consumer chooses a drug that is priced higher than the RP, she has to pay the full difference between the RP and the actual drug price. Usually, the RP is set at a level somewhere between the lowest and highest drug price in the market. | No information provided |
|
Grootendorst 2002 For nitrates: October/November 1995 to May 1999 (March 1998 for some outcomes). For ACE inhibitors and CCBs: January 1997 to March 1998 |
Nitrates (used for stable angina) for long term prophylaxis, ACE inhibitors (used for hypertension, congestive heart failure and diabetic nephropathy) and dihydropyridine CCBs (used for hypertension and stable angina) | Reference price: Nitrates: Price of lowest priced regular‐release ISDN. ACE inhibitors and dihydropyridine CCBs: A fixed cost per 30 day supply. Incentives for physicians to prescribe lower dosages to not exceed monthly cap. Costs for the least‐expensive captopril, quinapril, and ramipril preparations available in pharmacies were covered. For other ACE inhibitors (enalapril, lisinopril, fosinopril, cilazapril, benazepril) patients were required to pay the difference, ranging from 2 to 62 Canadian Dollars per monthly supply. Reference prices in Canadian Dollar per 30 day supply were about 11 for H2RAs, 31 for dCCBs, 4 for nitrates and 27 for ACE inhibitors. Price year not reported. | Special authority exemptions*: Nitrates, ACE inhibitors, CCBs. Therapeutic trial exemptions**: ACE inhibitors, CCBs. Automatic exemptions: Users of asthma or diabetes drugs: ACE inhibitors, CCBs. Residents of long term facilities: Nitrates. Prescriptions dispensed by specific specialists: CCBs, Nitrates. Some transdermal nitroglycerin patches were exempted from the reference pricing from January 1996 and March 1996. Suffciently low doses (not exceeding reference price for 30 day supply) were exempted from the reference pricing: ACE inhibitors, CCBS, nitrates (after September 1, 1998). |
|
Grootendorst 2005 Pharmacare introduced two different forms of RP to the NSAIDs, Type 1 in April 1994 and Type 2 in November 1995 |
Drug class NSAIDs | Under the policy, the less costly 'unrestricted' NSAIDs, enteric‐coated acetylsalicylic acid (ASA) (650 mg), ibuprofen, and naproxen remained fully reimbursed (at an average rate of about $0.23 daily). Pharmacare also began to reimburse acetaminophen (500 mg). The decision to provide full reimbursement for acetaminophen, ASA, ibuprofen, and naproxen was consistent with earlier recommendations by an independent academic research group, the BC Therapeutics Initiative, that these drugs be used as first line therapy for osteoarthritis (Therapeutics Initiative 1995). | Patients intolerant of unrestricted NSAIDS or with specific diagnoses (rheumatoid arthritis, psoriatic arthritis, ankylosing spondylitis, collagen vascular disease, or gout) were eligible for exemption from the policy. Exemption for a ‘‘second line restricted’’ NSAID (nabumetone, piroxicam, tenoxicam, tiaprofenic acid, to‐ lmetin, sulindac, ketorolac, or diclofenac potassium) required failure on a first line restricted NSAID. |
|
Grootendorst 2006 Jan 1994 to December 2000 |
ACE inhibitors and CCBs | Reference pricing (RP) limits drug plan reimbursement of interchangeable medicines to a reference price, which is typically equal to the price of the lowest‐cost interchangeable drug. | Under the RP policy, Pharmacare reimbursement of the ACE inhibitors enalapril, lisinopril, fosinopril, cilazapril, and benazepril was limited to $27 per month; the lower‐cost ACE inhibitors, captopril, quinapril, and ramipril remained fully reimbursed. Reimbursement of the dihydropyridine CCBs nifedipine, nicardipine and amlodipine was limited to $31 per month; felodipine remained fully reimbursed. Also, reimbursement of the sustained release forms of the CCBs diltiazem and verapamil was limited to the price of regular release versions of the equivalent dosage sizes of the same drugs. Beneficiaries who required a higher‐cost anti‐ hypertensive for medical reasons could be exempted from RP upon written petition by the physician. |
|
Hazlet 2002 October 1995 to March 1996 |
Histamine2 receptor antagonists | Reference prices per 30 day supply were about 11 Canadian dollars for H2RAs (See Grootendorst 2002), lowest priced H2RA available. Special authority restrictions for reimbursement of PPIs, made H2RAs more attractive. | Special authority exemptions*. Exemptions for low doses |
|
Kibicho 2012 2003 |
1. Antihypertensive drugs 2. Antihyperlipidemic drugs 3. Generic drugs 4. Brand‐name drugs |
The maximum allowable cost is a ceiling price set for generic and multisource brands that are chemically equivalent and have the same active ingredients (generic substitutes). Maximum allowable cost is similar to reference pricing used in Canada, which extends the concept of drug interchangeability to include chemically related active ingredients that are pharmacologically equivalent (therapeutic substitutes).Instituting maximum allowable cost is the only policy designed to directly reduce the cost of generic drugs by limiting the amount that Medicaid can reimburse pharmacies. | No information provided |
|
Marshall 2002 October 1995 to May 1999 |
Histamine2 receptor antagonists | See Hazlet 2002 | See Hazlet 2002 |
| McManus 2001 June 1997 to December 1997 | Ranitidine | The policy operated where there was more than one brand of a drug available through the Pharmaceutical Benefit Scheme and where the brands where therapeutically interchangeable. Generic substitution allowed. Premium on original brand Ranitidine 150 mg and 300 mg: $0,71 in May 1997. Price year not reported. | No information provided |
|
Moreno‐Torres 2011 December 2000 |
This system was applied to products with the same active ingredient, pharmaceutical form, dosage and number of units for which there was at least one generic | For each group, a reference price was calculated as the weighted average selling price of the cheapest drug accounting for at least 20% of the market. This system established the maximum price that could be reimbursed by the NHS for any version of the same drug. | No information provided |
|
Narine 2001 October 1995 to November 1996 |
Histamine2 receptor antagonists | See Hazlet 2002 | See Hazlet 2002 |
|
Pavcnik 2002 Oral antidiabetics: The first batch of reference pricing: 1989 to 1996 The second batch of reference pricing: 1994 to 1996 Anti‐ulcer drugs 1992 to 1996 |
Oral antidiabetics and anti‐ulcer drugs | No information provided | No information provided |
|
Puig 2007 January 2001 to October 2004 |
Oral HMG‐CoA reductase inhibitors (statins): atorvastatin, fluvastatin, lovastatin, pravastatin, simvastatin and cerivastatin | Reference pricing (RP) is a reimbursement policy that sets a maximum allowable cost that will be covered,RP systems can be grouped into different levels according to drug interchangeability. In September 2001 the Andalusian Public Health Service (henceforth APHS) introduced a new pharmaceutical procurement mechanism based on a more “intensive” RP system, including maximum prices. The previous situation was characterized by the absence of incentives to prescribe lower‐cost drugs with the same active ingredient, and by the absence of incentives for brand firms to lower prices even in the presence of lower‐priced generics. Seasonal fluctuations were controlled by including a term for August in the regression model. Seasonal variation is observed in the monthly periods resulting in a significant decrease during summer holidays (August). |
No information provided |
|
Sawyer 1983 September 1976 to October 1979 |
52 dosage forms of 25 multisource chemical entities, including ampicillin, chlordiazepoxide HCL(Librium), penicillin VK, propoxyphene HCL (Darvon) and tetracykline | State of Maryland used Maximum Allowable Costs ‐ Estimated Acquisition Costs (MAC‐EAC) procedures to reimburse community pharmacists for outpatient drugs dispensed to Medicaid patients. Maryland pharmacies billed Medicaid their usual and customary charges to the general public. Medicaid officials then determined the allowable cost for each claim by comparing billed charges against the appropriate MAC and/or EAC limits. Pharmacies were reimbursed the lowest established level (+ the flat dispensing fee). | No information provided |
| Schneeweiss 2002 January 1997 ‐ April 1998 (for the outcome drug use) | ACE inhibitors | See Grootendorst 2002 | See Grootendorst 2002 |
| Schneeweiss 2003 January 1997 to April 1998 | CCBs | See Grootendorst 2002 | See Grootendorst 2002 |
|
Stargardt 2010 January 2003 to December 2006 |
Atorvastatin and other statins | Reference pricing has been the subject of great debate since its introduction in Germany in 1989, the inclusion of statins was on 1 January 2005. Atorvastatin was classified as a ‘‘me‐too’’ drug and grouped with other statins, including generics. Additional co‐payments due to reference pricing for atorvastatin ranged from € 18.17 per package (30 mg/30 units) to € 109.00 per package (80 mg/100 units). As a result, pre‐ policy users of atorvastatin had to decide whether to switch to another statin to avoid additional co‐payments or to pay the difference between the price of atorvastatin and its reference pricing. |
In contrast to reference pricing in British Columbia, the German reference pricing system does not allow requests for exemption on a case‐by‐case basis, nor does it allow specific subgroups of patients to be excluded from the scheme |
| POLICY: INDEX PRICING | |||
|
Brekke 2003 1998‐2003 |
Six groups of active substances: cetirizin (treatment of allergy), citalopram (antidepressant), enalapril (antihypertensive), lisinopril (antidepressant), loratadin (treatment of allergy) and omeprazol (treatment of gastro‐intestinal disorders) | The levels of index prices relative to the prices of substitute drugs were not reported by the authors. | When prescribing physician proscribes substitution of a generic in pharmacies |
| POLICY: MAXIMUM PRICES | |||
|
Puig 2007 2004 |
Oral HMG‐CoA reductase inhibitors (statins): atorvastatin, fluvastatin, lovastatin, pravastatin, simvastatin and cerivastatin | In September 2001 the Andalusian Public Health Service (henceforth APHS) introduced a new pharmaceutical procurement mechanism based on a more “intensive” RP system, including maximum prices. In the APHS the reference price level is set at the level of the higher price of the two lowest‐priced products for each active ingredient with the same package size and dose strength. This system only works when and if physicians prescribe the active ingredient of the product. The pharmacies agreed with the regional government to dispense the lowest‐priced product for each active ingredient, independently of its generic status. In addition, economic incentives were introduced for physicians to prescribe using the non‐commercial name of the active ingredient. | No information reported |
* Pharmacare may give special authority exemptions, based on therapeutic reasons provided by the physician in an application. Special authority exemptions were valid indefinitely for ACE inhibitors, CCBs and nitrates (after January 21, 1997) users. See Grootendorst 2002.
** The physicians may apply for therapeutic trial exemptions in cases of intolerance or treatment failure or if the patient is frail. See Grootendorst 2002.
*** In British Columbia Pharmacare covers all prescription drug costs for seniors with a dispensing deductible fee of CAD 200. Others can obtain similar coverage, but must pay a monthly.
These policies can have an impact on drug expenditure in two main ways, directly through price changes, and indirectly through drug use changes related to the price changes. Furthermore, the split between third party and patient expenditure can be influenced. Since pharmaceutical pricing policies might affect drug use they could also have effects on health and utilisation of other healthcare services.
Pharmaceutical prices consist of different components reflecting who is receiving the payments: the manufacturers' prices, wholesalers' prices and retailers' prices. At each of these steps there are mark ups and possibly tax components. Pricing policies can be targeted at one or more of these specific components.
In most European Union countries pharmaceutical prices are controlled at the manufacturer level and by statutory pricing policy, where the authorities set the price on a regulatory basis. Most of the countries that are members of the Pharmaceutical Pricing and Reimbursement Information Project (PPRI) apply price control only to pharmaceuticals that are eligible for reimbursement (Vogler 2008). This is not the case for recent pharmaceutical pricing policies applied in Latin American countries, such as Colombia (Vacca 2011). Pharmacy margins are regulated in most European Union countries by regressive schemes in which pharmacy remuneration occurs via a fixed fee (Vogler 2008).
Reference drug pricing
Reference prices can be established based on external prices (from other countries) or internal prices (within a country). Using the price(s) of a medicine in one or several countries to derive a benchmark or reference price for the purpose of setting or negotiating the price of medicines in a given country is described as external price referencing by the Worlg Health Organization (WHO) Collaborating Centre for Pharmaceutical Pricing and Reimbursement Policies Glossary (PHIS 2011). Using the price(s) of identical medicines (ATC 5 level) or similar medicines (ATC 4 level) or therapeutically equivalent treatments within a country to derive a benchmark or reference price for the purpose of setting or negotiating the price or reimbursement of medicines in a given country is described as internal price referencing by the WHO Collaborating Centre for Pharmaceutical Pricing and Reimbursement Policies Glossary (PHIS 2011). Different terms have been used for reference drug pricing policies, including reference pricing, reference‐based pricing, maximum allowable costs, best available prices, and minimum pricing.
For reimbursement purposes the internal reference pricing makes patients aware of price differences by giving them the responsibility to pay for the difference. However, it does not restrict the drug producers', wholesalers' or retailers' freedom to set drug prices. The policy sets the reimbursement price and thus implicitly the payments by patients. This can lead patients to switch from more expensive to cheaper drugs, and thus decrease the sales for the producers of the more expensive drugs. The producers would then have incentives to reduce prices so that market shares would not be lost. Drugs that are assessed as therapeutically similar (here called a reference drug group) a reference drug (or a group of reference drugs) is chosen. The price of the reference drug is reimbursed (except for ordinary copayment). For drugs that are more expensive than the reference drug, the patient has to pay the expenses above the reference price. These are called cost share drugs. Policies that set reimbursement prices, like some reference pricing policies, are similar to copayment policies since both influence what the third party payer and patients pay for the drugs. The difference is that patients can choose to use the reference drug and thus not have to pay a reference premium, whereas with copayments patients have to pay a portion of the cost regardless of which drug they use within a drug group (Austvoll‐Dahlgren 2008).
Reference drug pricing can be applied to different levels of drug groups (Dickson 1998; Galizzi 2011; Ioannides‐Demos 2002; McLaughin 1997). At the highest level therapeutic groups are included, as all drugs used to treat a particular condition (for example all drugs for hypertension) or drugs included in the same Anatomical Therapeutic Chemical (ATC) classification system group (for example statins, angiotensin converting enzyme (ACE) inhibitors). At a more specific level competitors' drugs for International Nonproprietary Names (INN) are included, as used in Germany, Australia and US. These drugs could be considered as chemically equivalent drugs or multisource chemical entities, or could also be classified as brand name drugs and generic drugs.
Index pricing
An index price is the maximum refundable price to pharmacies for drugs within an index group (Brekke 2003). An index group consists of therapeutically interchangeable drugs. The index price is updated quite frequently (for example every third month) and is based on the volume weighted average of prices in the index group. The price is refunded independently of which drug is dispensed. Since the pharmacy keeps the difference between the index price and the price of any drug in the index group, pharmacies have economic incentives to dispense a drug that is priced lower than the index price. Thus, the hypothesis is that the pharmacies will dispense more of the cheaper drugs, which will lead to a lower index price when that price is adjusted, which occurs frequently. A lower index price will then lead to lower reimbursements and thus reduced third party drug expenditures. An increase in the dispensing of cheaper drugs could also increase the producers' incentives to lower the drug prices so that their market shares will not decrease.
Maximum prices
Maximum or ceiling price is a fixed price that attempts to secure pharmaceutical prices that are considered ‘reasonable’ for a given health system. There are different approaches to set the maximum prices: negotiated prices, price‐caps, cost‐plus, price comparisons to other countries or to similar products within the same country, or price‐volume trade‐offs (Mossialos 2004). This is a cost‐containment measure that fixes ex‐ante the maximum price of medicines, for example taking into consideration inflation rates and production cost. Companies are allowed to choose any price below this threshold, described as price cap or price ceiling by the WHO Collaborating Centre for Pharmaceutical Pricing and Reimbursement Policies Glossary (PHIS 2011).
Profit regulation
Rates of return on pharmaceutical companies' capital can be regulated by the government or negotiated between the government and the companies, as under the Pharmaceutical Price Regulation Scheme (PPRS) in the UK (Borrell 1999). This can indirectly influence drug prices by setting profit limits. The PPRS is based on periodic negotiations between the Association of the British Pharmaceutical Industry and the Department of Health. It is reviewed every few years (PPRS 2009). If profits exceed a certain level, the company must reduce profits by cutting prices, delaying or restricting previously agreed future price increases, or repaying the excess profit to the Department of Health.
Stepped price model
Prices can be adjusted when patents expire (Norwegian Pharmacy Association 2008). For example, in Norway a stepped price model was introduced in January 2005. In this model a maximum reimbursement price is set for affected drugs (both branded and generics). The maximum price is automatically reduced in steps following generic competition after patent expiry. The size of the price cut steps depends on the sales volumes prior to establishment of generic competition and the time since competition was established (Festoy 2008).
Other pricing policies
These include direct price controls, price negotiations, volume‐based pricing, procurement and rebate policies. Direct price controls involve setting prices on a product by product basis. The prices can be set by the authorities or negotiated with the manufacturer. The price level can be fixed or a maximum price can be set, leaving the supplier free to set the price lower or equal to the maximum price. When setting or negotiating the price, several considerations can be taken into account: costs of products, prices in comparable countries, therapeutic value of the product, evidence of clinical effectiveness and safety, and price‐volume arrangements (Productivity 2001).
Under a price‐volume arrangement the agreed drug price is based on a forecast volume of sales. If the actual volume exceeds the forecast, the drug price usually has to be lowered. Pricing regulation may apply to initial or posterior prices once products are marketed, and can be based on prices for the same product in other countries or on the costs of similar treatments for the same indication (Espin 2007).
Reimbursement decisions and pricing for new drugs can also be based on economic evaluations of the new treatment compared with existing options (Espin 2007).
Each of these interventions could generate important potential adverse effects or unintended effects that should be addressed.
Why it is important to do this review
Recently Galizzi 2011 provided an updated survey of original scientific studies on the effect of reference pricing policies in OECD countries, including results from searches of the PubMed database from 1966 to September 2009, EconLit and Web of Knowledge from 1979 to September 2009. This survey of the literature included theoretical and empirical studies.
There are recent reviews on some pricing policies, like reference pricing (Danzon 2008; Puig‐Junoy 2010), and systematic reviews of pharmaceutical policies that include some pricing policies (Faden 2011; Puig‐Junoy 2010a). Most of these reviews are limited in scope and identified poor quality studies with limited internal and external validity.
Complementary reviews on other pharmaceutical policies include Cochrane reviews of caps and copayments, financial incentives for prescribers, and restrictions on reimbursement (including prior authorisation policies) (Aaserud 2006a; Austvoll‐Dahlgren 2008; Green 2010; Sturm 2007) and another systematic review of prior authorisation of pharmaceutical prescriptions (Puig‐Junoy 2007).
The cost of pharmaceuticals has a tremendous impact on health systems and hence on population health. This is true for high‐income countries and is critical for low‐ and middle‐income countries, where prioritisation of resources is even more essential. Most European countries have adopted reference pricing systems and some Latin American countries, such as Brazil (Espin 2011) and Colombia (Vacca 2011), have pricing policies that use external price referencing.
To our knowledge other systematic reviews of pricing and purchasing policies have not been kept up to date. Our aim was to support informed decisions about pharmaceutical policies and to guide future evaluations by updating a comprehensive summary of what is known from well‐designed research about the effects of alternative pricing and purchasing policies on drug use, healthcare utilisation, health outcomes and costs (expenditures).
Objectives
To determine the effects of pharmaceutical pricing and purchasing policies on health outcomes, healthcare utilisation, drug expenditures (costs) and drug use.
Methods
Criteria for considering studies for this review
Types of studies
Randomised trials, non‐randomised trials, interrupted time series (ITS) studies (with or without a control group), repeated measures (RM) studies (that is ITS studies where each individual contributed data to each point in time), controlled RM (CRM) and controlled before‐after (CBA) studies.
We only included ITS and RM studies if they had a clearly defined time of intervention and at least three data points before and three data points after the intervention. If a natural transition period was not apparent from the description of the implementation of the intervention a common transition period of two months was used, understood as the period immediately after the intervention point.
For this update we only included CBA and CRM studies if there were at least two sites in each comparison group, due to the EPOC Group recommendation (EPOC 2013a): "We recommend only including cluster randomised trials, non‐randomised cluster trials, and CBA studies with at least two intervention sites and two control sites".
Types of participants
Healthcare consumers and providers within a large jurisdiction or system of care. Jurisdictions could be regional, national or international. Studies within organisations, such as health maintenance organisations, were included if the organisation had multiple sites and served a large population.
Types of interventions
Policies on price and purchasing: policies that determine or are intended to affect the price that is paid for drugs. Included in this category are price control, maximum prices, price negotiations, rebates, reference pricing, index pricing, volume‐based pricing, and procurement policies.
Policies in this review were defined as laws, rules, financial and administrative orders made by governments, non‐government organisations or private insurers. Interventions applied at the level of a single facility were excluded.
Types of outcome measures
To be included a study had to include an objective measure of at least one of the following outcomes:
drug use (prescribed, dispensed or actually used);
healthcare utilisation;
health outcomes;
costs (expenditures), including drug costs and prices, other healthcare costs and policy administration costs.
Any important potential adverse effects of the intervention(s) were addressed.
Search methods for identification of studies
Electronic searches
We searched the following databases:
· Cochrane Central Register of Controlled Trials (CENTRAL), 2012, Issue 10, part of The Cochrane Library. www.thecochranelibrary.com (including the Effective Practice and Organisation of Care Group Register) (searched 22/10/2012)
· MEDLINE In‐Process & Other Non‐Indexed Citations and MEDLINE 1946 to present, Ovid (searched 22/10/2012)
· EconLit 1969 ‐ , ProQuest (searched 22/10/2012)
· PAIS International, Public Affairs Information Service 1914 ‐ , ProQuest (searched 22/10/2012)
· Worldwide Political Science Abstracts 1975 ‐ , ProQuest (searched 22/10/2012)
· INRUD Bibliography (searched 22/10/2012)
· Embase 1980 to 2010 Week 49, Ovid (searched 14/12/2010)
· NHS Economic Evaluation Database (NHSEED) 2010, Issue 4, part of The Cochrane Library.www.thecochranelibrary.com (searched 08/12/2010)
· LILACS, VHL (searched 14/12/2010)
· International Political Science Abstracts (IPSA) 1951 ‐ , Ebsco (searched (17/12/2010)
Searching other resources
Grey Literature
· OpenSIGLE (now called OpenGrey): http://www.opengrey.eu/ (searched 21/12/2010)
· WHOLIS, WHO (the WHO library database): http://dosei.who.int/uhtbin/cgisirsi/Thu+Jul++5+16:26:22+MEST+2012/0/49 (searched 17/12/2010)
· World Bank (Documents and Reports): http://www.worldbank.org/ (searched 21/12/2010)
· Jolis Library Catalog (The Library Network serving the World Bank Group and IMF): http://external.worldbankimflib.org/external.htm (searched 09/10/2011)
· Global Jolis, online catalog for the World Bank Country Office PIC/Libraries (searched 09/10/2011)
· OECD: http://www.oecd.org/ (searched 30/08/2005)
· OECD iLibrary (formerly SourceOECD): http://www.oecd‐ilibrary.org/ (searched 30/08/2005)
· World Bank eLibrary: http://elibrary.worldbank.org/ (searched 21/12/2010)
· WHO ‐ The Essential Drugs and Medicines web site: http://www.who.int/medicines/en/ (browsed 21/12/2010)
Trial Registries
· International Clinical Trials Registry Platform (ICTRP), Word Health Organization (WHO) http://www.who.int/ictrp/en/ (searched 23/04/2013)
· ClinicalTrials.gov, US National Institutes of Health (NIH) http://clinicaltrials.gov/ (searched 23/04/2013)
We also
· We screened the reference lists of all of the relevant reports that we retrieved
· Conducted cited reference searches for all included studies in Science Citation Index and Social Sciences Citation Index 1975 ‐ , ISI Web of Knowledge (searched 22/12/2012)
The search strategies for databases and websites are reported in Appendix 1.
Data collection and analysis
Selection of studies
For this update six authors (AA, AC, DD, MOA, MM, VV) independently reviewed all of the search results, abstracts and reference lists of relevant reports. The full texts of potentially relevant reports were retrieved (if one or both authors thought they were potentially relevant) and the same two authors independently assessed the relevance of those studies and the limitations of included studies. The lead author (AA) extracted data from new included studies in collaboration with one other author (CV). Disagreements were resolved by discussion and, when necessary, including another author (AC) in the discussion. The study selection was performed using Early Review Organizing Software (EROS), a web‐based programme (Ciapponi 2011; Glujovsky 2010).
Data extraction and management
Tables were prepared for each subcategory of interventions including the following information: study identification, characteristics of the intervention, drug use, healthcare utilisation, health outcomes, and costs. These tables formed the basis for the primary analyses. We described potential mechanisms through which the policies were intended to affect drug use and costs and postulated mechanisms for other effects, both intended and unintended. We also briefly listed and described important policy options for which no evaluations were found.
The following information, in addition to details for risk of bias assessment, was extracted from included studies using a standardised data extraction form.
Type of study (randomised trial, non‐randomised trial, repeated measures study, ITS study, CBA study).
Study setting (country, key features of the healthcare system and concurrent pharmaceutical policies).
The sponsors of the study.
Characteristics of the participants (consumers, physicians, practices, hospitals, etc.).
Characteristics of the policies.
Main outcome measures and study duration.
The results for the main outcome measures.
If the study presented results for more than one outcome in each of the four outcome groups (drug use and costs), we chose what we considered the most important outcome in each group, either as specified by the authors or based on discussions among the review authors. We aimed to be parsimonious. However, in cases where additional outcomes might lead to different conclusions, we also included these. We did not otherwise decide which outcomes to include based on the direction or size of effect, or whether a finding was statistically significant.
Assessment of risk of bias in included studies
Five review authors (AA, AC, AM, VC, VV) independently assessed the risk of bias for each new study that was included using the ‘risk of bias’ tool described in the Cochrane Handbook for Systematic Reviews of Interventions (Higgins 2011) and additional criteria developed by the Cochrane EPOC Group (EPOC 2013a).
The same two review authors updated the risk of bias assessments for studies included in the previous version of this review. Disagreements were resolved by discussion, involving a third review author (AC) if necessary.
For controlled ITS and controlled RM studies, the time series analyses were assessed independently from the controlled comparison, using the above criteria for ITS and CBA studies respectively. If the controlled comparison had a high risk of bias, it was not included and only the ITS analysis was used.
The risk of bias for each bias item and outcome was assessed using the approach described in the Cochrane Handbook for Systematic Reviews of Interventions (Higgins 2011).
| Risk of bias | Interpretation |
| Low risk of bias | Plausible bias unlikely to seriously alter the results |
| Unclear risk of bias | Plausible bias that raises some doubt about the results |
| High risk of bias | Plausible bias that seriously weakens confidence in the results |
Some setting dependent judgement (that is judgement dependent on knowledge of the setting in which a study was done) was used when assessing overall limitations. Where setting dependent judgement has been used, the explanations are provided in the Risk of bias in included studies (that is part of the Characteristics of included studies tables).
We generated 'risk of bias' summary figures using RevMan 2011.
Measures of treatment effect
ITS and RM studies
The preferred analysis method for ITS and RM studies was either a regression analysis with time trends before and after the intervention, which adjusted for autocorrelation and any periodic changes, or ARIMA analysis. The results of these analyses include changes along two dimensions: change in level and change in slope. Change in level is the immediate effect of the policy and is measured as the difference between the fitted value for the first post‐intervention data point (two months after the intervention) minus the predicted value one month after the intervention based on the pre‐intervention slope only.
Change in slope is the change in the trend from pre‐ to post‐intervention and reflects the 'long' term effect of the intervention. Since the interpretation of change in slope could be difficult, we chose to present the long term effects similarly to the way we calculated and presented the immediate effects. We presented the effects after half a year as the difference between the fitted value for the sixth month post‐intervention data point (half a year after the intervention) minus the predicted outcome six months after the intervention based on the pre‐intervention slope only. The effects after one year and two years were measured similarly. For drug expenditures, we also identified in some included studies cumulative expenditures outcomes (increase or decrease in measures) or if possible we calculated the cumulative savings after a half year, one year and two years as the area between the predicted expenditures curves and the actual expenditures.
Given that policy changes are often announced some months prior to official implementation, we defined a transition phase as the six months from the official announcement. If the included ITS and RM studies stated a different transition phase, we used two months of transition period. All results excluded the transition phase data.
Unit of analysis issues
Comparisons that allocate clusters (for example jurisdictions) but do not account for clustering in the analysis have a potential unit of analysis error, resulting in overly low P values and overly narrow confidence intervals. We planned to reanalyse this kind of comparison if we could extract the intra‐cluster coefficient or obtain missing information from the investigators. However, none of the included studies had unit of analysis errors.
Dealing with missing data
We contacted the original investigators to request missing data. If we could not obtain the missing data, we did not make any assumptions about missing data or attempt to impute the missing data.
Data synthesis
If papers with ITS data did not provide an appropriate analysis or reporting of results but presented the data points in a scannable graph or in a table, we (JOJ) reanalysed the data using methods described in Ramsay 2003 and EPOC 2013b. The following segmented time series regression model was specified: Y(t) = B0 + B1*Pre‐slope + B2*Post‐slope + B3*intervention + e(t), where Y(t) is the outcome in month t. Pre‐slope is a continuous variable indicating time from the start of the study up to the last point in the pre‐intervention phase and coded constant thereafter. Post‐slope is coded 0 up to and including the first point post‐intervention and coded sequentially from 1 thereafter. Intervention is coded 0 for pre‐intervention time points and 1 for post‐intervention time points. In this model, B1 estimates the slope of the pre‐intervention data, B2 estimates the slope of the post‐intervention data, and B3 estimates the change in level of outcome as the difference between the estimated first point post‐intervention and the extrapolated first point post‐intervention if the pre‐intervention line was continued into the post‐intervention phase. The difference in slope is calculated by B2 ‐ B1. The error term e(t) was assumed to be first order autoregressive. Confidence intervals (95%) were calculated for all effect measures.
In a repeated measures design, the data are repeated outcome measures from many individual patients. If the study did not report appropriate results we did not reanalyse the data from the summary graphs because no estimate of within patient variability could be obtained from the summary graphs and any reanalysis would underestimate or overestimate the standard error of the effect sizes. Therefore, for RM studies we used the results reported in the original papers only.
We conducted a structured synthesis, as described in the EPOC resources for review authors (EPOC 2013c). We anticipated that the included studies would vary with respect to the characteristics of the interventions and the targeted drugs and did not plan on undertaking meta‐analyses. The results of studies of similar interventions (reference pricing, index pricing and maximum prices) that reported similar outcomes were summarised in tables. For reference pricing, the only intervention for which we identified more than one study, we reported median effects and the range of effects. We prepared summary of findings tables using methods developed by the GRADE Working Group (Balshem 2011), described in the Cochrane Handbook for Systematic Reviews of Interventions (Higgins 2011) and recommended by EPOC (EPOC 2013d). We used the GRADE profiler software (GRADEpro 2008).
Subgroup analysis and investigation of heterogeneity
There was an insufficient number of comparisons for similar outcomes across studies to allow for meaningful exploration of heterogeneity. The following potential explanatory factors were considered: differences in the characteristics of the policies, differences in the settings, and differences in risk of bias (Table 7).
3. Factors that could modify the effects of reference drug pricing.
| FACTOR | CONDITION | POTENTIAL EFFECTS OF CONDITIONS NOT FULFILLED |
| Equivalence of drugs | The drugs in the reference drug group should be therapeutically similar. If they are not, the patients may have to pay more to get the most effective drug ‐ or they may choose less effective drugs | Drug use: Less shift towards cheaper drugs Health: Decrease Healthcare utilisation: Increase Patient drug expenditures: Increased |
| Incentives | Adequate incentives for patients, physicians, pharmacists and pharmaceutical companies to comply with the reference price system | Drug use: Less shift towards cheaper drugs Drug expenditures: Less savings Drug prices: Less reductions |
| Exemptions | Reasonable mechanisms for exemptions for patients that need such for medical reasons. Too limited exemptions could lead to higher co‐payments of the most effective drug and to prescribing of less effective drugs by physicians. Too generous exemptions could reduce the savings, by not shifting the drug use towards cheaper drugs | Drug use: Less shift towards cheaper drugs Health: Decrease Healthcare utilisation: Increase Patient drug expenditures: Increased |
| Availability of drugs | The reference drugs and other cheap drug choices of the reference groups should be available. If not, more expensive drugs would be used | Drug expenditures: Less savings Drug prices: Less reductions |
| Price levels | To achieve savings there should be significant price differences between the drugs in a reference group before the reference price system is introduced, with relatively high prices on the drugs most used | Drug expenditures: Less savings Drug prices: Less reductions |
| Electronic information systems | The administration costs, like time use for identifying, prescribing and dispensing the reference drugs and for handling exemption cases should be as low as possible. An electronic processing system would be useful and potentially time saving | Drug use: Less shift towards cheaper drugs Drug expenditures: Less savings Drug prices: Less reductions |
In addition, we attempted to identify important factors that might be taken into consideration by anyone contemplating implementing any of the policy alternatives, including: possible trade‐offs (of the expected benefits versus harms and costs), short versus long term effects, indications and contraindications for when the polices might be used, limitations of the available evidence, and other important factors that might affect the translation of the available evidence into practice in specific settings.
Results
Description of studies
See: Characteristics of included studies; Characteristics of excluded studies.
Results of the search
The literature search for pharmaceutical pricing policies in databases and websites, including reference lists from relevant studies and reports, resulted in 26,797 references after removing duplicates(9265 of them identified through the new search). We identified and retrieved in full text a total of 380 papers (134 of them from the new search) that were potentially relevant; 362 (125 from the current update) of these papers were excluded, most of them because they did not meet the study design inclusion criterion. They were primarily reviews, editorials, modelling studies, cross‐sectional studies, and before‐after studies without a control group. Finally 18 studies were included (seven from the current update): Brekke 2011; Grootendorst 2005; Grootendorst 2006; Kibicho 2012; Moreno‐Torres 2011; Puig 2007; Stargardt 2010 (see Figure 1).
1.
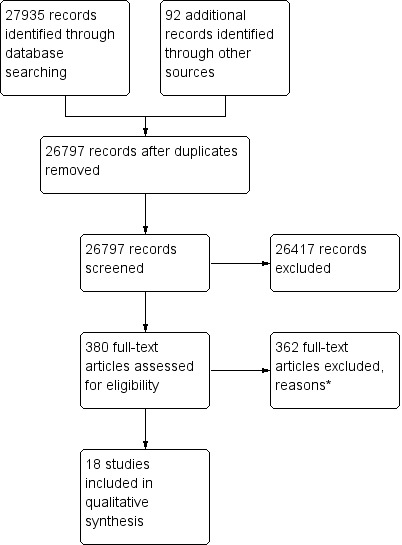
Study flow diagram.
* Out of 125 full‐text reports excluded in the update, 49 did not meet study design criteria, 64 did not meet intervention criteria, 3 did not meet outcome criteria, 2 were duplicated and 4 for other reasons.
Two studies (Huang 2012; Lee 2006) were identified and judged to possibly meet the inclusion criteria. These studies are listed amongst studies awaiting assessment because responses following contacting the first author and additional information are still pending. These two references described multiple pricing policy interventions from Tawian (1997 to 2002): stepwise price adjustments, external reference pricing, and internal reference pricing for generic drugs groups. Because of the short period before and after each intervention the review authors required more information about interventions and the size and effects of outcomes.
Included studies
Eighteen papers met the inclusion criteria (Aronsson 2001; Brekke 2003; Brekke 2011; Grootendorst 2002; Grootendorst 2005; Grootendorst 2006; Hazlet 2002; Kibicho 2012; Marshall 2002; McManus 2001; Moreno‐Torres 2011; Narine 2001; Pavcnik 2002; Puig 2007; Sawyer 1983; Schneeweiss 2002; Schneeweiss 2003; Stargardt 2010).
Study designs
None of the studies were randomised or non‐randomised trials. All 18 included studies used ITS or RM analyses. Some of the studies had more than one design, that is different designs for different outcomes. Four studies included in the original review used a CRM or CBA studies design to assess the health outcome or healthcare utilisation outcomes (Grootendorst 2002; Hazlet 2002; Schneeweiss 2002; Schneeweiss 2003); these studies were excluded from summary of findings (SOF) tables and from the main report in this update according to an EPOC Group recommendation (August 2013): “We recommend only including cluster randomised trials, non‐randomised cluster trials, and CBA studies with at least two control sites”. See Characteristics of included studies.
Characteristics of settings and patients
Seven of the reference pricing studies (Grootendorst 2002; Grootendorst 2006; Hazlet 2002; Marshall 2002; Narine 2001; Schneeweiss 2002; Schneeweiss 2003) were from Canada (British Columbia), two were from Germany (Pavcnik 2002; Stargardt 2010), and there was one study from each of the following countries: the USA (Maryland) (Sawyer 1983), Australia (McManus 2001), Sweden (Aronsson 2001) and Spain (Puig 2007). The index pricing study was from Norway (Brekke 2003) and the maximum prices study was from Spain (Puig 2007). The setting in all the Canadian studies was the British Columbia Ministry of Health's drug subsidy program, Pharmacare. The patients in all these studies were Pharmacare beneficiaries: senior citizens aged 65 years and older. The settings in the other studies were the national drug insurance plans, including all beneficiaries (Australia, Norway, Sweden), the Statutory Health Insurance (SHI) plan (Germany) and Medicaid (USA). The SHI plan in Germany covers about 88% of the population. It is compulsory for workers with incomes under a certain level, for unemployed and retired people, and for specific population groups such as farmers, artists and students. The state specific Medicaid programs in the USA provide medical benefits to low‐income groups, medically needy groups, or special groups.
Setting
Canada (eight studies: Grootendorst 2002; Grootendorst 2005; Grootendorst 2006; Hazlet 2002; Marshall 2002; Narine 2001; Schneeweiss 2002; Schneeweiss 2003); German (two studies: Pavcnik 2002; Stargardt 2010); US (two studies: Kibicho 2012; Sawyer 1983); Spain (two studies: Moreno‐Torres 2011; Puig 2007); Norway (two studies: Brekke 2003; Brekke 2011); Sweden (one study: Aronsson 2001); Australia (one study: McManus 2001).
Characteristics of interventions
In 17 studies the effects of reference drug pricing were analysed (Aronsson 2001; Brekke 2011; Grootendorst 2002; Grootendorst 2005; Grootendorst 2006; Hazlet 2002; Kibicho 2012; Marshall 2002; McManus 2001; Moreno‐Torres 2011; Narine 2001; Pavcnik 2002; Puig 2007; Sawyer 1983; Schneeweiss 2002; Schneeweiss 2003; Stargardt 2010). One of these studies (Puig 2007) analysed maximum prices policy. The one other study analysed effects of index pricing (Brekke 2003). See Characteristics of included studies for more details.
Policies in the first included studies were mainly introduced in the 1990s, except for the Maximum Allowable Cost (MAC) policy in Maryland, USA (1970s). The years of introduction of policies of the new included studies were 1995 to 1997 for Grootendorst 2005 and Grootendorst 2006; 2000 for Moreno‐Torres 2011; 2003 for Brekke 2011 and Kibicho 2012; 2004 for Puig 2007; and 2005 for Stargardt 2010.
The setting in all the Canadian studies was the British Columbia Ministry of Health’s drug subsidy program, Pharmacare. The patients in all these studies were the Pharmacare beneficiaries, senior citizens aged 65 years and older (Grootendorst 2002; Grootendorst 2005; Grootendorst 2006; Hazlet 2002; Marshall 2002; Narine 2001; Schneeweiss 2002; Schneeweiss 2003). The settings in the other studies were the National Public Insurance from Sweden and Norway (Aronsson 2001; Brekke 2003; Brekke 2011), the Pharmaceutical Benefits Scheme from Australia (McManus 2001). Germany has two types of settings: the Statutory Health Insurance (SHI) in Germany covers about 88% of the population that is compulsory for workers with income under a certain level, for unemployed and retired people, and for specific population groups such as farmers, artists and students (Pavcnik 2002); and the Techniker Krakenkasse (TK), a sickness fund with more than 5.8 million insured members in 2005, which is 82% of German residents with public health insurance (Stargardt 2010). The state specific Medicaid programs in the USA provide medical benefits to low‐income groups, medically needy groups, and special groups; one study setting was from the Maryland State (Sawyer 1983), and other from Michigan State (Kibicho 2012). Spanish settings corresponded to the National Health System (Moreno‐Torres 2011; Puig 2007) and the Andalusian Public Health Service (Puig 2007). See 'Additional table 2' for further details.
For all seven British Columbia studies RP policy interventions and outcomes were for large therapeutic groups of analogue drugs: angiotensin converting enzyme (ACE) inhibitors, calcium channel blockers (CCBs), nitrates used for long term prophylaxis, histamine‐2 receptor antagonists (H2RA), opiates, nonsteroidal anti‐inflammatory drugs (NSAIDs) (Grootendorst 2002; Grootendorst 2005; Grootendorst 2006; Hazlet 2002; Marshall 2002; Narine 2001; Schneeweiss 2002; Schneeweiss 2003). Other studies were a German study for statins (Stargardt 2010), a German study for oral antidiabetics and antiulcer drugs (Pavcnik 2002), and a US study for antihypertensive and antihyperlipidaemic drugs (Kibicho 2012). No information was given on the infrastructure around the policies, for example what kind, if any, of electronic systems for prescription claims. For all included drug classes there were special authority exemptions, which were valid indefinitely and given after the physician had applied and provided a valid reason for exemption, for example in British Columbia there were several exemptions in the reference price system.
Some studies described RP policies applied for international non‐proprietary name drugs: one Australian study for ranitidine (McManus 2001); acetaminophen‐codeine (Grootendorst 2005); and atorvastatin (Stargardt 2010). Other studies reported intervention with a RP policy for generic grouping drugs: one Spain study (Moreno‐Torres 2011) and one Norwegian study (Brekke 2011) for citalopram, omeprazole and cetirizine brand names and generic drugs. One US study described RP applied for dosage forms of multisource chemical entities (Sawyer 1983). No information was provided for exemptions with this type of drug included in the analysis.
A Norwegian study (Brekke 2003) included an index pricing policy for six groups of active substances: cetirizin (treatment of allergy), citalopram (antidepressant), enalapril (antihypertensive), lisinopril (antidepressant), loratadin (treatment of allergy) and omeprazol (treatment of gastro‐intestinal disorders). An exemption to this intervention was the case when the prescribing physician proscribed substitution of a generic in the pharmacies. A Spanish study (Puig 2007) reported maximum prices for 3‐hydroxy‐3‐methylglutaryl‐ conenzyme A (HMG‐CoA) reductase inhibitors and a group of six particular compounds (statins) sold primarily in oral dosage forms (atorvastatin, fluvastatin, lovastatin, pravastatin, simvastatin, and cerivastatin). No information was provided for exemptions with this type of drugs included in the analysis. See 'Additional table 2' for further details.
There was little information on specific incentives in the studies. The general incentives in reference pricing systems are described in the 'Background' section.
Few of the included studies reported the size of the difference between the reference price and other drugs in the relevant drug groups. Not much specific information was given in the studies on what incentives the physicians or pharmacists had to spend time on identifying and retrieving the reference drug, or whether this was facilitated in some way (for example through an automated system). However, in British Columbia the reference drug program was introduced at the same time as a province‐wide online pharmacy network was established. The pharmacy network kept track of exempt patients, indicated the portion of the drug price that PharmaCare would cover, and relieved the patient of the responsibility of submitting claims to PharmaCare and of the need to understand complicated policies (Pharmanet 2003; Pharmanet 2005).
Characteristics of outcomes
None of the studies presented data on all outcomes. The studies provided data on cumulative drug expenditures (six studies: Brekke 2011; Grootendorst 2002; Kibicho 2012; Marshall 2002; Puig 2007; Moreno‐Torres 2011); third party (insurance) drug expenditures (eight studies: Brekke 2011; Grootendorst 2002; Grootendorst 2005; Grootendorst 2006; Marshall 2002; Sawyer 1983; Schneeweiss 2002; Schneeweiss 2003); drug use, that is either the number of dispensed doses or the number of dispensed prescriptions (10 studies: Grootendorst 2002; Grootendorst 2005; Grootendorst 2006; Hazlet 2002; McManus 2001; Moreno‐Torres 2011; Narine 2001; Schneeweiss 2002; Schneeweiss 2003; Stargardt 2010); and drug prices (four studies: Aronsson 2001; Brekke 2011; Kibicho 2012; Pavcnik 2002). One study (Grootendorst 2005) reported patient costs but no other study reported other costs (either intervention costs or costs in other parts of the health services sector) using one of the study designs specified in our inclusion criteria.
Excluded studies
The excluded studies table provides the reasons for exclusion of 24 studies about which it was plausible to expect that a reader would question why the study was not included, that are well known but did not meet all of the inclusion criteria, or ITS studies that met all inclusion criteria except that there were too few data points. See Characteristics of excluded studies for more details.
Risk of bias in included studies
See: Characteristics of included studies; Figure 2; and Figure 3.
2.

Risk of bias summary: review authors' judgements about each risk of bias item for each included study.
3.
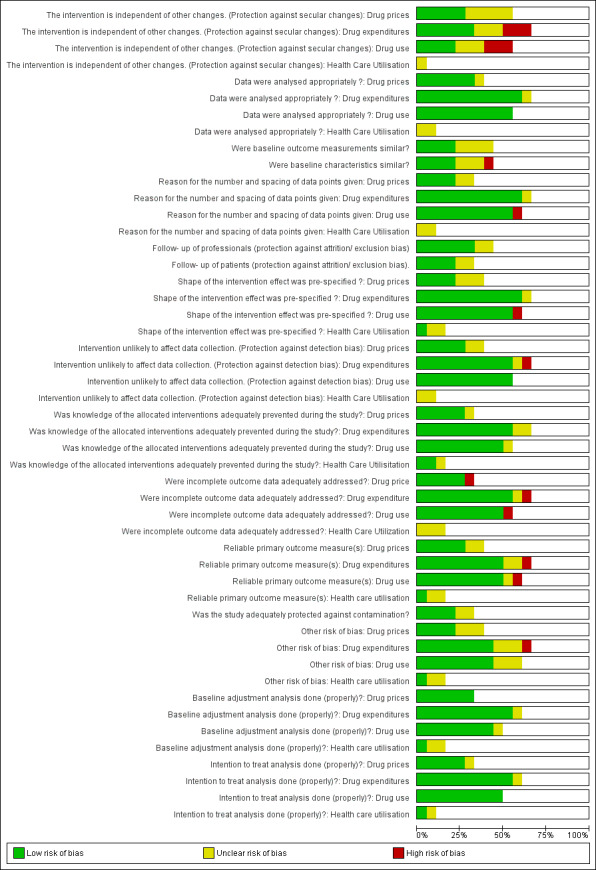
Risk of bias graph: review authors' judgements about each risk of bias item presented as percentages across all included studies.
In August 2013 the EPOC Cochrane Group recommended only including cluster randomised trials, non‐randomised cluster trials, and CBA studies with at least two intervention sites and two control sites to reduce the risk of bias. Due to this recommendation we excluded four originally included studies (Grootendorst 2002; Hazlet 2002; Schneeweiss 2002; Schneeweiss 2003) from the SOF tables and from the main report on outcomes for healthcare utilisation; and included only two of these studies for mortality (Grootendorst 2002; Schneeweiss 2002).
For the reference pricing the following studies presented high risk of bias in certain domains: Hazlet 2002 (protection of secular changes, and shape of the curve not pre‐specified); Kibicho 2012 (incomplete outcome data adequately addressed); Marshall 2002 (protection of secular changes); Narine 2001 (protection of secular changes, management of incomplete data, and reliable outcome measurement); Sawyer 1983 (protection against detection bias); and Schneeweiss 2003 (similar baseline characteristics) (see Figure 2 and Characteristics of included studies).
The included ITS study (Puig 2007) for maximum pricing policy had limitations in assessing drug expenditures: the intervention could be not be protected from secular changes, the outcome could not be measured in a reliable way, and the use of overall volume of sales as a proxy for public expenditure data.
The included ITS study (Brekke 2003) for index pricing had some limitations (the source of data collection changed during the study period).
Effects of interventions
See: Table 1; Table 2; Table 3; Table 4
Summary of findings for the main comparison. Reference pricing policy compared to no reference pricing.
| Reference pricing policy compared to no reference pricing | |||
| Population: Patients with drug insurance Settings: Canada, US, Germany Intervention: Reference pricing Comparison: No reference pricing | |||
| Outcomes |
Impact Median relative effect (range) |
No of studies | Quality of the evidence (GRADE) |
| Insurer's cumulative drug expenditures one year after the transition period | Reference drugs + cost share drugs: Median relative cumulative drug expenditures of ‐18% (range: from ‐36% to 3%) | 2 studies1 | ⊕⊕⊝⊝ low |
| Insurer's drug expenditures one year after the transition period | Reference drugs + cost share drugs: Median relative drug expenditures of ‐10% (range: from ‐53% to 4%) | 4 studies2 | ⊕⊕⊝⊝ low |
| Drug use one year after the transition period | Reference drugs: Median relative change in prescriptions of 15% (range: from ‐14% to 166%) | 4 studies | ⊕⊕⊝⊝ low |
| Cost share drugs: Median relative change in prescriptions of ‐39% (range: from ‐87% to ‐17%) | 3 studies | ⊕⊕⊝⊝ low | |
| Healthcare utilisation | No studies meeting the inclusion criteria were found | ‐ | ‐ |
| Health outcomes | No studies meeting the inclusion criteria were found | ‐ | ‐ |
| Adverse events | No studies meeting the inclusion criteria were found | ‐ | ‐ |
|
Reference drugs: drugs that determine the reference price level. There is no cost share by the patients for these drugs, which are fully reimbursed. The expectation is that reference pricing will lead to an increase in use of these drugs.
Cost share drugs: drugs in the same group as the reference drugs that cost more. Patients have to pay the difference between reference price drugs and the price of these drugs. The expectation is that reference pricing will lead to a decrease in use of these drugs. Reference drugs + cost share drugs: both the reference drugs and the cost share drugs. The expectation is that reference pricing will lead to little or no change in the overall use of these drugs. | |||
| GRADE Working Group grades of evidence High quality: Further research is very unlikely to change our confidence in the estimate of effect. Moderate quality: Further research is likely to have an important impact on our confidence in the estimate of effect and may change the estimate. Low quality: Further research is very likely to have an important impact on our confidence in the estimate of effect and is likely to change the estimate. Very low quality: We are very uncertain about the estimate. | |||
1. Puig 2007 was not considered for the median because this study reported the outcome different than the other two studies (mean monthly savings of total lovastatin and simvastatin sales).
2. We only included Pharmacare data from Grootendorst 2005.
Summary of findings 2. Index pricing compared to no index pricing.
| Index pricing compared to no index pricing | |||
| Population: Norwegian citizens taking one of the following drugs: citalopram (depression), omeprazol (antiulcer), cetirizin (allergy), loratadin (allergy), enalapril (high blood pressure) and lisinopril (high blood pressure), simvastatin (high cholesterol) or amlodipin (high blood pressure) Settings: Norway Intervention: Index pricing Comparison: No index pricing | |||
| Outcomes | Relative effect (95% CI) | No of studies | Quality of the evidence (GRADE) |
| Drug use 6 months after policy start date | Generic citalopram: 55% (95% CI 11 to 98%) Brand citalopram: ‐43% (95% CI ‐67 to ‐18%) |
1 study | ⊕⊕⊝⊝ low |
| Drug prices 6 months after policy start date | Generic drug prices: ‐5.3% (95% CI NA) Brand drugs prices: ‐1.1% (95% CI NA) |
1 study | ⊕⊕⊝⊝ low |
| Drug expenditures | No studies meeting the inclusion criteria were found | ‐ | ‐ |
| Healthcare utilisation | No studies meeting the inclusion criteria were found | ‐ | ‐ |
| Health outcomes | No studies meeting the inclusion criteria were found | ‐ | ‐ |
| Adverse events | No studies meeting the inclusion criteria were found | ‐ | ‐ |
| CI: Confidence interval | |||
| GRADE Working Group grades of evidence High quality: Further research is very unlikely to change our confidence in the estimate of effect. Moderate quality: Further research is likely to have an important impact on our confidence in the estimate of effect and may change the estimate. Low quality: Further research is very likely to have an important impact on our confidence in the estimate of effect and is likely to change the estimate. Very low quality: We are very uncertain about the estimate. | |||
Summary of findings 3. Maximum prices compared to no maximum prices for drug expenditures.
| Maximum prices compared to no maximum prices for drug expenditures | |||
| Population: Patients taking statins Settings: Andalusia, Spain Intervention: Maximum prices Comparison: No maximum prices | |||
| Outcomes | Relative effect (95% CI) | No of studies | Quality of the evidence (GRADE) |
| Drug expenditure one year after the transition period | 21.4% (95% CI 19.0 to 23.7%) in volume of sales for total statins | 1 study | ⊕⊝⊝⊝ Very low1 |
| Drug prices | No studies meeting the inclusion criteria were found | ‐ | ‐ |
| Healthcare utilisation | No studies meeting the inclusion criteria were found | ‐ | ‐ |
| Health outcomes | No studies meeting the inclusion criteria were found | ‐ | ‐ |
| Drug use | No studies meeting the inclusion criteria were found | ‐ | ‐ |
| Adverse events | No studies meeting the inclusion criteria were found | ‐ | ‐ |
| CI: Confidence interval | |||
| GRADE Working Group grades of evidence High quality: Further research is very unlikely to change our confidence in the estimate of effect. Moderate quality: Further research is likely to have an important impact on our confidence in the estimate of effect and may change the estimate. Low quality: Further research is very likely to have an important impact on our confidence in the estimate of effect and is likely to change the estimate. Very low quality: We are very uncertain about the estimate. | |||
1 High risk of bias due to the intervention not being independent of other changes.
Summary of findings 4. Reference pricing versus no reference pricing: drug expenditures.
| STUDY ID | REFERENCE PRICE FOR | EFFECTS ON EXPENDITURES OF*** | OUTCOME | ABSOLUTE CHANGE LEVEL, IMMEDIATE AFTER TRANSITION PERIOD (95% CI) | RELATIVE CHANGE IN LEVEL, IMMEDIATE AFTER TRANSITION PERIOD (95% CI) | RELATIVE CHANGE IN LEVEL, 1/2 YEAR AFTER TRANSITION PERIOD (95% CI) | RELATIVE CHANGE IN LEVEL, 1 YEAR AFTER TRANSITION PERIOD (95% CI) | RELATIVE CHANGE IN LEVEL, 2 YEARS AFTER TRANSITION PERIOD (95% CI) | NOTES |
| Grootendorst 2002* | ACE inhibitors | Reference drugs + cost share drugs | ACE inhibitors. Pharmacare expenditure per 100,000 senior citizens. Canadian dollar per month | 18,203 (‐1611 to 38,017) | 5% (0% to 10%) | 5% (‐2% to 10%) | 4% (‐3% to 10%) | 1% (‐8% to 9%) | Price year not specified in study papers |
| CCBs | Reference drugs + cost share drugs | CCBs. Pharmacare expenditure per 100,000 senior citizens. Canadian dollar per month | ‐91,547 (‐122,082 to ‐61,011) | ‐19% (‐26% to ‐13%) | ‐18% (‐30% to ‐5%) | ‐16% (‐36% to 5%) | ‐14% (‐51% to 23%) | Price year not specified in study papers | |
| Nitrates | Reference drugs + cost share drugs | Nitrates. Pharmacare expenditures per 100,000 senior citizens. Canadian dollar per month | ‐66,473 (‐72,620 to ‐60,326) | ‐50% (‐55% to ‐46%) | ‐47% (‐52% to ‐41%) | ‐ | ‐ | Price year not specified in study papers | |
| Grootendorst 2005 | NSAIDs (RP 1) | Reference drugs + cost share drugs | Average monthly expenditure per day of therapy dispensed (Canadian dollars 2004) for Pharmacare (Ph) and Patient (Pa) | Ph:‐0.08 (‐0.12 to ‐0.04) Pa: 0.00 (‐0.03 to 0.02) |
Ph: ‐9.6% (95% CI NA) Pa: NA |
‐ | Ph: ‐8.8% (95% CI NA) Pa: 690% (95% CI NA) |
Ph: ‐8.3% (95% CI NA) Pa: 571% (95% CI NA) |
Last estimated effect at 19 months |
| NSAIDs (RP 2) | Reference drugs + cost share drugs | Average monthly expenditure per day of therapy dispensed (Canadian dollars 2004) for Pharmacare (Ph) and Patient (Pa) | Ph:‐0.31 (‐0.36 to ‐0.27) Pa: 0.07 (0.04 to 0.10) |
Ph: ‐37% (95% CI NA) Pa: 550% (95% CI NA) |
‐ | Ph: ‐53% (95% CI NA) Pa: 500% (95% CI NA) |
‐ | ||
| Marshall 2002* | H2RAs | Reference drugs + cost share drugs | H2RAs. Pharmacare expenditures per 100000 senior citizens. Canadian dollar per month | ‐45,139 (‐50,096 to ‐40,183) | ‐39% (‐44% to ‐35%) | ‐38% (‐44% to ‐31%) | ‐35% (‐45% to ‐25%) | ‐30% (‐48% to ‐12%) | Price year not specified in study papers |
| Grootendorst 2006 | ACE inhibitors | Reference drugs + cost share drugs | All ACE inhibitors. Drug plan expenditures per DDD dispensed. CAD | ‐0.04 (‐0.09 to 0.02) | ‐4% (95% CI NA) | ‐7% (95% CI NA) | ‐11% (95% CI NA) | Price specified in study papers | |
| CCBs | Reference drugs + cost share drugs | All CCBs. Drug plan expenditures per DDD dispensed. CAD | ‐0.20 (‐0.25 to ‐0.15) |
‐16% (95% CI NA) | ‐10% (95% CI NA) | ‐4% (95% CI NA) | Price year not specified in study papers | ||
| Sawyer 1983 | 52 dosage forms of 25 multisource chemical entities | Reference drugs + cost share drugs | Monthly Medicaid drug expenditures in Maryland. USD | ‐291276 (‐478,458 to ‐104,094) | ‐0.87 per month (95% CI NA) | Price year not specified in study papers | |||
| Brekke 2011 | The RP covered six chemical substances: Citalopram, Omeprazol, Cetirizin, Loratadin, Enalapril and Lisinopril . The system was later extended with two additional substances; simvastatin and amlodipin | Cost share drugs | Change in copayments NOK | Generic copayment ‐12.92 (95% CI NA) Brand‐name copayment ‐6.37 (95% CI NA) |
Generic copayment ‐12.76% (95% CI NA) Brand‐name copayment ‐14.82% (95% CI NA) |
||||
*Results from reanalysis by reviewers.
**NA = Not available.
***EFFECTS ON EXPENDITURES OF:
Reference drugs, drugs that determine the reference price level. There is no cost share by the patients for these drugs, which are fully reimbursed. The expectation is that reference pricing will lead to an increase in use of these drugs. Cost share drugs, drugs in the same group as the reference drugs that cost more. Patients have to pay the difference between reference price drugs and the price of these drugs. The expectation is that reference pricing will lead to a decrease in use of these drugs.
Reference drugs + cost share drugs, both the reference drugs and the cost share drugs. The expectation is that reference pricing will lead to little or no change in the overall use of these drugs.
Detailed results for the included studies are provided in the 'Additional tables' (Table 8; Table 9; Table 10; Table 11; Table 12; Table 13; Table 14). None included reference reported adverse effects caused by pricing policy interventions. There was no information in the included studies regarding the differential effects of the interventions on resource‐disadvantaged populations.
4. Reference pricing versus no reference pricing: Cumulative drug expenditures.
| STUDY ID | POLICY: REFERENCE PRICE FOR | EFFECTS ON CUMULATIVE EXPENDITURES OF**** | OUTCOME | ABSOLUTE CUMULATIVE DRUG EXPENDITURES, 1/2 YEAR AFTER TRANSITION PERIOD (95% CI) | RELATIVE CUMULATIVE DRUG EXPENDITURES, 1/2 YEAR AFTER TRANSITION PERIOD (95% CI) | ABSOLUTE CUMULATIVE DRUG EXPENDITURES, 1 YEAR AFTER TRANSITION PERIOD (95% CI) | RELATIVE CUMULATIVE DRUG EXPENDITURES, 1 YEAR AFTER TRANSITION PERIOD (95% CI) | ABSOLUTE CUMULATIVE DRUG EXPENDITURES, 2 YEARS AFTER TRANSITION PERIOD (95% CI) | RELATIVE CUMULATIVE DRUG EXPENDITURES, 2 YEARS AFTER TRANSITION PERIOD (95% CI) |
| Grootendorst 2002* | ACE inhibitors | Reference drugs + cost share drugs | ACE inhibitors. Pharmacare expenditure per 100,000 senior citizens. Canadian dollar per month | 68554 (17,064 to 154,173) | 3% (1% to 7%) | 144,630 (18,603 to 270,657) | 3% (0% to 6%) | 153,191 (35,666 to 342,047) | 2% (0% to 4%) |
| CCBs | Reference drugs + cost share drugs | CCBs. Pharmacare expenditure per 100,000 senior citizens. Canadian dollar per month | ‐511,506 (‐687,351 to ‐335,661) | ‐18% (‐25% to ‐12%) | ‐1,002,907 (‐1,308,322 to ‐697,481) | ‐18% (‐24% to ‐13%) | ‐1,786,163 (‐2,381,513 to ‐1,190,812) | ‐16% (‐22% to ‐11%) | |
| Nitrates | Reference drugs + cost share drugs | Nitrates. Pharmacare expenditures per 100,000 senior citizens. Canadian dollar per month | ‐390,230 (‐422,501 to ‐357,958) | ‐48% (‐52% to ‐44%) |
‐ | ‐ | ‐ | ‐ | |
| Marshall 2002* | H2RAs | Reference drugs + cost share drugs | H2RAs. Pharmacare expenditures per 100,000 senior citizens. Canadian dollar per month | ‐261,347 (‐292,070 to ‐230,623) | ‐38% (‐43% to ‐34%) | ‐482,978 (‐529,961 to ‐435,995) | ‐36% (‐40% to ‐33%) | ‐882,353 (‐957,349 to ‐807,356) | ‐34% (‐37% to ‐31%) |
| Puig 2007 | lovastatin | Reference drugs + cost share drugs | Mean monthly savings of total lovastatin sales (%) | Not reported | Not reported | Not reported | 10 months after intervention attributed to the RP revision applied (January 2004 – October 2004): Rest of Spain ‐16.3% (−23.4 to −9.1) Andalusia ‐11.5% (‐3.5% to ‐19.5%) |
||
| Simvastatin | Reference drugs + cost share drugs | Mean monthly savings of total simvastatin sales (%) | Not reported | After intervention attributed to the initial application of RP to lovastatin (May 2002 – April 2003): Rest of Spain: 16.7% (13.0% to 20.4%) of total lovastatin sales representing only 1.1% (0.9% to 1.3%) of total statins sales Andalusia: 23.7% (18.3% to 29.0%) representing only 1.3% (0.4% to 1.0%) of total statins sales |
Not reported | 10 months after intervention attributed to the RP revision applied (January 2004 – October 2004): Rest of Spain ‐51.8% (‐48.9% to ‐54.6%) Andalusia: ‐29.7% (‐26.8% to ‐32.6%), |
|||
| Kibicho 2012 | 1. Antihypertensive drugs 2. Antihyperlipidaemic drugs 3. Generic drugs 4. Brand‐name drugs |
Reference drugs + cost share drugs*** | Total cumulative drug expenditures (USD) | 1: $18,562 (‐$93 to $37,217) 2: $15,322 (‐$30,452 to $61,096) 3: ‐$35,448 (‐$50,470 to ‐$20,425) 4: $69,331 ($21,553 to $117,109) | |||||
| Moreno‐Torres 2011 | All pharmaceuticals financed by the public sector in Catalonia | Total market | Saving per insured person | EUR ‐4.06 (95% CI NA) | ‐1.54% (95% CI NA) |
*Results from reanalysis by reviewers. Negative values represent cost savings and positive values are cost increases.
**NA = Not available.
***Reference drugs (generic drugs) + cost share drugs (brand names).
****EFFECTS ON CUMULATIVE EXPENDITURES OF:
Reference drugs,: drugs that determine the reference price level. There is no cost share by the patients for these drugs, which are fully reimbursed. The expectation is that reference pricing will lead to an increase in use of these drugs. Cost share drugs, drugs in the same group as the reference drugs that cost more. Patients have to pay the difference between reference price drugs and the price of these drugs. The expectation is that reference pricing will lead to a decrease in use of these drugs.
Reference drugs + cost share drugs, both the reference drugs and the cost share drugs. The expectation is that reference pricing will lead to little or no change in the overall use of these drugs.
5. Reference pricing versus no reference pricing: drug expenditures.
| STUDY ID | REFERENCE PRICE FOR | EFFECTS ON EXPENDITURES OF*** | OUTCOME | ABSOLUTE CHANGE LEVEL, IMMEDIATE AFTER TRANSITION PERIOD (95% CI) | RELATIVE CHANGE IN LEVEL, IMMEDIATE AFTER TRANSITION PERIOD (95% CI) | RELATIVE CHANGE IN LEVEL, 1/2 YEAR AFTER TRANSITION PERIOD (95% CI) | RELATIVE CHANGE IN LEVEL, 1 YEAR AFTER TRANSITION PERIOD (95% CI) | RELATIVE CHANGE IN LEVEL, 2 YEARS AFTER TRANSITION PERIOD (95% CI) | NOTES |
| Grootendorst 2002* | ACE inhibitors | Reference drugs + cost share drugs | ACE inhibitors. Pharmacare expenditure per 100,000 senior citizens. Canadian dollar per month | 18,203 (‐1611 to 38,017) | 5% (0% to 10%) | 5% (‐2% to 10%) | 4% (‐3% to 10%) | 1% (‐8% to 9%) | Price year not specified in study papers |
| CCBs | Reference drugs + cost share drugs | CCBs. Pharmacare expenditure per 100,000 senior citizens. Canadian dollar per month | ‐91,547 (‐122,082 to ‐61,011) | ‐19% (‐26% to ‐13%) | ‐18% (‐30% to ‐5%) | ‐16% (‐36% to 5%) | ‐14% (‐51% to 23%) | Price year not specified in study papers | |
| Nitrates | Reference drugs + cost share drugs | Nitrates. Pharmacare expenditures per 100,000 senior citizens. Canadian dollar per month | ‐66,473 (‐72,620 to ‐60,326) | ‐50% (‐55% to ‐46%) | ‐47% (‐52% to ‐41%) | ‐ | ‐ | Price year not specified in study papers | |
| Grootendorst 2005 | NSAIDs (RP 1) | Reference drugs + cost share drugs | Average monthly expenditure per day of therapy dispensed (Canadian dollars 2004) for Pharmacare (Ph) and Patient (Pa) | Ph:‐0.08 (‐0.12 to ‐0.04) Pa: 0.00 (‐0.03 to 0.02) |
Ph: ‐9.6% (95% CI NA) Pa: NA |
‐ | Ph: ‐8.8% (95% CI NA) Pa: 690% (95% CI NA) |
Ph: ‐8.3% (95% CI NA) Pa: 571% (95% CI NA) |
Last estimated effect at 19 months |
| NSAIDs (RP 2) | Reference drugs + cost share drugs | Average monthly expenditure per day of therapy dispensed (Canadian dollars 2004) for Pharmacare (Ph) and Patient (Pa) | Ph:‐0.31 (‐0.36 to ‐0.27) Pa: 0.07 (0.04 to 0.10) |
Ph: ‐37% (95% CI NA) Pa: 550% (95% CI NA) |
‐ | Ph: ‐53% (95% CI NA) Pa: 500% (95% CI NA) |
‐ | ||
| Marshall 2002* | H2RAs | Reference drugs + cost share drugs | H2RAs. Pharmacare expenditures per 100000 senior citizens. Canadian dollar per month | ‐45,139 (‐50,096 to ‐40,183) | ‐39% (‐44% to ‐35%) | ‐38% (‐44% to ‐31%) | ‐35% (‐45% to ‐25%) | ‐30% (‐48% to ‐12%) | Price year not specified in study papers |
| Grootendorst 2006 | ACE inhibitors | Reference drugs + cost share drugs | All ACE inhibitors. Drug plan expenditures per DDD dispensed. CAD | ‐0.04 (‐0.09 to 0.02) | ‐4% (95% CI NA) | ‐7% (95% CI NA) | ‐11% (95% CI NA) | Price specified in study papers | |
| CCBs | Reference drugs + cost share drugs | All CCBs. Drug plan expenditures per DDD dispensed. CAD | ‐0.20 (‐0.25 to ‐0.15) |
‐16% (95% CI NA) | ‐10% (95% CI NA) | ‐4% (95% CI NA) | Price year not specified in study papers | ||
| Sawyer 1983 | 52 dosage forms of 25 multisource chemical entities | Reference drugs + cost share drugs | Monthly Medicaid drug expenditures in Maryland. USD | ‐291276 (‐478,458 to ‐104,094) | ‐0.87 per month (95% CI NA) | Price year not specified in study papers | |||
| Brekke 2011 | The RP covered six chemical substances: Citalopram, Omeprazol, Cetirizin, Loratadin, Enalapril and Lisinopril . The system was later extended with two additional substances; simvastatin and amlodipin | Cost share drugs | Change in copayments NOK | Generic copayment ‐12.92 (95% CI NA) Brand‐name copayment ‐6.37 (95% CI NA) |
Generic copayment ‐12.76% (95% CI NA) Brand‐name copayment ‐14.82% (95% CI NA) |
||||
*Results from reanalysis by reviewers.
**NA = Not available.
***EFFECTS ON EXPENDITURES OF:
Reference drugs, drugs that determine the reference price level. There is no cost share by the patients for these drugs, which are fully reimbursed. The expectation is that reference pricing will lead to an increase in use of these drugs. Cost share drugs, drugs in the same group as the reference drugs that cost more. Patients have to pay the difference between reference price drugs and the price of these drugs. The expectation is that reference pricing will lead to a decrease in use of these drugs.
Reference drugs + cost share drugs, both the reference drugs and the cost share drugs. The expectation is that reference pricing will lead to little or no change in the overall use of these drugs.
6. Reference pricing versus no reference pricing: drug use.
| STUDY ID | POLICY: REFERENCE PRICE FOR | EFFECTS ON USE OF****** | OUTCOME | ABSOLUTE CHANGE IN LEVEL, IMMEDIATE AFTER TRANSMISSION PERIOD (95% CI) | RELATIVE CHANGE IN LEVEL, IMMEDIATE AFTER TRANSITION PERIOD (95% CI) | RELATIVE CHANGE IN LEVEL, 1/2 YEAR AFTER TRANSITION PERIOD (95% CI) | RELATIVE CHANGE IN LEVEL, 1 YEAR AFTER TRANSITION PERIOD (95% CI) | NOTES |
| Grootendorst 2002* | Nitrates | Reference drugs | Reference standard nitrate prescriptions. Monthly number dispensed per 100,000 senior citizens | 378 (353 to 404) | 196% (183% to 209%) | 163% (147% to 179%) | ‐ | |
| Grootendorst 2005 | NSAIDs (RP 1)***** | Reference drugs | NSAIDs: Days therapy dispensed per 1000 seniors | ‐140.36 (‐412.06 to 131.35) | ‐6.2% (95% CI NA) | ‐ | ‐13.5% (95% CI NA) | ‐17% at 19 months (95% CI NA) |
| NSAIDs (RP 2)***** | Reference drugs | NSAIDs: Days therapy dispensed per 1000 seniors | ‐78.62 (‐351.25 to 194.00) | ‐4% (95% CI NA) | ‐ | 8.6% (95% CI NA) | ||
| Acetaminophen/Codeine (RP 1) | Reference drugs | Days therapy dispensed per 1000 seniors | ‐32.26 (‐137.18 to 72.66) | ‐4% (95% CI NA) | ‐ | ‐9.9% (95% CI NA) | ‐12% at 19 months (95% CI NA) |
|
| Acetaminophen/Codeine (RP 2) | Reference drugs | Days therapy dispensed per 1000 seniors | 50.50 (‐56.06 to 157.06) | 7% (95% CI NA) | ‐ | 20.7% (95% CI NA) | ||
| Grootendorst 2006 | ACE inhibitors | Reference drugs | Days therapy dispensed per 1000 seniors | 59 (‐12 to 129) | 43% (95% CI NA) | ‐ | 166% (95% CI NA) | 900% at two years (95% CI NA) |
| CCBs | Reference drugs | Days therapy dispensed per 1000 seniors | 29 (26 to 32) | 40% (95% CI NA) | ‐ | 50% (95% CI NA) | 62% at two years (95% CI NA) | |
| McManus 2001* | Ranitidine | Reference drugs | Days therapy dispensed per 1000 seniors | 23,763 (18,503 to 29,022) | 160% (124% to 195%) | 137% (87% to 186%) | ‐ | |
| Ranitidine | Reference drugs | Monthly ranitidine total prescriptions dispensed (GW, i.e. brand) | ‐50,977 (‐87,278 to ‐14,676) | ‐19% (‐32%, ‐5%) | ‐35% (‐61% to ‐9%) | ‐ | ||
| Narine 2001* | H2RAs | Reference drugs | Cimetidine prescriptions reimbursed. Monthly total number | 19,237 (17,944 to 20,530) | 249% (232% to 265%) | 251% (225% to 276%) | ‐ | |
| H2RAs | Reference drugs | H2 antagonist prescription reimbursed. Monthly total number | 5206 (2975 to 7438) | 13% (8%, 19%) | 19% (11% to 28%) | ‐ | ||
| Hazlet 2002 | H2RAs | Reference drugs | Mean monthly utilisation per DDD | not reported | not reported | no significant difference in slope pre‐ versus post‐intervention (P=0.08) | ||
| Schneeweiss 2002** | ACE inhibitors | Reference drugs | Reference ACE inhibitors. Number of median monthly doses dispensed per 10,000 senior residents | 275 (95% CI NA) | 79% (95% CI NA) | 87% (95% CI NA) | 94% (95% CI NA) | |
| Schneeweiss 2003** | CCBs | Reference drugs | Reference CCBs. Number of median monthly doses dispensed per 10,000 senior residents | 87 (95% CI NA) | max 60% (95% CI NA) | ‐ | ‐ | |
| Stargardt 2010 | Statins. However price for atorvastatin higher than reference price | Reference drugs | Other statins than atorvastatin. Number of prescriptions | 8425 (2721, 14129) | 21.9% (95% CI NA) | 9% (95% CI NA) | 0% at 2 years (95% CI NA) | |
| Grootendorst 2006 | ACE inhibitors | Cost share drugs | Partly reimbursed ACE inhibitors. Defined daily doses dispensed per 100 seniors | ‐116 (‐124 to ‐107) | ‐28% (95% CI NA) | ‐ | ‐34% (95% CI NA) | ‐39% at two years (95% CI NA) |
| Grootendorst 2006 | CCBs | Cost share drugs | Partly reimbursed CCBs. Defined daily doses dispensed per 100 seniors | ‐65 (‐77 to ‐53) | ‐17% (95% CI NA) | ‐ | ‐17% (95% CI NA) | ‐18% at two years (95% CI NA) |
| Schneeweiss 2002** | ACE inhibitors | Cost share drugs | Cost sharing ACE inhibitors. Number of median monthly doses dispensed per 10,000 senior residents. | ‐705 (95% CI NA) | ‐38 % (95% CI NA) | ‐41 % (95% CI NA) | ‐43 % (95% CI NA) | |
| Schneeweiss 2003 | CCBs | Cost share drugs | Cost sharing CCBs. Number of median monthly doses dispensed per 10000 senior residents | ‐343 (95% CI NA) | ‐38 % (95% CI NA) | ‐ | ‐ | |
| Stargardt 2010 | Statins (more expensive than RP atorvastatin) | Cost share drugs | Atorvastatin. Number of prescriptions | ‐14,788 (‐16,694 to ‐12,882) | ‐81.2% (95% CI NA) | ‐87% (95% CI NA) | ‐90% at 2 years (95% CI NA) | |
| Stargardt 2010 | Statins. However price for atorvastatin higher than reference price | Reference drugs + cost share drugs | Total no of prescriptions | ‐7037 (‐14,803 to 729) | ‐10.5% (95% CI NA) | ‐20% (95% CI NA) | ‐28% (95% CI NA) | |
| Moreno‐Torres 2011 | All active ingredients | Reference drugs + cost share drugs | Prescription per capita (Data from Fig. 1) |
No changes | No changes | No changes | No changes | No changes from 1995 to 2006 |
| Schneeweiss 2002** | ACE inhibitors | Reference drugs + cost share drugs | All ACE inhibitors. Number of median monthly doses dispensed per 10,000 senior residents | ‐225 (95% CI NA) | ‐11% (95% CI NA) | ‐ | ||
| Schneeweiss 2003** | CCBs | Reference drugs + cost share drugs | All CCBs. Number of median monthly doses dispensed per 10,000 senior residents | ‐80 (95% CI NA) | ‐9% (95% CI NA) | ‐ | ‐ | |
| Grootendorst 2006 | ACE inhibitors | Reference drugs + cost share drugs | All ACE inhibitors. Defined daily doses dispensed per 100 seniors | ‐65 (‐158 to 29) | ‐12% (95% CI NA) | 8% (95% CI NA) | 30% at 2 years (95% CI NA) | |
| CCBs | Reference drugs + cost share drugs | All CCBs. Defined daily doses dispensed per 100 seniors | ‐34 (‐49 to ‐20) | ‐8% (95% CI NA) | ‐7% (95% CI NA) | ‐6% at 2 years (95% CI NA) | ||
| Grootendorst 2005 | Opiates (RP 1)***** | Other drugs | Days therapy dispensed per 1000 seniors | 79.30 (‐95.10 to 253.71) | 22% (95% CI NA) | ‐ | ‐3% (95% CI NA) | ‐18% at 19 months (95% CI NA) |
| Opiates (RP 2)***** | Other drugs | Days therapy dispensed per 1000 seniors | 118.13 (‐56.53 to 292.78) | 40% (95% CI NA) | ‐ | 106% (95% CI NA) | ||
* Results from reanalysis by reviewers.
** Calculated by reviewers based on figures provided in the text of the study.
***NA = Not available.
****Type 1 RP—only chemically equivalent drugs (i.e., branded and ‘‘generic’’ versions of the same drug) are considered interchangeable. Under Type 2 RP, all drugs from the same therapeutic class are considered interchangeable.
***** Pharmacare savings are attenuated if physicians substitute relatively costly opiate analgesics, which were not targeted by Type 2 RP, for the NSAIDs that were.
******EFFECTS ON USE OF:
Reference drugs, drugs that determine the reference price level. There is no cost share by the patients for these drugs, which are fully reimbursed. The expectation is that reference pricing will lead to an increase in use of these drugs. Cost share drugs, drugs in the same group as the reference drugs that cost more. Patients have to pay the difference between reference price drugs and the price of these drugs. The expectation is that reference pricing will lead to a decrease in use of these drugs.
Reference drugs + cost share drugs, both the reference drugs and the cost share drugs. The expectation is that reference pricing will lead to little or no change in the overall use of these drugs.
7. Reference pricing versus no reference pricing: drug prices and patients' out‐of‐pocket payments.
| STUDY ID | POLICY: REFERENCE PRICING FOR | OUTCOME | LEVEL, LONG RUN (OVER THE 12 MONTHS OR LONGER POST PERIOD) (95% CI) |
| Aronsson 2001 | 12 different brand drugs: cimetidine, furosemide, atenolol, pindolol, propranolol, indomethacin, naproxen, allopurinol, paracetamol/codeine, diazepam, clomipramine, timolol | Change in prices/Swedish krona (SEK) | The reference price system tends to decrease the price of the original relative to the price of the generics. Estirnation results for Equatíons from ‐0.466 to ‐0.476* |
| Brekke 2011 | The RP covered six chemical substances: citalopram, omeprazol, cetirizin, loratadin, enalapril and lisinopril. The system was later extended with two additional substances; simvastatin and amlodipin | Change in prices (DDD, NOK) | Copayments price decreased 13% for generic drugs and 23% for brand‐name drugs |
| Kibicho 2012 | 1. Antihypertensive drugs 2. Antihyperlipidaemic drugs 3. Generic drugs 4. Brand‐name drugs |
Marginal effect in prices of each policy, controlling for level and trend effects in the other three policy periods (USD) | 1: $0.06 ($0, $0.12) 2: $0.37 ($0.09, $0.64) 3: ‐$0.13 (‐$0.20, ‐$0.06) 4: $0.17 (‐$0.03, $0.38) |
| Pavcnik 2002 | Reference pricing on oral antidiabetics (i.e. glibenclamide) and antiulcerants (in particular, H2 antagonists) | Price of average daily dose (1990 Deutsche marks) | Depending on the therapeutic group and specification, the estimates of average price reductions due to changes in insurance reimbursement range from 10% for generic drugs to 26% for brand drugs.# |
*Long post periods: 1993 to 1996
#Long post periods: 1989 to 1996 for antidiabetics and 1993 to 1996 for antiulcerants
8. Index pricing versus no index pricing: drug use.
| STUDY ID | POLICY: INDEX PRICING FOR | OUTCOME | ABSOLUTE CHANGE IN LEVEL, IMMEDIATE AFTER TRANSITION PERIOD (95% CI) | RELATIVE CHANGE IN LEVEL, IMMEDIATE AFTER TRANSITION PERIOD (95% CI) | RELATIVE CHANGE IN LEVEL, 1/2 YEAR AFTER TRANSITION PERIOD (95% CI) |
| GENERIC DRUGS | |||||
| Brekke 2003* | Citalopram | Monthly DDDs sold | 437,368 (247,454 to 627,282) | 114% (64% to 164%) | 55% (11% to 98%) |
| BRAND DRUGS | |||||
| Brekke 2003* | Citalopram | Monthly DDDs sold | ‐599,489 (‐982,279 to ‐216,699) | ‐29% (‐48% to ‐11%) | ‐43% (‐67% to ‐18%) |
*Results from reanalysis by reviewers
9. Index pricing versus no index pricing: copayments and drug prices.
| STUDY ID | INDEX PRICING FOR | OUTCOME | IMMEDIATE CHANGE AFTER POLICY START DATE (95% CI) | CHANGE 6 MONTHS AFTER POLICY START DATE | |
| Brekke 2003 | The RP covered six chemical substances: citalopram, omeprazol, cetirizin, loratadin, enalapril and lisinopril. The system was later extended with two additional substances; simvastatin and amlodipin | Change in copayments NOK | Generic copayment ‐12.9% (95% CI NA) Brand‐name copayment ‐6.4% (95% CI NA) |
Generic copayment ‐12.8% (95% CI NA) Brand‐name Copayment ‐14.8% (95% CI NA) |
|
| Generic drug prices | ‐4.0 % (‐5.14%, ‐2.90%) | ‐5.30 % (95% CI NA) | |||
| Brand drugs prices | ‐0.8 % (95% CI NA) | ‐1.1 % (95% CI NA) |
*NA = Not available
10. Maximum prices versus no maximum prices: drug expenditures.
| STUDY ID | MAXIMUM PRICE FOR | OUTCOME | ABSOLUTE CHANGE LEVEL, IMMEDIATE AFTER TRANSITION PERIOD (95% CI) | RELATIVE CHANGE IN LEVEL, IMMEDIATE AFTER TRANSITION PERIOD (95% CI) | RELATIVE CHANGE IN LEVEL, 1/2 YEAR AFTER TRANSITION PERIOD (95% CI) | RELATIVE CHANGE IN LEVEL, 1 YEAR AFTER TRANSITION PERIOD (95% CI) | RELATIVE CHANGE IN LEVEL, 2 YEARS AFTER TRANSITION PERIOD (95% CI) | NOTES |
| DRUG CLASS, TOTAL | ||||||||
| Puig 2007 | Statins | Mean monthly change | Not reported | Not reported | Not reported | 21.4% (19.0 to 23.7) increase of volume in sales for all statins in Andalusia | Not reported | Also reported the impact after one year of maximum consumer prices plus proportion of off‐patent statin prescriptions (MCP plus PI) |
For three outcomes, cumulative drug expenditure, drug expenditures and drug use, we included additional information about the expected effects in order to provide additional insight: effects on reference drugs, effects on cost share drugs, and effects on both reference drugs and cost share drugs. These are important factors for understanding the effects of the main outcomes.
Reference drugs: drugs that determine the reference price level. There is no cost share by the patients for these drugs, which are fully reimbursed. The expectation is that reference pricing will lead to an increase in the use of these drugs.
Cost share drugs: drugs in the same group as the reference drugs that cost more. Patients have to pay the difference between the reference price drugs and the price of these drugs. The expectation is that reference pricing will lead to a decrease in the use of these drugs.
Reference drugs + cost share drugs: both the reference drugs and the cost share drugs. The expectation is that reference pricing will lead to little or no change in the overall use of these drugs.
Reference pricing ('Summary of findings' table 1)
We included and assessed 17 studies (Aronsson 2001; Brekke 2011; Grootendorst 2002; Grootendorst 2005; Grootendorst 2006; Hazlet 2002; Kibicho 2012; Marshall 2002; McManus 2001; Moreno‐Torres 2011; Narine 2001; Pavcnik 2002; Puig 2007; Sawyer 1983; Schneeweiss 2002; Schneeweiss 2003; Stargardt 2010).
Some studies reported cumulative changes in drug expenditures while others reported absolute drug expenditures at specific time points. We have reported those results separately.
Insurer's change in cumulative drug expenditures at specified time points
See: Table 4.
Five studies (Grootendorst 2002; Kibicho 2012; Marshall 2002; Moreno‐Torres 2011; Puig 2007) assessed the change in cumulative drug expenditures. All of the studies were ITS studies.
Three reference pricing studies reported cumulative drug expenditures at one year after the transition period. Two studies (Grootendorst 2002; Marshall 2002) reported median relative insurer's cumulative expenditures on both the reference drugs and cost share drugs of ‐18%, ranging from ‐36% to 3% at one year after the transition period. Two studies (Grootendorst 2002; Marshall 2002) reported median relative insurer's cumulative expenditures on reference drugs of ‐16%, ranging from ‐37% to 4% at two years after the transition period.
Moreno‐Torres 2011 reported relative insurer's cumulative expenditures on the total market of ‐1.5%.
Kibicho 2012 reported absolute cumulative drug expenditures at one year after the transition period for four groups of drugs (both reference drugs and cost share drugs).
Antihypertensive drugs: USD 18,562 (95% CI ‐93 to 37,217).
Antihyperlipidemic drugs: USD 15,322 (95% CI ‐30,452 to 61,096).
Generic drugs: USD ‐35,448 (95% CI ‐50,470 to ‐20,425).
Brand‐name drugs: USD 69,331 (95% CI 21,553 to 117,109).
Puig 2007 reported on mean monthly savings of total statin sales 10 months after the intervention and attributed to the RP revision applied to two reference drugs.
Simvastatin: Andalusia ‐29.7% (‐26.8% to ‐32.6%) and rest of Spain ‐51.8% (‐48.9% to ‐54.6%).
Lovastatin: Andalusia ‐11.5% (‐3.5% to ‐19.5%) and rest of Spain ‐16.3% (‐23.4 to ‐9.1).
Relative change in insurer's drug expenditures at specified time points
See: Table 9.
Six studies (Brekke 2011; Grootendorst 2002; Grootendorst 2005; Grootendorst 2006; Marshall 2002; Sawyer 1983) assessed the change in drug expenditures at specified time points.
Four reference pricing studies (Grootendorst 2002; Grootendorst 2005; Grootendorst 2006; Marshall 2002) reported the median relative insurer's expenditures on both reference drugs and cost share drugs of ‐10%, ranging from ‐53% to 4% at one year after the transition period.
Brekke 2011 reported absolute change level at two time points.
Immediately after the transition period on cost share drugs:
generic copayment ‐12.92 (95% CI not applicable (NA));
brand‐name copayment ‐6.37 (95% CI NA).
Two years after the transition period on cost share drugs:
generic copayment ‐12.76% (95% CI NA);
brand‐name copayment ‐14.82% (95% CI NA).
Sawyer 1983 reported the absolute and relative change levels on monthly Medicaid drug expenditures in Maryland for both reference drugs and cost share drugs:
absolute change immediate after transition period: USD 291,276 (95% CI ‐478,458 to ‐104,094);
relative change six months after transition period: USD ‐0.87 per month (95% CI NA).
Drug use
See: Table 10.
Ten studies about reference drugs (Grootendorst 2002; Grootendorst 2005; Grootendorst 2006; Hazlet 2002; McManus 2001; Moreno‐Torres 2011; Narine 2001; Schneeweiss 2002; Schneeweiss 2003; Stargardt 2010).
Four reference pricing studies (Grootendorst 2005; Grootendorst 2006; Schneeweiss 2002; Stargardt 2010) reported a median relative change of 15% on reference drugs prescriptions at one year (range: ‐14% to 166%).
Three studies (Grootendorst 2002; McManus 2001; Narine 2001) reported a relative change on reference drugs prescriptions six months after transition period of 131% (range: ‐35% to 251%).
Hazlet 2002 reported that six months after transition period no significant difference in slope pre versus post intervention (P = 0.08)
Schneeweiss 2003 reported a maximum increase of 60% on the number of median CCBs monthly doses dispensed per 10000 senior residents immediate after transition period.
Three reference pricing studies (Grootendorst 2006; Schneeweiss 2002; Stargardt 2010) reported median relative change of ‐39% on cost share drugs prescriptions at one year (range: ‐87% to ‐17%).
Four reference pricing studies Grootendorst 2006; Schneeweiss 2002; Schneeweiss 2003; Stargardt 2010 reported median relative change of ‐10.5% on both reference drugs and cost share drugs prescriptions at one year (range: ‐12% to ‐8%).
Moreno‐Torres 2011 reported no change on prescription per capita from 1995 to 2006.
Grootendorst 2005 also reported for a Type 1 RP—only chemically equivalent drugs ‐3% days opiates dispensed per 1000 seniors. For Type 2 RP, all drugs from the same therapeutic class considered interchangeable 106% days opiates dispensed per 1000 seniors.
Drug prices and patients' out of pocket payments
See: Table 11.
In three studies reference pricing appeared to reduce drug prices. In Pavcnik 2002 the estimate of price reductions for oral antibiotics was 18%. The prices of generics dropped by an average of 11% whereas the decline in brand prices was 26%. For anti‐ulcer drugs the estimated reductions ranged from 12% to 26%. All the estimates were statistically significant at the 5% level. Aronsson 2001 also found that brand prices were reduced, but did not report comparable data.
The absolute change observed in Kibicho 2012 for specific drug prices was:
antihypertensive drugs USD 0.06 (95% CI 0 to 0.12) per beneficiary;
antihyperlipidaemic drugs USD 0.37 (95% CI 0.09 to 0.64) per beneficiary;
generic drugs USD ‐0.13 (95% CI ‐0.20 to ‐0.06) per beneficiary;
brand‐name drugs USD 0.17 (95% CI‐0.03 to 0.38) per beneficiary.
Brekke 2011 assessed copayments for a group of generic and brand‐name drugs two years after a reference pricing policy. In Brekke 2011 copayments prices decreased 13% for generic drugs and 23% for brand‐name drugs.
Healthcare utilisation
In the previous version of this review (Aaserud 2006b), four analyses (Grootendorst 2002; Hazlet 2002; Schneeweiss 2002; Schneeweiss 2003) reported emergency room visits, four analyses (Grootendorst 2002; Hazlet 2002; Schneeweiss 2002; Schneeweiss 2003) reported hospital admissions, and four studies (Grootendorst 2002; Hazlet 2002; Schneeweiss 2002; Schneeweiss 2003) reported physician office visits and physician ambulatory consults. For all these outcomes the studies reported effects at different time points after the intervention, from one to 47 months.
All these analyses were excluded from this update because they were CBA studies with fewer than two intervention sites and two control sites.
Mortality
In the previous version of this review (Aaserud 2006b), two CBA analyses (Grootendorst 2002; Schneeweiss 2002) assessed mortality. Because these analyses had only one intervention site, they were excluded from this update.
As happened with the healthcare utilisation outcome, these analyses were excluded from this update because they were CBA studies with fewer than two intervention sites and two control sites.
Index pricing
See: Table 2.
We identified one study of index pricing (Brekke 2003), from Norway. It evaluated the effects of index pricing on drug use and drug prices for eight drugs.
Drug use
See:Table 12.
The effects on use of drugs in the index pricing groups were not analysed appropriately in the report. Based on graphs, we conducted an ITS analysis of the effect on the use of brand and generic citalopram only. The use of brand citalopram decreased relative to the use prior to index pricing, by 29 % (95% CI ‐11% to ‐48%) immediately afterwards and 43% (95% CI ‐18% to ‐67%) at six months after the transition period following the introduction of the index pricing system. The use of generic citalopram increased by 114% (95% CI 64% to 164%) immediately afterwards and 55% (95% CI 11% to 98%) at six months.
Drug prices
See: Table 13.
Brand and generic drug prices were both reduced. The reduction in brand drug prices was not statistically significant. The generic drug prices were reduced by 4.0% (95% CI 2.9% to 5.1%) relative to the price prior to index pricing immediately afterwards and by 5.3% at six months after the transition period. The brand drug prices were reduced by 0.8% relative to the price prior to index pricing immediately afterwards and by 1.1% at six months after the transition period.
Maximum prices
We identified one study of maximum prices (Puig 2007), from Andalusia in Spain. This study was designed as an ITS analysis with a comparison series of 46 months drug use and sales figures from January 2001 to October 2004 for each active ingredient. Three public reimbursement reforms were applied to the prescription of the six commercially available statins: a Spanish generic reference pricing system for lovastatin and simvastatin; and two competing policies introduced by the Andalusian Public Health Service for all statins, first a maximum consumer price (MCP) and then a so‐called quality prescribing incentive (PI) for general practitioners (MCP plus PI), similar to a generic prescribing incentive.
Drug expenditures
This study reported an increase in drug expenditures with a MCP one year after the transition period from when the policy was started of 21% (95% CI 19% to 24%) due to an increase in the volume of sales for all statins.
Discussion
Summary of main results
We included 18 studies (seven new studies in this update). Detailed results for the included studies are provided in the 'Additional tables' (Table 8; Table 9; Table 10; Table 11; Table 12; Table 13; Table 14). None included reference reported adverse effects caused by the pricing policy interventions. There was no information in the included studies regarding the differential effects of the interventions on resource‐disadvantaged populations.
We found no evidence of effects on heath and healthcare utilisation outcomes. The four studies included in the original review that used a CRM or CBA studies design to assess the health and healthcare utilisation outcomes (Grootendorst 2002; Hazlet 2002; Schneeweiss 2002; Schneeweiss 2003) were excluded from SOF tables and from the main report in this update according to EPOC Group recommendation (August 2013): “We recommend only including cluster randomised trials, non‐randomised cluster trials, and CBA studies with at least two control sites”. All these analyses were excluded from this update because they were CBA studies with fewer than two intervention sites and two control sites.
The amount and quality of the evidence are larger for the effects on use and expenditures of reference drugs than for the effects on cost share drugs.
In the included studies the aggregate use of reference drugs increased, while the use of cost share drugs decreased. This was the intention of the policy. Thus, there seems to be an aggregate shift of drug use within each reference drug group. The total use of drugs did not change as much but there were some changes, which might be a little surprising. The idea of reference pricing is to shift the drug use within each reference group from expensive to cheaper but equally effective drugs, with no intended impact on the total use of drugs in the reference group.
Reference pricing
We found that internal reference pricing may reduce third party drug expenditures immediately and for six months and one or two years. Although the immediate and six month results are very consistent, we prioritised reporting results at one or more years because they are less exposed to secular changes and to the effects of the transition period. The change in expenditures can be deconstructed to different effects, a) a shift in drug use from more expensive to less expensive drugs within the reference drug groups; b) patients or their private insurers paying a larger part of the expenditures; c) reduced prices; d) reduced total use of drugs in the reference drug groups. The studies provided little systematic information on which of these factors were the main factors behind the reduction in drug expenditures for third parties. The results indicate a shift in drug use from cost share drugs to less expensive reference drugs. However, it is not clear what proportion of the drug expenditure reduction can be accounted for by this shift.
Reference pricing may reduce expenditures related to effects on reference drugs, and the effect on expenditures of cost share drugs is uncertain. Reference pricing may increase the use of reference drugs and may reduce the use of cost share drugs. Two studies reported median relative insurer's cumulative expenditures on both reference drugs and cost share drugs of ‐18%, ranging from ‐36% to 3%. A third study reported relative insurer's cumulative expenditures on the total pharmaceutical market of ‐1.5%. Four reference pricing studies reported the median relative insurer's expenditures on reference drugs and cost share drugs of ‐10%, ranging from ‐53% to 4% at one year after the transition period. Four reference pricing studies reported a median relative change of 15% in reference drug prescriptions at one year (range ‐14% to 166%). Three reference pricing studies reported a median relative change of ‐39% in cost share drug prescriptions at one year (range ‐87% to ‐17%). The observed changes in expenditures outcomes are consistent with the observed drug use effects: reference pricing may increase the use of reference drugs and may reduce the use of cost share drugs. As is expected four reference pricing studies reported a median relative change of 15% in reference drug prescriptions at one year (range ‐14% to 166%). Three reference pricing studies reported a median relative change of ‐39% in cost share drug prescriptions at one year (range ‐87% to ‐17%).
The size of the savings varied across the different reference pricing policies. There are a number of potential explanations for this variation, such as how big the difference in cost is between the reference and price share drugs (Table 7). The available data do not provide a reliable basis for assessing the extent to which such factors explain the observed variation in the effects of reference pricing.
The effects of reference pricing on drug use and expenditures beyond two years are uncertain. Ioannides‐Demos 2002; Zammit‐Lucia 1995 and others have claimed that reference pricing does not reduce long term growth in drug expenditures since reference pricing mainly addresses only two of the drivers that increase drug expenditures (listed above): prices and shifts in drug use within the reference group of drugs. We found no data for long term growth effects that could support or refute this. However, even if the short term reductions in drug expenditures growth rates are not sustained, the absolute difference in drug expenditure could be sustained for many years.
The effects of reference pricing on drug prices and patients' out of pocket payments are also uncertain. In three studies reference pricing appeared to reduce drug prices, and in one study copayment prices decreased 13% for generic drugs and 23% for brand‐name drugs.
An argument against reference drug pricing is that it could lead to disincentives to pharmaceutical innovation (Ioannides‐Demos 2002). It is hard to document such effects of reference pricing empirically. We have not identified such documentation.
Other policies
The evidence for other policies is much more limited than for reference pricing. Brekke 2003 evaluated index pricing half a year after the policy started (Table 2). The effects on the prices of generic and brand drugs (though not statistically significant for the latter category) as well as on the use of generic and brand citalopram were all in the direction intended by the policy makers.
Index pricing may reduce the use of brand drugs and increase the use of generic drugs compared with no intervention. In addition, index pricing may slightly reduce the price of the generic drugs.
Puig 2007 evaluated maximum prices (Table 3). One year after the policy was introduced, the volume of sales for total statins increased unexpectedly by 21.4% as a result of quantity increases for atorvastatin, an on‐patent statin, possibly as a result of marketing efforts to shift drug use to higher‐priced statins (Puig 2007).
Overall completeness and applicability of evidence
This update is a complete review of the available evidence up to December 2012.
Several factors may limit the applicability of this evidence. These are that
all of the included studies were conducted in high‐income countries;
the target populations were vulnerable groups covered by national insurance plans;
the studies were limited to specific groups of drugs.
Most of the included studies on reference pricing were for senior citizens in British Columbia, Canada. The applicability of these interventions to low‐ and middle‐income country settings depends on several factors such as the
availability and access to drugs; t
he presence of significant price differences between the drugs in a reference group before the reference price system is introduced, with relatively high prices on the drugs most used;
the alignment of stakeholders' interests and the availability of adequate incentives for patients, physicians, pharmacists and pharmaceutical companies to comply with the reference price system;
provision of clinical and managerial information and support; and
quality control of generics drugs.
Other factors that might modify the effects of reference pricing include the equivalence of drugs in a reference group, exemptions and the availability of electronic information systems (Table 7). We did not find evidence to support or refute the impact of these factors. Logically, the drugs in a reference drug group should be therapeutically similar. If they are not, the patients may have to pay more to get the most effective drug, or they may choose less effective drugs. There should be reasonable mechanisms for exemptions for patients that need such drugs for medical reasons. Too limited exemptions could lead to higher copayments for the most effective drug and to prescribing of less effective drugs by physicians. Too generous exemptions could reduce the savings by not shifting the drug use towards cheaper drugs. The administration costs, like time use for identifying, prescribing and dispensing the reference drugs and for handling exemption cases, should be as low as possible. An electronic processing system would be useful and potentially time saving. The lack of an electronic processing system might reduce the feasibility and increase the costs of reference pricing.
The existence of a regulatory framework that allows generic substitution or prescribing by international non‐proprietary names could be important for pricing policy interventions.
None of the included studies provided a full analysis of cost‐effectiveness or data on administration costs related to reference pricing. Such costs would be related to the logistic system and incentives for physicians, pharmacists and drug insurance administrators for handling prescriptions and exemptions. In a paper that did not meet our study design inclusion criteria, Schneeweiss 2004b estimated the administrative spending due to the reference pricing for ACE inhibitors in British Columbia, Canada. The administrative expenditures related to the design, implementation, and ongoing support for the policy were estimated to approximately 7% (CAD 0.42 million to CAD 6.2 million) of the savings during the first year of the policy. In another paper excluded from our review, ECON 2000 estimated the time costs for physicians and pharmacists related to a generic reference pricing system in Norway. The time costs were estimated to be approximately 60% of the public drug insurance savings.
We identified only one study of rate of return regulation, which did not meet our inclusion criteria (Borrell 1999). The study indicated that the aggregate medicine price index in the UK changed (relatively) by 0.15% in relationship to a 1.00% change in the rate of return cap.
Four studies from low‐ and middle‐income countries (Brazil) were identified in the LILACS database but they did not meet our inclusion criteria. Three of them (Barberato 2007; Inocencio 2010; Vieira 2006) evaluated use and expenditure outcomes after a generic drug policy was implemented in 1999. This policy promotes replacement of brand drugs with generics in national procurements.
All included studies were conducted in high‐income countries: Canada (eight); German (two), USA (two), Spain (two), Norway (two), Sweden (one) and Australia (one). Taking into account the factors listed in Table 7 we must be cautious to extrapolate the finding of our systematic review to low‐ and middle‐income countries.
Quality of the evidence
Five out of 17 studies of reference pricing were judged to have a high risk of bias in this update. The included ITS study of maximum prices policy also had a high risk of bias. It was unclear whether the intervention was independent of other changes in 11 out of 32 analyses and the intervention was not independent of other changes in another six analyses (Figure 2). The quality of evidence was low for all of the outcomes reported in the included studies for reference pricing (except the insurer's cumulative drug expenditures one year after the transition period for the effect on reference drugs plus cost share drugs where it was very low) (Table 1). For index pricing policy the quality of the evidence was low (Table 2), and was very low for maximum prices policy (Table 3).
Potential biases in the review process
Strengths of this update include a thorough search, systematic assessment of the risk of bias in the included studies, exclusion of CBA studies with only a single intervention site and a high risk of bias (EPOC 2013a), and appropriate analyses of all of the included ITS and RM studies (EPOC 2013b). It is unlikely that important published studies were not identified considering our highly sensitive search that yielded 26,797 references which were screened. However, it is possible that studies in the grey literature, such as working papers or internal government reports, have not been identified. It is uncertain whether there might be a publication bias. Although there may be unpublished studies that we did not identify, and those studies might have found systematically different results (smaller effects), we are unaware of any evidence to support this. The effects in the included studies varied, with some studies reporting little or no effect and some studies reporting findings in opposite directions.
Agreements and disagreements with other studies or reviews
The findings of this update are largely consistent with the findings of the previous version of this review (Aaserud 2006b). Key differences are the following.
We included seven new studies of reference pricing and one of maximum prices.
We excluded four analyses (Grootendorst 2002; Hazlet 2002; Schneeweiss 2002; Schneeweiss 2003) that reported emergency room visits, four analyses (Grootendorst 2002; Hazlet 2002; Schneeweiss 2002; Schneeweiss 2003) that reported hospital admissions, four analyses (Grootendorst 2002; Hazlet 2002; Schneeweiss 2002; Schneeweiss 2003) that reported physician office visits and physician ambulatory consults, and two analyses that reported mortality (Grootendorst 2002; Schneeweiss 2002). All of these analyses were excluded because they were CBA analyses with only one intervention site. Consequently, we did not report any evidence of the effects of reference pricing on healthcare utilisation or health outcomes in this update, whereas in the previous version of this review that evidence was reported as very low quality evidence.
We assessed the evidence of the effects of reference pricing on drug use as low quality in this update, whereas it was assessed as moderate quality in the previous version. This was because in the previous version we modified the GRADE approach and initially graded ITS and RM studies as moderate quality evidence. In this update we adhered to the GRADE guidance (Balshem 2011) and initially graded ITS and RM studies as low quality.
Galizzi 2011 reviewed studies of the effects of reference pricing policies in OECD countries, including both theoretical and empirical studies. Some of the 30 empirical articles that were included agree with our included studies and showed that prices of drugs are likely to drop, and that more significant price decreases are observed in the submarkets in which drugs are already facing generic competition prior to reference pricing. Brand‐named drugs originally priced above reference pricing values decreased their prices to a greater extent. The review also found that following the introduction of reference pricing, the generics market share significantly increased whenever the firms producing brand‐name drugs did not adopt one of the following strategies: lowering prices to the reference pricing value, launching new dosages and formulations, or marketing substitute drugs still under patent protection. In the case of therapeutic clusters (level 3 reference pricing), although more evidence is needed the studies that were based on a large number of patient level observations showed no association between reference pricing and health losses for the patients.
Other recent reviews of pricing policies, including reference drug pricing (Puig‐Junoy 2010; Puig‐Junoy 2010a) and systematic reviews of pharmaceutical policies that include some pricing policies (Danzon 2008; Faden 2011; Puig‐Junoy 2010a), also have findings that are consistent with the findings of this review.
Puig‐Junoy 2010 and Puig‐Junoy 2010a included descriptive publications about generic competition and excluded theoretical models, comments or editorial letters. The 14 included studies published after 1999 provide a descriptive categorization of the main regulatory reforms in European countries. Direct price regulation or the generic reference pricing systems used to reduce generic drug prices were found to be successfully implemented in reforms by adopting measures that encourage consumer price competition in generic drug markets.
Danzon 2008 compared pharmaceutical spending, availability, use and prices in 12 countries including the USA in 2005. They found that in recent years several European Union countries have changed their rules governing generics to expand pharmacists’ authority and incentives to substitute cheaper generics. Comprehensive price indices show foreign prices to be 20% to 40% lower than US manufacturer prices but only 10% to 30% lower than US public prices.
Faden 2011 reviewed pharmaceutical management strategies to improve the cost‐effectiveness of medicines in the context of health insurance systems in low‐ and middle‐income countries. Even though the internal and external validity of the three identified references regarding generic reference pricing is questionable, this policy was found to decrease and stabilize medicine prices and to improve access.
Authors' conclusions
Implications for practice.
Based on the evidence assessed in this review, internal reference pricing may decrease third party drug expenditures shifting drug use from cost share drugs to reference drugs in the short term. Reference pricing may reduce expenditures related to medicines under the reference pricing policy. Internal reference pricing shows the expected effect of the policy since it may increase the use of reference drugs and reduce the use of cost share drugs. The size of these effects varies and the effects beyond two years are uncertain. Effects on out of pocket patient expenditures, administration costs, healthcare utilisation and health outcomes are uncertain. The effects of other purchasing and pricing policies are until now uncertain due to sparse evidence. However, index pricing may also shift drug use towards less expensive generic drugs. Index pricing may reduce the use of brand drugs, increase the use of generic drugs and slightly reduce the price of the generic drugs but its effects on other outcomes are uncertain. None of the included studies reported on adverse effects caused by pricing policy interventions.
Implications for research.
We found a number of well‐designed evaluations of reference pricing and only two evaluations of other pharmaceutical pricing and purchasing policies. Although we performed an extensive literature search, there could be some more studies in the grey literature. Updates of this review will include further efforts to identify studies in the grey literature.
More than half of the reference drug pricing studies were from British Columbia, Canada. It is important to conduct evaluations in different settings, particularly in low‐ and middle‐income countries. The study designs in our included studies were mostly interrupted time series designs for drug use and drug costs. Such observational designs have limitations, however they may be the most appropriate design for evaluating pharmaceutical policies when randomised trials are not feasible. This is likely to be the case for pricing and purchasing policies which typically must be implemented in a country or large jurisdiction.
Because pharmaceutical policies have uncertain effects and they might cause harms as well as benefits, it is important that they are properly evaluated. Evaluations should be planned ahead of introducing the policies and should be a routine part of the policy process.
What's new
| Date | Event | Description |
|---|---|---|
| 21 August 2019 | Amended | A link to a summary for policy‐makers was added to the plain language summary |
History
Protocol first published: Issue 3, 2003 Review first published: Issue 2, 2006
| Date | Event | Description |
|---|---|---|
| 22 September 2014 | New citation required but conclusions have not changed | The review team has changed since the previous update. |
| 30 December 2013 | New search has been performed | We included seven more studies in this update and we excluded results from controlled studies with only one control site, which had been included in the previous review. |
| 15 October 2011 | New search has been performed | Papers from january 2012 search reviewed and data incorporated as appropiate. 3 new studies included (Grootendorst 2006; Puig 2007; Stargardt 2010), and 1 added to studies awaiting assessment (Li 2008a), pending more information from the authors. Risk of bias tables generated. Text updated, no change in overall conclusions. |
| 18 March 2009 | Amended | Correction to typographical error. |
| 22 August 2008 | Amended | Converted to new review format. |
| 25 January 2006 | New citation required and conclusions have changed | Substantive amendment |
Acknowledgements
We gratefully acknowledge the following.
For the previous version of this review:
‐ Sue Hill, Malcolm Maclure, Carolyn J Green and Kristin Kamilla Linnestad helped sift references and abstracts from the broad literature search for pharmaceutical policies and commented on drafts of the data collection form. Kristin Kamilla Linnestad also assessed one study (Brekke 2003) together with MOA. ‐ Doris Tove Kristoffersen and Torbjørn Wisløff provided statistical advice. ‐ Curt D Furberg, Mark Gibson, Roberto Grilli, David A Henry, Bob Nakagawa, Dennis Ross‐Degnan, Gail Shearer, Stephen B Soumerai, Luke Vale, Lisa Bero, Kirby Lee, Merrick Zwarenstein and Alain Mayhew provided helpful comments on drafts of the protocol or the review, or both. ‐ Morten Bjørklund, Matthew Oxman, Kjetil Olsen and the Library of the Norwegian Directorate for Health and Social Affairs helped retrieve, copy and register papers.
For this update:
‐ Marit Johansen and Daniel Comandé conducted the literature searches. ‐ Julián Lopez from Centro de Información de Medicamentos (CIMUN), Universidad Nacional de Colombia, supported the research project with Colcencias (Grant Code ‐ 110151929152/2011)
Appendices
Appendix 1. Search strategies
1. CENTRAL, Cochrane Library
| #1 MeSH descriptor: [Drug Costs] this term only |
| #2 MeSH descriptor: [Economics, Pharmaceutical] this term only |
| #3 MeSH descriptor: [Fees, Pharmaceutical] this term only |
| #4 MeSH descriptor: [Prescription Fees] this term only |
| #5 MeSH descriptor: [Pharmaceutical Preparations] explode all trees and with qualifiers: [Economics ‐ EC] |
| #6 MeSH descriptor: [Drug Prescriptions] this term only and with qualifiers: [Economics ‐ EC] |
| #7 MeSH descriptor: [Drug Substitution] this term only and with qualifiers: [Economics ‐ EC] |
| #8 #1 or #2 or #3 or #4 or #5 or #6 or #7 |
| #9 MeSH descriptor: [Pharmaceutical Preparations] explode all trees |
| #10 MeSH descriptor: [Drug Prescriptions] this term only |
| #11 MeSH descriptor: [Drug Substitution] this term only |
| #12 #9 or #10 or #11 |
| #13 MeSH descriptor: [Economics] this term only |
| #14 MeSH descriptor: [Health Expenditures] this term only |
| #15 MeSH descriptor: [Costs and Cost Analysis] this term only |
| #16 MeSH descriptor: [Health Care Costs] this term only |
| #17 MeSH descriptor: [Cost Control] this term only |
| #18 MeSH descriptor: [Cost Savings] this term only |
| #19 MeSH descriptor: [Commerce] this term only |
| #20 MeSH descriptor: [Rate Setting and Review] this term only |
| #21 #13 or #14 or #15 or #16 or #17 or #18 or #19 or #20 |
| #22 MeSH descriptor: [Policy] this term only |
| #23 MeSH descriptor: [Health Policy] this term only |
| #24 MeSH descriptor: [Health Care Reform] this term only |
| #25 MeSH descriptor: [National Health Programs] this term only |
| #26 MeSH descriptor: [Policy Making] this term only |
| #27 MeSH descriptor: [Government Regulation] this term only |
| #28 MeSH descriptor: [Legislation, Drug] this term only |
| #29 MeSH descriptor: [Politics] this term only |
| #30 (policy or policies or politics or plan or plans or planning or program* or regulat* or legislat*):ti,ab |
| #31 #22 or #23 or #24 or #25 or #26 or #27 or #28 or #29 or #30 |
| #32 (reference or index or "volume based" or reimburs* or "best available") near/3 (price or prices or pricing) near/3 (drug or drugs or pharmaceutic* or medicines or medicat*):ti,ab |
| #33 (max* or minim* or reimburs* or ceiling or fixed) near/3 (price or prices or pricing or cost or costs) near/3 (drug or drugs or pharmaceutic* or medicines or medicat*):ti,ab |
| #34 (price or prices) near/3 (control or controls or caps or negotiat* or compar* or cut or cuts or freez*) near/3 (drug or drugs or pharmaceutic* or medicines or medicat*):ti,ab |
| #35 ("price volume" or "cost plus") near/3 (drug or drugs or pharmaceutic* or medicines or medicat*):ti,ab |
| #36 (profit near/3 regulat* or profit near/3 limit*) near/3 (drug or drugs or pharmaceutic* or medicines or medicat*):ti,ab |
| #37 (procure* or purchas* or rebate or acquisition or econom* or financ* or sale or sales) near/3 (policy or policies or intervention*) near/3 (drug or drugs or pharmaceutic* or medicines or medicat*):ti,ab |
| #38 #32 or #33 or #34 or #35 or #36 or #37 |
| #39 (drug or drugs or pharmaceutic* or medicines or medicat*) near/6 (cost or costs or fee or fees or expenditure* or expense* or price or prices or pricing or spending* or purchas* or procure* or acquisition or sale or sales) near/6 (policy or policies or intervention* or politics or plan or plans or planning or program* or regulat* or legislat*):ti,ab |
| #40 #8 and #31 |
| #41 #12 and #21 and #31 |
| #42 #38 or #39 or #40 or #41 |
2. MEDLINE In‐Process & Other Non‐Indexed Citations and MEDLINE, Ovid
| # | Searches | Results |
| 1 | Drug Costs/ | 11364 |
| 2 | Economics, Pharmaceutical/ | 2379 |
| 3 | Fees, Pharmaceutical/ | 1105 |
| 4 | Prescription Fee/ | 939 |
| 5 | exp Pharmaceutical Preparations/ec [Economics] | 4131 |
| 6 | Drug Prescriptions/ec [Economics] | 2562 |
| 7 | Drug Substitution/ec [Economics] | 36 |
| 8 | or/1‐7 | 18829 |
| 9 | exp Pharmaceutical Preparations/ | 587714 |
| 10 | Drug Prescriptions/ | 20886 |
| 11 | Drug Substitution/ | 487 |
| 12 | or/9‐11 | 606182 |
| 13 | Economics/ | 26629 |
| 14 | Health Expenditures/ | 12736 |
| 15 | "Costs and Cost Analysis"/ | 40253 |
| 16 | Health Care Costs/ | 24066 |
| 17 | Cost Control/ | 19418 |
| 18 | Cost Savings/ | 7866 |
| 19 | Commerce/ | 16300 |
| 20 | "Rate Setting and Review"/ | 2438 |
| 21 | or/13‐20 | 138351 |
| 22 | Policy/ | 457 |
| 23 | Health Policy/ | 47001 |
| 24 | Health Care Reform/ | 26362 |
| 25 | National Health Programs/ | 23941 |
| 26 | Policy Making/ | 11218 |
| 27 | Government Regulation/ | 16371 |
| 28 | Legislation, Drug/ | 8329 |
| 29 | Politics/ | 38756 |
| 30 | (policy or policies or politics or plan or plans or planning or program* or regulat* or legislat*).ti,ab. | 1890437 |
| 31 | or/22‐30 | 1987077 |
| 32 | ((reference or index or volume based or reimburs* or best available) adj3 (price or prices or pricing) adj3 (drug or drugs or pharmaceutic* or medicines or medicat*)).ti,ab. | 141 |
| 33 | ((max* or minim* or reimburs* or ceiling or fixed) adj3 (price or prices or pricing or cost or costs) adj3 (drug or drugs or pharmaceutic* or medicines or medicat*)).ti,ab. | 219 |
| 34 | ((price or prices) adj3 (control or controls or caps or negotiat* or compar* or cut or cuts or freez*) adj3 (drug or drugs or pharmaceutic* or medicines or medicat*)).ti,ab. | 156 |
| 35 | ((price volume or cost plus) adj3 (drug or drugs or pharmaceutic* or medicines or medicat*)).ti,ab. | 5 |
| 36 | (profit adj3 (regulat* or limit*) adj3 (drug or drugs or pharmaceutic* or medicines or medicat*)).ti,ab. | 1 |
| 37 | ((procure* or purchas* or rebate or acquisition or econom* or financ* or sale?) adj3 (policy or policies or intervention?) adj3 (drug or drugs or pharmaceutic* or medicines or medicat*)).ti,ab. | 57 |
| 38 | or/32‐37 | 493 |
| 39 | ((drug or drugs or pharmaceutic* or medicines or medicat*) adj6 (cost or costs or fee or fees or expenditure? or expense? or price or prices or pricing or spending? or purchas* or procure* or acquisition or sale?) adj6 (policy or policies or intervention? or politics or plan or plans or planning or program* or regulat* or legislat*)).ti,ab. | 1491 |
| 40 | 8 and 31 | 5191 |
| 41 | 12 and 21 and 31 | 1508 |
| 42 | 38 or 39 or 40 or 41 | 6931 |
| 43 | randomized controlled trial.pt. | 340079 |
| 44 | controlled clinical trial.pt. | 85448 |
| 45 | multicenter study.pt. | 151515 |
| 46 | (randomis* or randomiz* or randomly).ti,ab. | 487333 |
| 47 | groups.ab. | 1210865 |
| 48 | (trial or multicenter or multi center or multicentre or multi centre).ti. | 128649 |
| 49 | (intervention* or controlled or control group or compare or compared or (before adj5 after) or (pre adj5 post) or pretest or pre test or posttest or post test or quasiexperiment* or quasi experiment* or evaluat* or effect? or impact? or time series or time point? or repeated measur*).ti,ab. | 6850206 |
| 50 | or/43‐49 | 7373617 |
| 51 | exp Animals/ | 16427399 |
| 52 | Humans/ | 12629645 |
| 53 | 51 not (51 and 52) | 3797754 |
| 54 | comment.pt. | 521909 |
| 55 | editorial.pt. | 319891 |
| 56 | cochrane database of systematic reviews.jn. | 9224 |
| 57 | comment on.cm. | 521908 |
| 58 | review.pt. | 1748075 |
| 59 | review.ti. | 227088 |
| 60 | or/53‐59 | 6198639 |
| 61 | 50 not 60 | 5001053 |
| 62 | 42 and 61 | 2934 |
| 63 | 201012*.ed. or 2011*.ed,yr. or 2012*.ed,yr. | 2315721 |
| 64 | 62 and 63 | 481 |
3. EconLit, ProQuest
4. PAIS International, ProQuest
5. World Wide Political Science Abstracts, ProQuest
ALL("drug" or "drugs" or pharmaceutic* or "medicines" or medicament*) AND ALL(regulat* or requirement* or restrict* or monitor* or control* or "legislation" or "law" or "laws" or "act" or "acts" or "policy" or "policies" or "politics" or reform* or "system" or "systems" or "plan" or "plans" or "planning" or program* or strateg*) NEAR/3 ALL("price" or "prices" or "pricing" or purchas* or procure* or "sale" or "sales") AND ALL("randomised" or "randomized" or "randomly" or "trial" or "intervention" or "interventions" or "controlled" or "control group" or "control groups" or "before and after" or "pre and post" or "pretest" or "pre test" or "posttest" or "post test" or quasiexperiment* or "quasi experiment" or "quasi experiments" or "quasi experimental" or evaluat* or "effect" or "effects" or impact or "impacts" or "time series" or "time point" or "time points" or "repeated measure" or "repeated measures" or "repeated measurement" or "repeated measurements") NOT ALL("narcotic" or “narcotics” or "crime" or "crimes" or "war" or "wars" or terror* or weapon* or "drug abuse" or "illicit drug" or "illicit drugs" or "drug trafficking")
6. INRUD Bibliography
Search field: All Non‐Indexed Text Fields
{price} or {pricing} or {purchas} or {procure}
AND
{regulat} or {requirement} or {restrict} or {monitor} or {control} or {legislation} or {law} or {act} or {policy} or {policies} or {politics} or {reform} or {system} or {plan} or {program} or {strateg}
AND
{randomis} or {randomiz} or {randomly} or {intervention} or {control group} or {compar} or {before and after} or {pretest} or {posttest} or {pre test} or {post test} or {quasiexperiment} or {quasi experiment} or {evaluat} or {effect} or {impact} or {time series} or {time point} or {repeated measur}
7. Embase, Ovid
| 1. (regulat$ or requirement? or restrict$ or monitor$ or control$).tw. |
| 2. (legislation? or law? or act? or policy or policies or politics or reform$ or system? or plan$ or program$ or strateg$).tw. or Drug Legislation/ or Policy/ or Health Care Policy/ or Politics/ or Drug Program/ |
| 3. (drug or drugs or pharmaceutic$ or medicines or medicament? or medicat$).tw. or exp Pharmaceutics/ or exp Drug/ or Prescription/ or "Drug Use"/ or Drug Utilization/ |
| 4. *Cost Control/ and 3 and 2 |
| 5. ((control$ or containment or curtailment or reduc$ or save or saving) adj3 cost?).tw. |
| 6. ((cost? or expenditure? or expense?) adj3 (drug or drugs or pharmaceutic$ or medicines or medicament? or medicat$)).tw. |
| 7. 5 and 6 and 2 |
| 8. ((control$ or reduc$ or cut$ or regulat$ or negotiat$ or fix$) adj3 (price? or pricing)).tw. |
| 9. ((price? or pricing) adj3 (drug or drugs or pharmaceutic$ or medicines or medicament? or medicat$)).tw. |
| 10. 8 and 9 and 2 |
| 11. (reference$ adj3 (price? or pricing)).tw. |
| 12. (index$ adj3 (price? or pricing)).tw. and 3 |
| 13. ((maxim$ or minim$) adj3 (cost? or price? or pricing)).tw. and 3 |
| 14. (cost? effect$ adj3 (price? or pricing)).tw. and 3 |
| 15. (reimburs$ adj1 contract?).tw. and 3 |
| 16. (*Drug Cost/ or *Pharmacoeconomics/) and (1 or 2) |
| 17. *Hospital Purchasing/ and 3 |
| 18. (purchas$ adj3 (group? or join$ or hospital? or shared)).tw. |
| 19. ((group? or join$ or hospital? or shared) adj3 (drug or drugs or pharmaceutic$ or medicines or medicament? or medicat$)).tw. |
| 20. 18 and 19 and 2 |
| 21. (procurement$ adj3 (drug or drugs or pharmaceutic$ or medicines or medicament? or medicat$)).tw. and 2 |
| 22. (acquisition cost? adj3 (drug or drugs or pharmaceutic$ or medicines or medicament? or medicat$)).tw. and 2 |
| 23. (rebate? adj3 (drug or drugs or pharmaceutic$ or medicines or medicament? or medicat$)).tw. and 2 |
| 24. (generic adj3 (price? or pricing or substitut$)).tw. and 3 |
| 25. ((price? or pricing) adj3 (policy or policies or regulat$ or negotiat$)).tw. and 3 |
| 26. (rate? adj1 return).tw. and 3 |
| 27. (profit$ adj3 regulat$).tw. and 3 |
| 28. 4 or 7 or 10 or 11 or 12 or 13 or 14 or 15 or 16 or 17 or 20 or 21 or 22 or 23 or 24 or 25 or 26 or 27 |
| 29. Randomized Controlled Trial/ |
| 30. (randomised or randomized).tw. |
| 31. experiment$.tw. |
| 32. (time adj series).tw. |
| 33. (pre test or pretest or (posttest or post test)).tw. |
| 34. evaluat$.tw. |
| 35. Comparative Study/ |
| 36. or/29‐35 |
| 37. 28 and 36 |
| 38. Nonhuman/ |
| 39. 37 not 38 |
| 40. medlinex00ae.cr. |
| 41. 39 not 40 |
8. NHSEED, Cochrane Library
| #1 | (regulat* or requirement* or restrict* or monitor* or control*):ti,ab |
| #2 | (legislation* or law or laws or act or acts or policy or policies or politics or reform* or system or systems or plan or plans or program* or strateg*):ti,ab |
| #3 | MeSH descriptor Policy Making, this term only |
| #4 | MeSH descriptor Legislation, Drug, this term only |
| #5 | MeSH descriptor Public Policy, this term only |
| #6 | MeSH descriptor Health Policy, this term only |
| #7 | MeSH descriptor Politics, this term only |
| #8 | MeSH descriptor Health Care Reform, this term only |
| #9 | (#2 OR #3 OR #4 OR #5 OR #6 OR #7 OR #8) |
| #10 | (drug or drugs or pharmaceutic* or medicines or medicament* or medicat*):ti,ab |
| #11 | MeSH descriptor Pharmaceutical Preparations explode all trees |
| #12 | MeSH descriptor Drug Prescriptions explode all trees |
| #13 | MeSH descriptor Drug Utilization, this term only |
| #14 | (#10 OR #11 OR #12 OR #13) |
| #15 | MeSH descriptor Cost Control, this term only |
| #16 | MeSH descriptor Cost Savings, this term only |
| #17 | (#15 OR #16) |
| #18 | (#17 AND #9 AND #14) |
| #19 | (control* or containment or curtailment or reduc* or save or saving) NEAR/3 (cost or costs):ti,ab |
| #20 | (cost or costs or expenditure* or expense*) NEAR/3 (drug or drugs or pharmaceutic* or medicines or medicament* or medicat*):ti,ab |
| #21 | (#19 AND #20 AND #9) |
| #22 | (control* or reduc* or cut* or regulat* or negotiat* or fix*) NEAR/3 (price* or pricing):ti,ab |
| #23 | (price* or pricing) NEAR/3 (drug or drugs or pharmaceutic* or medicines or medicament* or medicat*):ti,ab |
| #24 | (#22 AND #23 AND #9) |
| #25 | reference* NEAR/3 (price* or pricing):ti,ab |
| #26 | index* NEAR/3 (price* or pricing):ti,ab |
| #27 | (#26 AND #14) |
| #28 | (maxim* or minim*) NEAR/3 (cost or costs or price* or pricing):ti,ab |
| #29 | (#28 AND #14) |
| #30 | (cost or costs) NEAR/4 (price* or pricing):ti,ab |
| #31 | (#30 AND #14) |
| #32 | (reimburs* NEAR/1 contract*):ti,ab |
| #33 | MeSH descriptor Drug Costs, this term only |
| #34 | MeSH descriptor Economics, Pharmaceutical, this term only |
| #35 | (#33 OR #34) |
| #36 | (#1 OR #9) |
| #37 | (#35 AND #36) |
| #38 | MeSH descriptor Purchasing, Hospital, this term only |
| #39 | MeSH descriptor Group Purchasing, this term only |
| #40 | (#38 OR #39) |
| #41 | (#40 AND #14) |
| #42 | purchas* NEAR/3 (group* or join* or hospital* or shared):ti,ab |
| #43 | (group* or join* or hospital* or shared) NEAR/3 (drug or drugs or pharmaceutic* or medicines or medicament* or medicat*):ti,ab |
| #44 | (#42 AND #43 AND #9) |
| #45 | procurement* NEAR/3 (drug or drugs or pharmaceutic* or medicines or medicament* or medicat*):ti,ab |
| #46 | (acquisition NEXT cost*) NEAR/3 (drug or drugs or pharmaceutic* or medicines or medicament* or medicat*):ti,ab |
| #47 | (#46 AND #9) |
| #48 | rebate* NEAR/3 (drug or drugs or pharmaceutic* or medicines or medicament* or medicat*):ti,ab |
| #49 | generic NEAR/3 (price* or pricing or substitut*):ti,ab |
| #50 | (#49 AND #14) |
| #51 | (price* or pricing) NEAR/3 (policy or policies or regulat* or negotiat*):ti,ab |
| #52 | (#51 AND #14) |
| #53 | (rate* NEAR/1 return):ti,ab |
| #54 | (#53 AND #14) |
| #55 | (profit* NEAR/3 regulat*):ti,ab |
| #56 | (#18 OR #21 OR #24 OR #25 OR #27 OR #29 OR #31 OR #32 OR #37 OR #41 OR #44 OR #45 OR #47 OR #48 OR #50 OR #52 OR #54 OR #55) |
9. LILACS, VHL (IAH search interface)
(cost or costs or expend$ or expens$ or price or prices or pricing or purchas$ or costo or costos or gasto$ or gasta$ or precio or precios or compra$ or adquisicion$ or custo or custos or preco or precos or aquisicao$ or despesa or adquisicao) and (drug or drugs or pharmaceutic$ or medicin$ or medicament$ or farmaceutic$ or droga or remedio) and (regulat$ or requirement$ or restrict$ or monitor$ or contro$ or legislat$ or law or laws or policy or policies or reform$ or system$ or program$ or regulacion or requisito$ or politica$ or sistema$ or seguimiento or regulacao$ or condicao$ or seguimento or acompanhamento or exigencia) and (randomi$ or randomly or azar or acaso or aleat$ or control$ or intervention$ or intervencion$ or intervencao or intervencoes or evaluat$ or evaluar or evaluacion or avaliar or impact$) [Words]
10. International Political Science Abstracts (IPSA)
| S5 | S1 and S2 and S3 and S4 | 55 |
| S4 | TX (random* or intervention* or control* or compar* or evaluat* or "time series" or pretest or posttest or "pre test" or "post test" or impact* or chang* or effect* or experiment*) | 117558 |
| S3 | TX (regulat* or requirement* or restrict* or monitor* or control* or legislation or law or laws or act or acts or policy or policies or politics or reform* or system or systems or plan* or program* or strateg*) | 189060 |
| S2 | TX (cost or costs or price* or pricing or expenditure* or expense* or procurement* or reimburs* or purchas* or rebate* or profit*) | 14426 |
| S1 | TX (drug or drugs or pharmaceutic* or medicines or medicament*) | 774 |
11. OpenSIGLE (now called OpenGrey)
Keywords: drug or drugs or pharmaceutical or pharmaceuticals or medicaments or medicines
AND
Keywords: price or prices or pricing or purchase or purchased or purchasing or procurement
12. WHOLIS, WHO
Search field: ‘Words or phrase’
drug or drugs or pharmaceutic$ or medicament$ or medicines
AND
cost or costs or price$ or pricing or expenditure$ or expense$ or procurement$ or reimburs$ or purchas$ or rebate$ or profit$
AND
regulat$ or requirement$ or restrict$ or monitor$ or control$ or legislation$ or law or laws or act or acts or policy or policies or politics or reform$ or system or systems or plan or plans or planning or program$ or strateg$
AND
random$ or intervention$ or control$ or compar$ or evaluat$ or impact$ or chang$ or effect$ or experiment$
13. World Bank (Documents & Reports)
Advanced Search ‐ All Documents
In Title (Any words): drug drugs pharmaceutical pharmaceuticals medicaments medicines
14. Jolis
Search fields: ‘Keywords Anywhere’
Search done in two separate stages
1.
keywords anywhere "pric$ or cost$ or purchas$ or procur$ or profit$" AND keywords anywhere "drug or drugs or pharmaceutic$ or medicament$ or medicines or prescrip$ or prescrib$"
2.
keywords anywhere "rate$" AND keywords anywhere "return" AND keywords anywhere "drug or drugs or pharmaceutic$ or medicament$ or medicines or prescrip$ or prescrib$"
15. Global Jolis
Search field: ‘Words or Phrase’
Search done in two separate stages
1.
words or phrase "pric$ or cost$ or purchas$ or procur$ or profit$" AND words or phrase "drug or drugs or pharmaceutic$ or medicament$ or medicines or prescrip$ or prescrib$"
2.
words or phrase "rate$” AND words or phrase “return” AND words or phrase "drug or drugs or pharmaceutic$ or medicament$ or medicines or prescrip$ or prescrib$".
16. OECD
Searched: Publications & Documents limited to OECD Publications only
drug or drugs or pharmaceutical or pharmaceuticals or medicaments or medicines or prescription or prescriptions or prescribe or prescribing
17. OECD iLibrary (formerly called SourceOECD)
Advanced search
Option 1: drug or drugs or pharmaceutical or pharmaceuticals or medicaments or medicines, in Title and Abstract
AND
Option2: price or prices or pricing or purchase or purchased or purchasing or procurement, in Title and Abstract
18. World Bank iLibrary
Search fields: ‘Title’ or ‘Abstract’ or ‘Keywords’
drug or drugs or pharmaceutical or pharmaceuticals or pharmaceutic or pharmaceutics or medicament or medicaments or medicines or prescription or prescriptions or prescribe or prescribed or prescribing
Characteristics of studies
Characteristics of included studies [ordered by study ID]
Aronsson 2001.
| Methods | ITS Some limitations | |
| Participants | Setting: Sweden, national, public insurance Physicians: No information provided Patients: No information provided Prescriptions: No information provided |
|
| Interventions | Reference pricing on 12 brand drugs | |
| Outcomes | Drug prices | |
| Notes | Research grant from Swedish Competition Agency | |
| Risk of bias | ||
| Bias | Authors' judgement | Support for judgement |
| The intervention is independent of other changes. (Protection against secular changes) Drug prices | Unclear risk | Comment: Probably not done. Quite long study period (1972‐1996), specifically there are big chances of having secular changes in that period |
| Data were analysed appropriately ? Drug prices | Low risk | Comment: Probably done. Time series regression used, model specification not quite correct (did not let slopes vary between pre and post) but analysis is correct |
| Reason for the number and spacing of data points given Drug prices | Low risk | Comment: Probably done, they have used the highest level (years) available |
| Shape of the intervention effect was pre‐specified ? Drug prices | Low risk | Comment: Probably done since they put a phase term in the model at the point of intervention |
| Intervention unlikely to affect data collection. (Protection against detection bias) Drug prices | Low risk | Comment: Probably done |
| Was knowledge of the allocated interventions adequately prevented during the study? Drug prices | Low risk | Comment: Probably done |
| Were incomplete outcome data adequately addressed? Drug price | Low risk | Comment: Probably done |
| Reliable primary outcome measure(s) Drug prices | Low risk | Comment: Probably done |
| Other risk of bias Drug prices | Low risk | |
| Baseline adjustment analysis done (properly)? Drug prices | Low risk | Comment: Probably done |
| Intention to treat analysis done (properly)? Drug prices | Low risk | Comment: Probably done |
Brekke 2003.
| Methods | ITS Some limitations | |
| Participants | Setting: Norway, national public drug insurance Physicians: No information provided Patients: No information provided Prescriptions: No information provided |
|
| Interventions | Index pricing on six groups of active substances | |
| Outcomes | Drug use Drug prices | |
| Notes | Commisioned by the Norwegian Pharmacist Association | |
| Risk of bias | ||
| Bias | Authors' judgement | Support for judgement |
| The intervention is independent of other changes. (Protection against secular changes) Drug prices | Low risk | Quote: Variables that affect prices (page 97) are adjusted for in the regression equation. In addition a control (the substances that were candidates for index pricing system but not included) Comment: Probably done |
| Data were analysed appropriately ? Drug prices | Low risk | Quote: Page 95 ‐ Autoregressive model with trend Comment: Probably done. It seems that they have done it, but they are not explicit about it |
| Reason for the number and spacing of data points given Drug prices | Unclear risk | Comment: Probably not done. Only 7 observations for post‐intervention period, but no more observations were available |
| Shape of the intervention effect was pre‐specified ? Drug prices | Unclear risk | Quote: Dummy variable for the index price system (OBS: page 92: index price system announced fall 2002, several months ahead of implementation Comment: Probably done |
| Intervention unlikely to affect data collection. (Protection against detection bias) Drug prices | Unclear risk | Quote: Source of data collection changed in the study period (from sales survey to NAF statistics) Comment: Probably not done. The reason for making use of two different data sources is that the authors wanted observations of prices both before the index price |
| Was knowledge of the allocated interventions adequately prevented during the study? Drug prices | Low risk | Comment: Probably done |
| Were incomplete outcome data adequately addressed? Drug price | Low risk | Comment: Probably done |
| Reliable primary outcome measure(s) Drug prices | Low risk | Comment: Probably done |
| Other risk of bias Drug prices | Unclear risk | Comment: Probably not done. Sample of 10 pharmacies, small – thus large confidence intervals, the point estimates may vary a lot. Do not know if sample is representative or not |
| Baseline adjustment analysis done (properly)? Drug prices | Low risk | Comment: Probably done |
| Intention to treat analysis done (properly)? Drug prices | Low risk | Comment: Probably done, not relevant |
Brekke 2011.
| Methods | ITS | |
| Participants | Setting: Norway, national public drug insurance Physicians: No information provided Patients: No information provided Prescriptions: No information provided |
|
| Interventions | The reference pricing system, called 'index pricing', was introduced in March 2003 for a subsample of off‐patent pharmaceuticals facing generic competition. Initially, the index price system covered six chemical substances: citalopram (depression), omeprazol (anti ulcer), cetirizin (allergy), loratadin (allergy), enalapril (high blood pressure) and lisinopril (high blood pressure). The system was later extended with two additional substances; simvastatin (high cholesterol) and amlodipine (high blood pressure) | |
| Outcomes | Drug prices Drug expenditures |
|
| Notes | ||
| Risk of bias | ||
| Bias | Authors' judgement | Support for judgement |
| The intervention is independent of other changes. (Protection against secular changes) Drug prices | Low risk | A control group did not show secular changes |
| The intervention is independent of other changes. (Protection against secular changes) Drug expenditures | Low risk | A control group did not show secular changes |
| Data were analysed appropriately ? Drug prices | Low risk | The analysis relies on a comparison of the molecules affected by reference pricing (treatment group) to similar molecules under price cap regulation (control group). They compared inter‐temporal variation in outcomes before and after the imposition of the reform. They estimated different versions of the following fixed effect regression model: Yit = X′it β + ai + δt + αDit + ϵit |
| Data were analysed appropriately ? Drug expenditures | Low risk | The analysis relies on a comparison of the molecules affected by reference pricing (treatment group) to similar molecules under price cap regulation (control group). They compared inter‐temporal variation in outcomes before and after the imposition of the reform. They estimated different versions of the following fixed effect regression model: Yit = X′it β + ai + δt + αDit + ϵit |
| Were baseline outcome measurements similar? Health care utilisation | Low risk | Not relevant for ITS |
| Were baseline characteristics similar? Health care utilisation | Low risk | Not relevant for ITS |
| Reason for the number and spacing of data points given Drug prices | Low risk | Registering system provide monthly data. Enough data points before and after the interventions were provided |
| Reason for the number and spacing of data points given Drug expenditures | Low risk | Registering system provide monthly data. Enough data points before and after the interventions were provided |
| Follow‐ up of professionals (protection against attrition/ exclusion bias) Health care utilisation | Low risk | Not relevant for ITS |
| Follow‐ up of patients (protection against attrition/ exclusion bias). Health Care Utilisation | Low risk | Not relevant for ITS |
| Shape of the intervention effect was pre‐specified ? Drug prices | Low risk | Explanations were provided |
| Shape of the intervention effect was pre‐specified ? Drug expenditures | Low risk | Explanations were provided |
| Intervention unlikely to affect data collection. (Protection against detection bias) Drug prices | Low risk | A control group used the same data collection methods |
| Intervention unlikely to affect data collection. (Protection against detection bias) Drug expenditures | Low risk | A control group used the same data collection methods |
| Was knowledge of the allocated interventions adequately prevented during the study? Drug prices | Low risk | Not relevant for ITS. Objective outcomes |
| Was knowledge of the allocated interventions adequately prevented during the study? Drug expenditures | Low risk | Not relevant for ITS. Objective outcomes |
| Were incomplete outcome data adequately addressed? Drug price | Low risk | Complete data set |
| Were incomplete outcome data adequately addressed? Drug expenditure | Low risk | Complete data set |
| Reliable primary outcome measure(s) Drug prices | Low risk | They used data from Farmastat, a database that includes information on sales value and volume for each package of drugs sold at the Norwegian pharmaceutical market. Values are in pharmacy purchase prices and volumes in defined daily doses (DDD) for the active substance according to the ATC‐code system. They have information on all off‐patent prescription drugs within the 40 largest ATC groups (in terms of sales volume). All drugs in our sample are on the government's reimbursement list |
| Reliable primary outcome measure(s) Drug expenditures | Low risk | They used data from Farmastat, a database that includes information on sales value and volume for each package of drugs sold at the Norwegian pharmaceutical market. Values are in pharmacy purchase prices and volumes in defined daily doses (DDD) for the active substance according to the ATC‐code system. They have information on all off‐patent prescription drugs within the 40 largest ATC groups (in terms of sales volume). All drugs in our sample are on the government's reimbursement list |
| Was the study adequately protected against contamination? Health Care Utilisation | Low risk | Not relevant for ITS |
| Other risk of bias Drug prices | Low risk | No evidence of other bias |
| Other risk of bias Drug expenditures | Low risk | No evidence of other bias |
| Baseline adjustment analysis done (properly)? Drug prices | Low risk | Not relevant for ITS |
| Baseline adjustment analysis done (properly)? Drug expenditures | Low risk | Not relevant for ITS |
| Intention to treat analysis done (properly)? Drug prices | Low risk | Not relevant for ITS |
| Intention to treat analysis done (properly)? Drug expenditures | Low risk | Not relevant for ITS |
Grootendorst 2002.
| Methods | ITS for drug expenditures
No serious limitations CBA for health outcome Limitations CRM for Healthcare utilisation Limitations |
|
| Participants | Setting: British Columbia, Canada, Ministry of Health's drug subsidy program Pharmacare Physicians: No information provided Patients: Senior citizens (65 yr and older) ITS: No information provided about number of patients CBA and CRM: Nitrates users: 11,155 patients in exposed group, 1760 in non‐exposed group ACE inhibitors users: 28,564 patients in exposed group, 7320 in non‐exposed group CCB users: 14,342 patients in exposed group, 20,086 in non‐exposed group Prescriptions: No information provided |
|
| Interventions | Reference pricing on nitrates, ACE inhibitors and CCBs | |
| Outcomes | Health
Healthcare utilisation
Drug expenditures Drug use |
|
| Notes | Finanial support from the Health Transition Fund, Health Canada; Seed Grant award from the Father Sean O'Sullivan Research Centre, St. Joseph's Hospital; the Canadian Health Services Research Foundation; Brogan Inc.; the BC Ministry of Health; and the Drug Information Association | |
| Risk of bias | ||
| Bias | Authors' judgement | Support for judgement |
| The intervention is independent of other changes. (Protection against secular changes) Drug prices | Low risk | |
| The intervention is independent of other changes. (Protection against secular changes) Drug expenditures | Low risk | Quote: Page 1012: Some CCBs (also anti‐anginal drugs) became subject to reference pricing on Jan 1 1997. Page 1015: “No apparent concomitant changes in either pharmacological management of angina or Pharmacare reimbursement policy for these drugs over our study period”. Page 1015: “The presence of time‐varying confounders could have affected our results.” Comment: Probably done |
| The intervention is independent of other changes. (Protection against secular changes) Drug use | Low risk | Quote: Page 1012: Some CCBs (also anti‐anginal drugs) became subject to reference pricing on Jan 1 1997. Page 1015: “No apparent concomitant changes in either pharmacological management of angina or Pharmacare reimbursement policy for these drugs over our study period”. Page 1015: “The presence of time‐varying confounders could have affected our results.” Comment: Probably done |
| Data were analysed appropriately ? Drug expenditures | Low risk | Quote: Log regression, enough time points but no trend calculations formally, Page 1013 Comment: Probably done |
| Data were analysed appropriately ? Drug use | Low risk | Quote: Log regression, enough time points but no trend calculations formally, Page 1013 Comment: Probably done |
| Were baseline outcome measurements similar? Health care utilisation | Unclear risk | Comment: Probably not done, reporting only combined figures as results |
| Were baseline characteristics similar? Health care utilisation | Low risk | Quote: Page 63 and appendix 2 Comment: Probably done |
| Reason for the number and spacing of data points given Drug expenditures | Low risk | Comment: Probably done |
| Reason for the number and spacing of data points given Drug use | Low risk | Comment: Probably done |
| Follow‐ up of professionals (protection against attrition/ exclusion bias) Health care utilisation | Low risk | Comment: Probably done |
| Shape of the intervention effect was pre‐specified ? Drug expenditures | Low risk | Comment: Probably done |
| Shape of the intervention effect was pre‐specified ? Drug use | Low risk | Comment: Probably done |
| Shape of the intervention effect was pre‐specified ? Health Care Utilisation | Low risk | Comment: Probably done |
| Intervention unlikely to affect data collection. (Protection against detection bias) Drug expenditures | Low risk | Comment: Probably done |
| Intervention unlikely to affect data collection. (Protection against detection bias) Drug use | Low risk | Comment: Probably done |
| Was knowledge of the allocated interventions adequately prevented during the study? Drug expenditures | Low risk | Comment: Probably done |
| Was knowledge of the allocated interventions adequately prevented during the study? Drug use | Low risk | Comment: Probably done |
| Was knowledge of the allocated interventions adequately prevented during the study? Health Care Utilisitation | Low risk | Comment: Probably done |
| Were incomplete outcome data adequately addressed? Drug expenditure | Low risk | |
| Were incomplete outcome data adequately addressed? Drug use | Low risk | |
| Reliable primary outcome measure(s) Drug expenditures | Low risk | Comment: Probably done |
| Reliable primary outcome measure(s) Drug use | Low risk | Comment: Probably done |
| Other risk of bias Drug expenditures | Low risk | Comment: Probably done, not relevant |
| Other risk of bias Drug use | Low risk | Comment: Probably done |
| Baseline adjustment analysis done (properly)? Drug expenditures | Low risk | Comment: Probably done, not relevant |
| Baseline adjustment analysis done (properly)? Drug use | Low risk | Comment: Probably done, not relevant |
| Baseline adjustment analysis done (properly)? Health care utilisation | Low risk | Comment: Probably done, not relevant |
| Intention to treat analysis done (properly)? Drug expenditures | Low risk | Comment: Probably done, not relevant |
| Intention to treat analysis done (properly)? Drug use | Low risk | Comment: Probably done, not relevant |
| Intention to treat analysis done (properly)? Health care utilisation | Low risk | Comment: Probably done, not relevant |
Grootendorst 2005.
| Methods | ITS No serious limitations |
|
| Participants | Setting: Ontario and British Columbia, Canada, Ministry of Health's drug subsidy program Pharmacare Physicians: No information provided Patients: Eligible senior beneficiary of the public drug plan operating in Ontario and senior citizens (65 yr and older) in British Columbia ITS: No information provided about number of patients Prescriptions: No information provided |
|
| Interventions | Two types of reference pricing to nonsteroidal antiinflammatory drugs (NSAIDs) over the period February 1993
to June 2001. Type 1: generic and brand versions of the same NSAID are considered interchangeable (in April 1994) Type 2: different NSAIDs are considered interchangeable (in November 1995) |
|
| Outcomes | Drug Expenditure, Drug use | |
| Notes | Results were reanalysed by reviewers | |
| Risk of bias | ||
| Bias | Authors' judgement | Support for judgement |
| The intervention is independent of other changes. (Protection against secular changes) Drug expenditures | Low risk | Quote: Events like patent expiration, changes in prescribing patterns, and other unknown parameters are included in the regression model using ordinary least squares Comment: Probably done, protection against secular changes |
| The intervention is independent of other changes. (Protection against secular changes) Drug use | Low risk | Quote: Events like patent expiration, changes in prescribing patterns, and other unknown parameters are included in the regression model using ordinary least squares Comment: Probably done, protection against secular changes |
| Data were analysed appropriately ? Drug expenditures | Low risk | Quote: Assuming that RP did not affect quantity and using the same regression approach, we estimated the impact of the policies on Pharmacare on patients reimbursement price. Comment: Probably done |
| Data were analysed appropriately ? Drug use | Low risk | Quote: Assuming that RP did not affect quantity and using the same regression approach, we estimated the impact of the policies on Pharmacare on patients reimbursement price. Comment: Probably done |
| Reason for the number and spacing of data points given Drug expenditures | Low risk | Comment: Probably done, data on dispensing volumes and cost for the number of eligible senior beneficiaries by province and month from April 1994 to November 1997 |
| Reason for the number and spacing of data points given Drug use | Low risk | Comment: Probably done, data on dispensing volumes and cost for the number of eligible senior beneficiaries by province and month from April 1994 to November 1997 |
| Shape of the intervention effect was pre‐specified ? Drug expenditures | Low risk | Comment: Probably done |
| Shape of the intervention effect was pre‐specified ? Drug use | Low risk | Comment: Probably done |
| Intervention unlikely to affect data collection. (Protection against detection bias) Drug expenditures | Low risk | Comment: Probably done, sources and methods of data collection were the same before and after the intervention |
| Intervention unlikely to affect data collection. (Protection against detection bias) Drug use | Low risk | Comment: Probably done, sources and methods of data collection were the same before and after the intervention |
| Was knowledge of the allocated interventions adequately prevented during the study? Drug expenditures | Low risk | Comment: Probably done, outcomes are objective |
| Was knowledge of the allocated interventions adequately prevented during the study? Drug use | Low risk | Comment: Probably done, outcomes are objective |
| Were incomplete outcome data adequately addressed? Drug expenditure | Low risk | Comment: Probably done, all relevant outcomes in the methods section are reported in the results section |
| Were incomplete outcome data adequately addressed? Drug use | Low risk | Comment: Probably done, all relevant outcomes in the methods section are reported in the results section |
| Reliable primary outcome measure(s) Drug expenditures | Low risk | Comment: Probably done |
| Reliable primary outcome measure(s) Drug use | Low risk | Comment: Probably done |
| Other risk of bias Drug expenditures | Low risk | Comment: Unlikely |
| Other risk of bias Drug use | Low risk | Comment: Unlikely |
| Baseline adjustment analysis done (properly)? Drug expenditures | Low risk | Quote: the authors extrapolated average reimbursement per day of NSAID therapy over the months before RP to estimate what expenditures would have been without the policies. These counterfactual predictions were compared with actual values to estimate the impact of the policies; the estimated impacts on reimbursement rates were multiplied by the postpolicy volume of NSAIDS dispensed, which appeared unaffected by the policies, to estimate expenditure changes. Comment: Probably done |
| Baseline adjustment analysis done (properly)? Drug use | Low risk | Quote: the authors extrapolated average reimbursement per day of NSAID therapy over the months before RP to estimate what expenditures would have been without the policies. These counterfactual predictions were compared with actual values to estimate the impact of the policies; the estimated impacts on reimbursement rates were multiplied by the postpolicy volume of NSAIDS dispensed, which appeared unaffected by the policies, to estimate expenditure changes. Comment: Probably done |
| Intention to treat analysis done (properly)? Drug expenditures | Low risk | Comment: Probably done, not relevant |
| Intention to treat analysis done (properly)? Drug use | Low risk | Comment: Probably done, not relevant |
Grootendorst 2006.
| Methods | ITS No serious limitations |
|
| Participants | Setting: Ontario and British Columbia, Canada, Ministry of Health's drug subsidy program Pharmacare Physicians: No information provided Patients: Eligible senior beneficiary of the public drug plan operating in Ontario and senior citizens (65 yr and older) in British Columbia ITS: No information provided about number of patients Prescriptions: No information provided |
|
| Interventions | Reference pricing for reimbursement on ACE inhibitors and CCBs | |
| Outcomes | Drug expenditure, drug use | |
| Notes | Results were reanalysed by reviewers | |
| Risk of bias | ||
| Bias | Authors' judgement | Support for judgement |
| The intervention is independent of other changes. (Protection against secular changes) Drug expenditures | High risk | Introduction of low‐cost generic hypertensive drugs |
| The intervention is independent of other changes. (Protection against secular changes) Drug use | High risk | Introduction of low‐cost generic hypertensive drugs |
| Data were analysed appropriately ? Drug expenditures | Low risk | Data scanned and reanalysis done by reviewers |
| Data were analysed appropriately ? Drug use | Low risk | Data scanned and reanalysis done by reviewers |
| Reason for the number and spacing of data points given Drug expenditures | Low risk | Monthly data are normal and plausible |
| Reason for the number and spacing of data points given Drug use | Low risk | Monthly data are normal and plausible |
| Shape of the intervention effect was pre‐specified ? Drug expenditures | Low risk | Pre‐specified in the reanalysis |
| Shape of the intervention effect was pre‐specified ? Drug use | Low risk | Pre‐specified in the reanalysis |
| Intervention unlikely to affect data collection. (Protection against detection bias) Drug expenditures | Low risk | Reference pricing not likely to affect drug expenditure registries |
| Intervention unlikely to affect data collection. (Protection against detection bias) Drug use | Low risk | Reference pricing not likely to affect drug expenditure registries |
| Was knowledge of the allocated interventions adequately prevented during the study? Drug expenditures | Low risk | Not discussed in the paper if pre‐knowledge of intervention affected behaviour of patients, physicians and pharma companies before intervention |
| Was knowledge of the allocated interventions adequately prevented during the study? Drug use | Low risk | Not discussed in the paper if pre‐knowledge of intervention affected behaviour of patients, physicians and pharma companies before intervention |
| Were incomplete outcome data adequately addressed? Drug expenditure | Low risk | Register data |
| Were incomplete outcome data adequately addressed? Drug use | Low risk | Register data |
| Reliable primary outcome measure(s) Drug expenditures | Low risk | Register data |
| Reliable primary outcome measure(s) Drug use | Low risk | Register data |
| Other risk of bias Drug expenditures | Unclear risk | Not discussed in the paper |
| Other risk of bias Drug use | Unclear risk | Not discussed in the paper |
| Baseline adjustment analysis done (properly)? Drug expenditures | Low risk | Data scanned and reanalysis done by reviewers |
| Baseline adjustment analysis done (properly)? Drug use | Low risk | Data scanned and reanalysis done by reviewers |
| Intention to treat analysis done (properly)? Drug expenditures | Low risk | Not relevant |
| Intention to treat analysis done (properly)? Drug use | Low risk | Not relevant |
Hazlet 2002.
| Methods | RM for drug use
Serious limitations CRM for health and healthcare utilisation Control part of the CRM No serious limitations |
|
| Participants | Setting: British Columbia, Canada, Ministry of Health's drug subsidy program Pharmacare Physicians: No information provided Patients: Senior citizens (65 yr and older), random sample of 10,000 in intervention and 10,000 in control group Prescriptions: No information provided |
|
| Interventions | Reference pricing on H2RAs | |
| Outcomes | Drug use Health Healthcare utilisation | |
| Notes | Supported by the Research Royalty Fund, University of Washington and by Pharmacare, Ministry of Health (British Columbia) | |
| Risk of bias | ||
| Bias | Authors' judgement | Support for judgement |
| The intervention is independent of other changes. (Protection against secular changes) Drug use | High risk | Comment: Probably not done, simultaneous prior authorisation policy with the reference pricing on H2RAs |
| Data were analysed appropriately ? Drug use | Low risk | Comment: Probably not done, Poisson regression model |
| Were baseline outcome measurements similar? Health care utilisation | Low risk | Quote: Table 1. lower part Comment: Probably done |
| Were baseline characteristics similar? Health care utilisation | Low risk | Quote: Table 1. upper part Comment: Probably done |
| Reason for the number and spacing of data points given Drug use | Low risk | Comment: Probably done |
| Follow‐ up of professionals (protection against attrition/ exclusion bias) Health care utilisation | Low risk | Comment: Probably done |
| Shape of the intervention effect was pre‐specified ? Drug use | High risk | Comment: Probably not done, transition period of one month in data analysis not explained |
| Intervention unlikely to affect data collection. (Protection against detection bias) Drug use | Low risk | Comment: Probably done |
| Was knowledge of the allocated interventions adequately prevented during the study? Drug use | Low risk | Comment: Probably done |
| Were incomplete outcome data adequately addressed? Drug use | Low risk | Comment: Probably done |
| Reliable primary outcome measure(s) Drug use | Low risk | Comment: Probably done |
| Other risk of bias Drug use | Low risk | Comment: Probably done |
| Baseline adjustment analysis done (properly)? Drug use | Unclear risk | Comment: Probably not done |
| Baseline adjustment analysis done (properly)? Health care utilisation | Unclear risk | Comment: Probably not done |
| Intention to treat analysis done (properly)? Drug use | Low risk | Comment: Probably done, not relevant |
Kibicho 2012.
| Methods | ITS Some limitations |
|
| Participants | Setting: Michigan State specific Medicaid Program (US) Physicians: No information provided Patients: Beneficiaries older than age sixty‐five made up 20% of the Michigan Medicaid dual‐eligible population Prescriptions: Claims data for non‐institutionalised dual eligibles age 65 yr and older covering fiscal years 2000–04 were drawn from Michigan’s Medicaid out‐patient prescription drug fee‐for‐service program database |
|
| Interventions | The maximum allowable cost is a ceiling price set for generic and multisource brands that are chemically equivalent and have the same active ingredients (generic substitutes). Maximum allowable cost is similar to reference pricing used in Canada, which extends the concept of drug interchangeability to include chemically related active ingredients that are pharmacologically equivalent (therapeutic substitutes) | |
| Outcomes | Drug prices Drug expenditures |
|
| Notes | ||
| Risk of bias | ||
| Bias | Authors' judgement | Support for judgement |
| The intervention is independent of other changes. (Protection against secular changes) Drug prices | Low risk | Long period series. Prescription drug use and spending data were aggregated on a monthly basis using the National Drug Code as the identifying variable (2000 to 2004) To avoid this possible high risk we are going to select only one pricing policy, Period 2: joint purchasing arrangement (JPA) |
| The intervention is independent of other changes. (Protection against secular changes) Drug expenditures | Low risk | Long period series. Fifty‐seven months and covered five policy periods (one 26‐month period before the policies were implemented and four policy periods of various durations (2000 to 2004) To avoid this possible high risk we are going to select only one pricing policy, Period 2: joint purchasing arrangement (JPA) |
| The intervention is independent of other changes. (Protection against secular changes) Health Care Utilisation | Unclear risk | |
| Data were analysed appropriately ? Drug prices | Low risk | We used interrupted time series analysis to investigate the mix effect, the price effect, and the combined price and mix effect of the four cost containment policies on cardiovascular drugs used by Michigan’s dually eligible beneficiaries |
| Data were analysed appropriately ? Drug expenditures | Low risk | We used interrupted time series analysis to investigate the mix effect, the price effect, and the combined price and mix effect of the four cost containment policies on cardiovascular drugs used by Michigan’s dually eligible beneficiaries |
| Data were analysed appropriately ? Health Care Utilisation | Unclear risk | |
| Were baseline outcome measurements similar? Health care utilisation | Unclear risk | |
| Were baseline characteristics similar? Health care utilisation | Unclear risk | |
| Reason for the number and spacing of data points given Drug prices | Low risk | Prescription drug use and spending data were aggregated on a monthly basis using the National Drug Code as the identifying variable Joint purchasing arrangement: Pre‐period: Jan 2000 ‐ Feb 2003 Post‐period: Feb. 2003 ‐ May 2004 |
| Reason for the number and spacing of data points given Drug expenditures | Low risk | Prescription drug use and spending data were aggregated on a monthly basis using the National Drug Code as the identifying variable Joint purchasing arrangement: Pre‐period: Jan 2000 ‐ Feb 2003 Post‐period: Feb. 2003 ‐ May 2004 |
| Reason for the number and spacing of data points given Health Care Utilisation | Unclear risk | |
| Follow‐ up of professionals (protection against attrition/ exclusion bias) Health care utilisation | Unclear risk | |
| Follow‐ up of patients (protection against attrition/ exclusion bias). Health Care Utilisation | Unclear risk | |
| Shape of the intervention effect was pre‐specified ? Drug prices | Unclear risk | |
| Shape of the intervention effect was pre‐specified ? Drug expenditures | Low risk | Rational explanation for the shape of intervention effect was given by the author |
| Shape of the intervention effect was pre‐specified ? Drug use | Low risk | Rational explanation for the shape of intervention effect was given by the author |
| Shape of the intervention effect was pre‐specified ? Health Care Utilisation | Unclear risk | |
| Intervention unlikely to affect data collection. (Protection against detection bias) Drug prices | Low risk | Sources and methods of data collection were the same before and after the intervention |
| Intervention unlikely to affect data collection. (Protection against detection bias) Drug expenditures | Low risk | Sources and methods of data collection were the same before and after the intervention |
| Intervention unlikely to affect data collection. (Protection against detection bias) Health Care Utilisation | Unclear risk | |
| Was knowledge of the allocated interventions adequately prevented during the study? Drug prices | Unclear risk | Not relevant |
| Was knowledge of the allocated interventions adequately prevented during the study? Drug expenditures | Unclear risk | Not relevant |
| Was knowledge of the allocated interventions adequately prevented during the study? Health Care Utilisitation | Unclear risk | |
| Were incomplete outcome data adequately addressed? Drug price | High risk | It isn't clear which are the utilisation and expenditure outcomes, the article doesn't present it, authors did not show neither the data nor the time series constructed from these two measures Monthly utilisation of and expenditures on drugs were determined, but it isn't clear if they are well addressed. Authors calculated cost savings for each policy by multiplying the change in price by total days supply. Authors measured utilisation using the number of days covered by each prescription—or days’ supply—to control for prescription size Even though drug expenditure and use aggregate data could be a limitation, it isn't an exclusion reason for this study |
| Were incomplete outcome data adequately addressed? Drug expenditure | High risk | It isn't clear which are the utilisation and expenditure outcomes, the article doesn't present it, authors did not show neither the data nor the time series constructed from these two measures Monthly utilisation of and expenditures on drugs were determined, but it isn't clear if they are well addressed. Authors calculated cost savings for each policy by multiplying the change in price by total days supply. Authors measured utilisation using the number of days covered by each prescription—or days’ supply—to control for prescription size Even though drug expenditure and use aggregate data could be a limitation, it isn't a exclusion reason for this study |
| Were incomplete outcome data adequately addressed? Health Care Utilization | Unclear risk | |
| Reliable primary outcome measure(s) Drug prices | Unclear risk | |
| Reliable primary outcome measure(s) Drug expenditures | Unclear risk | Claims data for non‐institutionalised dual eligibles age 65 yr and older covering fiscal years 2000–04 were drawn from Michigan’s Medicaid outpatient prescription drug fee‐for‐service program database. Reliability is not reported for outcome measures that are obtained by chart extraction or collected by an individual |
| Reliable primary outcome measure(s) Drug use | Unclear risk | Claims data for non‐institutionalised dual age 65 yr and older covering fiscal years 2000–04 were drawn from Michigan’s Medicaid outpatient prescription drug fee‐for‐service program database. Reliability is not reported for outcome measures that are obtained by chart extraction or collected by an individual |
| Reliable primary outcome measure(s) Health care utilisation | Unclear risk | |
| Was the study adequately protected against contamination? Health Care Utilisation | Unclear risk | |
| Other risk of bias Drug prices | Unclear risk | First, expenditures were not adjusted for the supplemental manufacturer rebates received by Michigan, because that is proprietary information, the estimated cost savings generated by Michigan’s policies may be understated, given that three of the four policies (preferred lists and both purchasing arrangements) have supplemental manufacturer rebates Second, study findings might not be generalizable to other Medicaid programs with different beneficiary demographics and prescription drug use Third, study did not include a control group. A limitation of the interrupted time series design is that we could not control for individual‐level factors such as generic drug entry and brand‐name drug patent expiration Finally, it is unclear what role, if any, the sequencing of policy implementation or the mix of policies played in generating the calculated cost savings. In other words, we might not have arrived at the same conclusion if both the preferred lists and the joint pool had not preceded maximum pricing. Taking this into account, we only will include the impact measure for joint purchasing arrangement policy |
| Other risk of bias Drug expenditures | Unclear risk | First, expenditures were not adjusted for the supplemental manufacturer rebates received by Michigan, because that is proprietary information, the estimated cost savings generated by Michigan’s policies may be understated, given that three of the four policies (preferred lists and both purchasing arrangements) have supplemental manufacturer rebates. However, this approach is consistent with other studies that have evaluated state Medicaid spending.11 Second, study findings might not be generalizable to other Medicaid programs with different beneficiary demographics and prescription drug use. Third, study did not include a control group. A limitation of the interrupted time‐series design is that we could not control for individual‐level factors such as generic drug entry and brand‐name drug patent expiration Finally, it is unclear what role, if any, the sequencing of policy implementation or the mix of policies played in generating the calculated cost savings. In other words, we might not have arrived at the same conclusion if both the preferred lists and the joint pool had not preceded maximum pricing. Taking this into account, we only will include the impact measure for joint purchasing arrangement policy |
| Other risk of bias Drug use | Unclear risk | |
| Other risk of bias Health care utilisation | Unclear risk | |
| Baseline adjustment analysis done (properly)? Drug prices | Low risk | Done, included in the ITS model |
| Baseline adjustment analysis done (properly)? Drug expenditures | Low risk | Done, included in the ITS model |
| Baseline adjustment analysis done (properly)? Health care utilisation | Unclear risk | |
| Intention to treat analysis done (properly)? Drug prices | Unclear risk | Not relevant |
| Intention to treat analysis done (properly)? Drug expenditures | Unclear risk | Not relevant |
| Intention to treat analysis done (properly)? Health care utilisation | Unclear risk | |
Marshall 2002.
| Methods | ITS No serious limitations | |
| Participants | Setting: British Columbia, Canada, Ministry of Health's drug subsidy program Pharmacare Physicians: No information provided Patients: Senior citizens (65 yr and older) Prescriptions: No information provided |
|
| Interventions | Reference pricing on H2RAs | |
| Outcomes | Drug expenditure | |
| Notes | Financial support from the Health Transitions Fund of Health Canada | |
| Risk of bias | ||
| Bias | Authors' judgement | Support for judgement |
| The intervention is independent of other changes. (Protection against secular changes) Drug expenditures | High risk | Quote: Special authority policy introduced on PPIs simultaneously with the reference pricing on H2RAs. This would likely underestimate the drug cost savings, not overestimate them Comment: Probably not done |
| Data were analysed appropriately ? Drug expenditures | Low risk | Comment: Probably done |
| Reason for the number and spacing of data points given Drug expenditures | Low risk | Comment: Probably done |
| Shape of the intervention effect was pre‐specified ? Drug expenditures | Low risk | Comment: Probably done |
| Intervention unlikely to affect data collection. (Protection against detection bias) Drug expenditures | Low risk | Comment: Probably done |
| Was knowledge of the allocated interventions adequately prevented during the study? Drug expenditures | Low risk | Comment: Probably done |
| Were incomplete outcome data adequately addressed? Drug expenditure | Low risk | Comment: Probably done |
| Reliable primary outcome measure(s) Drug expenditures | Low risk | Comment: Probably done |
| Other risk of bias Drug expenditures | Low risk | Comment: Probably done |
| Baseline adjustment analysis done (properly)? Drug expenditures | Low risk | Comment: Probably done |
| Intention to treat analysis done (properly)? Drug expenditures | Low risk | Comment: Probably done, not relevant |
McManus 2001.
| Methods | ITS Limitations | |
| Participants | Setting: Australia, Pharmaceutical Benefits Scheme
Physicians: No information provided Patients: No information provided Prescriptions: No information provided |
|
| Interventions | Reference pricing (minimum pricing policy) on ranitidine | |
| Outcomes | Drug use | |
| Notes | Financial support not stated. The author was employed at the government Department of Health and Aged Care in Australia | |
| Risk of bias | ||
| Bias | Authors' judgement | Support for judgement |
| The intervention is independent of other changes. (Protection against secular changes) Drug use | Low risk | Comment: Probably done. Compelling arguments are not mentioned and there might have been confounding historic events like new competitors on the market, new prices or marketing for competitor drugs |
| Data were analysed appropriately ? Drug use | Low risk | Comment: Probably done after reanalysis, few post‐period observations |
| Reason for the number and spacing of data points given Drug use | High risk | Comment: Probably not done, few data points |
| Shape of the intervention effect was pre‐specified ? Drug use | Low risk | Comment: Probably done after reanalysis |
| Intervention unlikely to affect data collection. (Protection against detection bias) Drug use | Low risk | Comment: Probably done |
| Was knowledge of the allocated interventions adequately prevented during the study? Drug use | Low risk | Comment: Probably done |
| Were incomplete outcome data adequately addressed? Drug use | Low risk | Comment: Probably done, this does only apply to the study cohort which was studied (prescription dispensed in the first week of April) |
| Reliable primary outcome measure(s) Drug use | Low risk | Comment: Probably done |
| Other risk of bias Drug use | Low risk | Comment: Probably done |
Moreno‐Torres 2011.
| Methods | ITS | |
| Participants | Setting: Spain, national health system Physicians: No information provided Patients: No information provided Prescriptions: No information provided |
|
| Interventions | A system of 'generic' reference pricing was introduced in December 2000 and remained in operation, with adjustments but without major changes, until December 2003. This system was applied to products with the same active ingredient, pharmaceutical form, dosage and number of units for which there was at least one generic | |
| Outcomes | Drug prices Drug expenditures Drug use |
|
| Notes | ||
| Risk of bias | ||
| Bias | Authors' judgement | Support for judgement |
| The intervention is independent of other changes. (Protection against secular changes) Drug prices | Unclear risk | Long series (1995 to 2006) |
| The intervention is independent of other changes. (Protection against secular changes) Drug expenditures | Unclear risk | Long series (1995 to 2006) |
| The intervention is independent of other changes. (Protection against secular changes) Drug use | Unclear risk | Long series (1995 to 2006) |
| Data were analysed appropriately ? Drug prices | Low risk | They applied ARIMA |
| Data were analysed appropriately ? Drug expenditures | Low risk | They applied ARIMA |
| Data were analysed appropriately ? Drug use | Low risk | They applied ARIMA |
| Were baseline outcome measurements similar? Health care utilisation | Low risk | Not relevant for ITS |
| Were baseline characteristics similar? Health care utilisation | Low risk | Not relevant for ITS |
| Reason for the number and spacing of data points given Drug prices | Low risk | Registering system provide monthly data. Enough data points before and after the interventions were provided |
| Reason for the number and spacing of data points given Drug expenditures | Low risk | Registering system provide monthly data. Enough data points before and after the interventions were provided |
| Reason for the number and spacing of data points given Drug use | Low risk | Registering system provide monthly data. Enough data points before and after the interventions were provided |
| Follow‐ up of professionals (protection against attrition/ exclusion bias) Health care utilisation | Low risk | Not relevant for ITS |
| Follow‐ up of patients (protection against attrition/ exclusion bias). Health Care Utilisation | Low risk | Not relevant for ITS |
| Shape of the intervention effect was pre‐specified ? Drug prices | Low risk | Explanations were provided |
| Shape of the intervention effect was pre‐specified ? Drug expenditures | Low risk | Explanations were provided |
| Shape of the intervention effect was pre‐specified ? Drug use | Low risk | Explanations were provided |
| Intervention unlikely to affect data collection. (Protection against detection bias) Drug prices | Low risk | The intervention did not affect data collection |
| Intervention unlikely to affect data collection. (Protection against detection bias) Drug expenditures | Low risk | The intervention did not affect data collection |
| Intervention unlikely to affect data collection. (Protection against detection bias) Drug use | Low risk | The intervention did not affect data collection |
| Was knowledge of the allocated interventions adequately prevented during the study? Drug prices | Low risk | Not relevant for ITS |
| Was knowledge of the allocated interventions adequately prevented during the study? Drug expenditures | Low risk | Not relevant for ITS |
| Was knowledge of the allocated interventions adequately prevented during the study? Drug use | Low risk | Not relevant for ITS |
| Were incomplete outcome data adequately addressed? Drug price | Low risk | Complete data set |
| Were incomplete outcome data adequately addressed? Drug expenditure | Low risk | Complete data set |
| Were incomplete outcome data adequately addressed? Drug use | Low risk | Complete data set |
| Reliable primary outcome measure(s) Drug prices | Low risk | Data were provided by the Catalan Health Service |
| Reliable primary outcome measure(s) Drug expenditures | Low risk | Data were provided by the Catalan Health Service |
| Reliable primary outcome measure(s) Drug use | Low risk | Data were provided by the Catalan Health Service |
| Was the study adequately protected against contamination? Health Care Utilisation | Low risk | Not relevant for ITS |
| Other risk of bias Drug prices | Low risk | No evidence of other bias |
| Other risk of bias Drug expenditures | Low risk | No evidence of other bias |
| Other risk of bias Drug use | Low risk | No evidence of other bias |
| Baseline adjustment analysis done (properly)? Drug prices | Low risk | Not relevant for ITS |
| Baseline adjustment analysis done (properly)? Drug expenditures | Low risk | Not relevant for ITS |
| Baseline adjustment analysis done (properly)? Drug use | Low risk | Not relevant for ITS |
| Intention to treat analysis done (properly)? Drug prices | Low risk | Not relevant for ITS |
| Intention to treat analysis done (properly)? Drug expenditures | Low risk | Not relevant for ITS |
| Intention to treat analysis done (properly)? Drug use | Low risk | Not relevant for ITS |
Narine 2001.
| Methods | ITS Serious limitations for outcome 'reference drug use' Limitations for outcome 'cost share drug use' | |
| Participants | Setting: British Columbia, Canada. Ministry of Health's drug subsidy program Pharmacare Physicians: No information provided Patients: No information provided Prescriptions: No information provided |
|
| Interventions | Reference pricing on H2RAs | |
| Outcomes | Drug use | |
| Notes | Supported in part by an unrestricted research grant from Canada's Research‐Based Pharmaceutical Companies | |
| Risk of bias | ||
| Bias | Authors' judgement | Support for judgement |
| The intervention is independent of other changes. (Protection against secular changes) Drug prices | Unclear risk | . |
| The intervention is independent of other changes. (Protection against secular changes) Drug use | High risk | Comment: Not written in this study, but from Hazlet and Marshall we know that Prior authorisation for PPIs were introduced simultaneously. The strict PPI policy most likely increase the use of H2RAs, both in total and with respect to the different H2RAs. Thus, where results show an increase in use, we do not know if the 'real result' is a decrease. Where the results show a decrease, the real result would be a (bigger) decrease |
| Data were analysed appropriately ? Drug use | Low risk | Comment: Probably done by reanalysis |
| Reason for the number and spacing of data points given Drug use | Low risk | Comment: Probably done by reanalysis |
| Shape of the intervention effect was pre‐specified ? Drug use | Low risk | Comment: Probably done by reanalysis |
| Intervention unlikely to affect data collection. (Protection against detection bias) Drug use | Low risk | Comment: Probably done |
| Was knowledge of the allocated interventions adequately prevented during the study? Drug use | Low risk | Comment: Probably done |
| Were incomplete outcome data adequately addressed? Drug use | High risk | Comment: Probably not done. There were changes in data set sample during study period, changes in the IMS data set´s sample population was done in June 1996, therefore trends after this time may not be directly comparable to those prior to June 1996 |
| Reliable primary outcome measure(s) Drug use | High risk | Comment: Probably not done. IMS data include pharmacist fees and/or distribution costs, thus cost increases may stem from either changes in pharmacist and/or distribution costs or changes in ingredient cost |
| Other risk of bias Drug use | Low risk | Comment: Probably done |
| Baseline adjustment analysis done (properly)? Drug use | Low risk | Comment: Probably done, not relevant |
| Intention to treat analysis done (properly)? Drug use | Low risk | Comment: Probably done, not relevant |
Pavcnik 2002.
| Methods | ITS No serious limitations | |
| Participants | Setting: Germany, statutory health insurance Physicians: No information provided Patients: No information provided Prescriptions: Retail pharmacy sales from IMS Health database |
|
| Interventions | Reference pricing on oral antidiabetics and antiulcerants | |
| Outcomes | Drug prices | |
| Notes | Support from MacArthur Foundation Grant and the Centre for International Studies at Princeton University, USA | |
| Risk of bias | ||
| Bias | Authors' judgement | Support for judgement |
| The intervention is independent of other changes. (Protection against secular changes) Drug prices | Low risk | Quote: The estimates that rely on the variation of prices before and after the reimbursement change to identify the impact of patient out‐of‐pocket expenses on pricing might be biased by intertemporal variation unrelated to changes in RP such as changes in technology, regulation, or demand. Thus, when data permit (as is the case for oral antidiabetics), I rely on differences in the intertemporal changes across products that vary in their exposure to reference prices. Comment: Probably done |
| Data were analysed appropriately ? Drug prices | Low risk | Comment: Probably done, time series regression models |
| Reason for the number and spacing of data points given Drug use | Low risk | Comment: Probably done for the abstracted variables |
| Shape of the intervention effect was pre‐specified ? Drug prices | Low risk | Comment: Probably done |
| Intervention unlikely to affect data collection. (Protection against detection bias) Drug prices | Low risk | Comment: Probably done |
| Was knowledge of the allocated interventions adequately prevented during the study? Drug prices | Low risk | Comment: Probably done |
| Were incomplete outcome data adequately addressed? Drug price | Low risk | Comment: Probably done |
| Reliable primary outcome measure(s) Drug prices | Low risk | Comment: Probably done |
| Other risk of bias Drug prices | Low risk | Comment: Probably done |
| Baseline adjustment analysis done (properly)? Drug prices | Low risk | Comment: Probably done, not relevant |
| Intention to treat analysis done (properly)? Drug prices | Low risk | Comment: Probably done, not relevant |
Puig 2007.
| Methods | ITS Some limitations | |
| Participants | Setting: Andalucía, Spain Physicians: No information provided Patients: No information provided Prescriptions: No information provided |
|
| Interventions | Reference pricing and maximum consumer prices as a reimbursement policies for statins | |
| Outcomes | Volume of sales | |
| Notes | Drug use data: Number of prescriptions dispensed per person for each of the six active ingredients in the therapeutic group of statins. Volume are measured as monthly sales and quantity ratios between the per capita value in each period and the per capita value of the initial period Average cost per defined daily dose (DDD) for originator brand‐name and lowest‐priced generic statins dispensed in Spain |
|
| Risk of bias | ||
| Bias | Authors' judgement | Support for judgement |
| The intervention is independent of other changes. (Protection against secular changes) Drug expenditures | High risk | Quote: The coefficient estimates in Eq. (1) might be biased by intertemporal variation unrelated to insurer interventions, such as changes in technology or demand. Technology assumption Inherent in all policy evaluations applied to a class of drugs is that results cannot be easily generalized to all drug categories or to other health systems or pharmaceutical markets Some potential confounding factors such as marketing expenditure have not been considered because of lack of reliable data Comment: Probably not done |
| Data were analysed appropriately ? Drug expenditures | Low risk | Comment: Probably done, time series regression model |
| Reason for the number and spacing of data points given Drug expenditures | Low risk | Comment: Probably done, series of 46 monthly drug use and sales figures from January 2001 to October 2004 for each active ingredient |
| Shape of the intervention effect was pre‐specified ? Drug expenditures | Low risk | Quote: A notable change in this generic RP system was introduced in January 2004, models take into account baseline trends. Comment: Probably done |
| Intervention unlikely to affect data collection. (Protection against detection bias) Drug expenditures | Low risk | Comment: Probably done. IMS Spain |
| Was knowledge of the allocated interventions adequately prevented during the study? Drug expenditures | Low risk | Quote: The data are in the form of a monthly time series from January 2001 to October 2004 (46 monthly periods) of quantity and volume of sales valued at regulated ex‐factory prices (not including potential producer discounts to wholesale distribution firms or to pharmacies) at the level of each active ingredient for the six statins available in the Spanish market during that period, separated into Andalusia and the rest of Spain. An observation is equal to an active ingredient‐month Comment: Probably done |
| Were incomplete outcome data adequately addressed? Drug expenditure | Low risk | Comment: Probably done |
| Reliable primary outcome measure(s) Drug expenditures | High risk | Quote: Public expenditure data on dispensed statins are proxied in this paper by overall volume of sales, including publicly financed but also out‐of‐pocket sales in order to evaluate public financing reforms, public procurement data should be used Comment: Probably not done |
| Other risk of bias Drug expenditures | High risk | Quote: Public expenditure data on dispensed statins are proxied in this paper by overall volume of sales, including publicly financed but also out‐of‐pocket sales in order to evaluate public financing reforms, public procurement data should be used. However, in the Spanish market, most dispensed prescription drugs are publicly financed, out‐of‐pocket prescription sales representing a very small market share. Furthermore, the public financing reforms established the reimbursement limits at the level of the consumer price, therefore volume of sales valued at consumer prices would be more appropriate for evaluating the impact of these reforms. Notwithstanding, in this case price regulation establishes consumer prices by adding proportional distribution margins to the regulated ex‐factory price, so this ex‐factory price presents a perfect correlation with consumer prices. The impact of the interventions under evaluation on other health services and on health status is not considered in this paper Comment: Probably not done |
| Baseline adjustment analysis done (properly)? Drug expenditures | Low risk | Comment: Probably done |
| Intention to treat analysis done (properly)? Drug expenditures | Low risk | Comment: Probably done, not relevant |
Sawyer 1983.
| Methods | ITS Limitations | |
| Participants | Setting: USA, Maryland State, Medicaid Physicians: No information provided Patients: No information provided Prescriptions: No information provided |
|
| Interventions | Reference pricing (maximum allowable costs (MAC)) on 52 dosage forms of 25 multisource chemical entities | |
| Outcomes | Drug expenditures | |
| Notes | No sponsor. The study was carried out in the private capacity of the author | |
| Risk of bias | ||
| Bias | Authors' judgement | Support for judgement |
| The intervention is independent of other changes. (Protection against secular changes) Drug prices | Unclear risk | Quote: Three concurrent events in the study period were mentioned by the author, and were controlled for in the analysis: 1) 50 cents copayment and elimination of OTC‐ coverage by Medicaid 2) drop in number of Medicaid recipients 3) effect of the MAC‐EAC program on drug dispensing fees. Comment: Probably done. There are other changes, but the author adjusts for these changes |
| The intervention is independent of other changes. (Protection against secular changes) Drug expenditures | Low risk | |
| Data were analysed appropriately ? Drug expenditures | Low risk | Comment: Probably done |
| Reason for the number and spacing of data points given Drug expenditures | Low risk | Comment: Probably done |
| Shape of the intervention effect was pre‐specified ? Drug expenditures | Low risk | Comment: Probably done |
| Intervention unlikely to affect data collection. (Protection against detection bias) Drug expenditures | High risk | Quote: An automatic claims processing system was implemented the same day the intervention started Comment: Probably not done |
| Was knowledge of the allocated interventions adequately prevented during the study? Drug expenditures | Low risk | Comment: Probably done |
| Were incomplete outcome data adequately addressed? Drug expenditure | Low risk | Comment: Probably done |
| Reliable primary outcome measure(s) Drug expenditures | Low risk | Comment: Probably done |
| Other risk of bias Drug expenditures | Low risk | Comment: Probably done |
| Baseline adjustment analysis done (properly)? Drug expenditures | Low risk | Comment: Probably done, not relevant |
| Intention to treat analysis done (properly)? Drug expenditures | Low risk | Comment: Probably done, not relevant |
Schneeweiss 2002.
| Methods | RM for drug expenditure and use
No serious limitations CBA for healthcare utilisation No serious limitations |
|
| Participants | Setting: British Columbia, Canada, Ministry of Health's drug subsidy program Pharmacare Physicians: No information provided Patients: Senior citizens (65 yr and older), non‐institutionalised, 119074 in study group Prescriptions: No information provided |
|
| Interventions | Reference pricing on ACE inhibitors | |
| Outcomes | Drug use Drug expenditures Healthcare utilisation | |
| Notes | Supported by grants from the US Agency for Healthcare Research and Quality; the Drug Information Association (Fort Washington, Pa); Pharmacare, Ministry of Health (British Columbia); the Harvard Pilgrim Health Care Foundation; Deutsche Forschungsgemeinschaft; the Pharmacoepidemiology Teaching and Research Fund and the Takemi Associate Award of the Harvard School of Public Health | |
| Risk of bias | ||
| Bias | Authors' judgement | Support for judgement |
| The intervention is independent of other changes. (Protection against secular changes) Drug expenditures | Unclear risk | Comment: Probably not done, not sure |
| The intervention is independent of other changes. (Protection against secular changes) Drug use | Unclear risk | Comment: Probably not done, not sure |
| Data were analysed appropriately ? Drug expenditures | Low risk | Comment: Probably done |
| Data were analysed appropriately ? Drug use | Low risk | Comment: Probably done |
| Were baseline outcome measurements similar? Health care utilisation | Low risk | Quote: Table 1. Small baseline differences Comment: Probably done |
| Were baseline characteristics similar? Health care utilisation | Unclear risk | Quote: Table 1. Small baseline differences Comment: Probably done |
| Reason for the number and spacing of data points given Drug expenditures | Low risk | Comment: Probably done |
| Reason for the number and spacing of data points given Drug use | Low risk | Comment: Probably done |
| Follow‐ up of professionals (protection against attrition/ exclusion bias) Health care utilisation | Low risk | Comment: Probably done |
| Follow‐ up of patients (protection against attrition/ exclusion bias). Health Care Utilisation | Low risk | Comment: Probably done |
| Shape of the intervention effect was pre‐specified ? Drug expenditures | Low risk | Comment: Probably done. The number of pre‐and post‐data points seem justified with respect to the intervention, but no specific reasons given |
| Shape of the intervention effect was pre‐specified ? Drug use | Low risk | Comment: Probably done. The number of pre‐and post‐data points seem justified with respect to the intervention, but no specific reasons given |
| Intervention unlikely to affect data collection. (Protection against detection bias) Drug expenditures | Low risk | Comment: Probably done |
| Intervention unlikely to affect data collection. (Protection against detection bias) Drug use | Low risk | Comment: Probably done |
| Was knowledge of the allocated interventions adequately prevented during the study? Drug expenditures | Low risk | Comment: Probably done |
| Was knowledge of the allocated interventions adequately prevented during the study? Drug use | Low risk | Comment: Probably done |
| Was knowledge of the allocated interventions adequately prevented during the study? Health Care Utilisitation | Low risk | Comment: Probably done |
| Were incomplete outcome data adequately addressed? Drug expenditure | Low risk | Comment: Probably done |
| Were incomplete outcome data adequately addressed? Drug use | Low risk | Comment: Probably done |
| Were incomplete outcome data adequately addressed? Health Care Utilization | Unclear risk | Comment: Probably done |
| Reliable primary outcome measure(s) Drug expenditures | Low risk | Comment: Probably done |
| Reliable primary outcome measure(s) Drug use | Low risk | Comment: Probably done |
| Reliable primary outcome measure(s) Health care utilisation | Low risk | Comment: Probably done |
| Was the study adequately protected against contamination? Health Care Utilisation | Low risk | Comment: Probably done |
| Other risk of bias Drug expenditures | Low risk | Comment: Probably done |
| Other risk of bias Drug use | Low risk | Comment: Probably done |
| Baseline adjustment analysis done (properly)? Drug expenditures | Low risk | Comment: Probably done, not relevant |
| Baseline adjustment analysis done (properly)? Drug use | Low risk | Comment: Probably done, not relevant |
| Intention to treat analysis done (properly)? Drug expenditures | Low risk | Comment: Probably done, not relevant |
| Intention to treat analysis done (properly)? Drug use | Low risk | Comment: Probably done, not relevant |
Schneeweiss 2003.
| Methods | RM for drug use and drug expenditures
No serious limitations CBA for health and healthcare utilisation Limitations |
|
| Participants | Setting: British Columbia, Canada, Ministry of Health's drug subsidy program Pharmacare Physicians: No information provided Patients: Senior citizens (65 yr and older) RM: 35886 CCB users CBA: 1923 switchers, 15557 non‐switchers Prescriptions: No information provided |
|
| Interventions | Reference pricing on CCBs | |
| Outcomes | Drug use Health outcomes Healthcare utilisation Drug expenditures | |
| Notes | Supported by grants from the US Agency for Healthcare Research and Quality; the Drug Information Association (Fort Washington, Pa); Pharmacare, Ministry of Health (British Columbia); the Harvard Pilgrim Health Care Foundation; Deutsche Forschungsgemeinschaft; the Pharmacoepidemiology Teaching and Research Fund and the Takemi Associate Award of the Harvard School of Public Health | |
| Risk of bias | ||
| Bias | Authors' judgement | Support for judgement |
| The intervention is independent of other changes. (Protection against secular changes) Drug expenditures | Low risk | Comment: Probably done |
| The intervention is independent of other changes. (Protection against secular changes) Drug use | Low risk | Comment: Probably done |
| Data were analysed appropriately ? Drug expenditures | Low risk | Comment: Probably done |
| Data were analysed appropriately ? Drug use | Low risk | Comment: Probably done |
| Were baseline outcome measurements similar? Health care utilisation | Unclear risk | Comment: Probably not done. Baseline not reported for switchers versus non‐switchers. But RRs adjusted for potential confounders (see table 4 in the paper) |
| Were baseline characteristics similar? Health care utilisation | High risk | Comment: Probably not done. Baseline not reported for switchers versus non‐switchers. But RRs adjusted for potential confounders (see table 4 in the paper) |
| Reason for the number and spacing of data points given Drug expenditures | Low risk | Comment: Probably done |
| Reason for the number and spacing of data points given Drug use | Low risk | Comment: Probably done |
| Follow‐ up of professionals (protection against attrition/ exclusion bias) Health care utilisation | Low risk | Comment: Probably done |
| Follow‐ up of patients (protection against attrition/ exclusion bias). Health Care Utilisation | Low risk | Comment: Probably done |
| Shape of the intervention effect was pre‐specified ? Drug expenditures | Low risk | Comment: Probably done |
| Shape of the intervention effect was pre‐specified ? Drug use | Low risk | Comment: Probably done |
| Intervention unlikely to affect data collection. (Protection against detection bias) Drug expenditures | Low risk | Comment: Probably done |
| Intervention unlikely to affect data collection. (Protection against detection bias) Drug use | Low risk | Comment: Probably done |
| Was knowledge of the allocated interventions adequately prevented during the study? Drug expenditures | Low risk | Comment: Probably done |
| Was knowledge of the allocated interventions adequately prevented during the study? Drug use | Low risk | Comment: Probably done |
| Were incomplete outcome data adequately addressed? Drug expenditure | Low risk | Comment: Probably done |
| Were incomplete outcome data adequately addressed? Drug use | Low risk | Comment: Probably done |
| Reliable primary outcome measure(s) Drug expenditures | Low risk | Comment: Probably done |
| Reliable primary outcome measure(s) Drug use | Low risk | Comment: Probably done |
| Was the study adequately protected against contamination? Health Care Utilisation | Low risk | Comment: Probably done |
| Other risk of bias Drug expenditures | Low risk | Comment: Probably done |
| Other risk of bias Drug use | Low risk | Comment: Probably done |
| Other risk of bias Health care utilisation | Low risk | Comment: Probably done |
| Baseline adjustment analysis done (properly)? Drug expenditures | Unclear risk | Comment: Probably done |
| Baseline adjustment analysis done (properly)? Drug use | Low risk | Comment: Probably done |
| Intention to treat analysis done (properly)? Drug expenditures | Low risk | Comment: Not relevant |
| Intention to treat analysis done (properly)? Drug use | Low risk | Comment: Not relevant |
Stargardt 2010.
| Methods | ITS No serious limitations |
|
| Participants | Setting: Germany Physicians: No information provided Patients: 237,762 patients prescribed statins in 2004; 42,021 patients treated with atorvastatin during the baseline period Prescriptions: No information provided |
|
| Interventions | Therapeutic reference pricing | |
| Outcomes | Drug use | |
| Notes | Results were reanalysed by reviewers | |
| Risk of bias | ||
| Bias | Authors' judgement | Support for judgement |
| The intervention is independent of other changes. (Protection against secular changes) Drug prices | Unclear risk | |
| The intervention is independent of other changes. (Protection against secular changes) Drug expenditures | Unclear risk | |
| The intervention is independent of other changes. (Protection against secular changes) Drug use | Unclear risk | Not described in the paper |
| Data were analysed appropriately ? Drug prices | Unclear risk | |
| Data were analysed appropriately ? Drug expenditures | Unclear risk | |
| Data were analysed appropriately ? Drug use | Low risk | Data scanned and reanalysis done by reviewers |
| Data were analysed appropriately ? Health Care Utilisation | Unclear risk | |
| Were baseline outcome measurements similar? Health care utilisation | Unclear risk | |
| Were baseline characteristics similar? Health care utilisation | Unclear risk | |
| Reason for the number and spacing of data points given Drug prices | Unclear risk | |
| Reason for the number and spacing of data points given Drug expenditures | Unclear risk | |
| Reason for the number and spacing of data points given Drug use | Low risk | Monthly data are normal and plausible |
| Reason for the number and spacing of data points given Health Care Utilisation | Unclear risk | |
| Follow‐ up of professionals (protection against attrition/ exclusion bias) Health care utilisation | Unclear risk | |
| Follow‐ up of patients (protection against attrition/ exclusion bias). Health Care Utilisation | Unclear risk | |
| Shape of the intervention effect was pre‐specified ? Drug prices | Unclear risk | |
| Shape of the intervention effect was pre‐specified ? Drug expenditures | Unclear risk | |
| Shape of the intervention effect was pre‐specified ? Drug use | Low risk | Prespecified in the reanalysis |
| Shape of the intervention effect was pre‐specified ? Health Care Utilisation | Unclear risk | |
| Intervention unlikely to affect data collection. (Protection against detection bias) Drug prices | Unclear risk | |
| Intervention unlikely to affect data collection. (Protection against detection bias) Drug expenditures | Unclear risk | |
| Intervention unlikely to affect data collection. (Protection against detection bias) Drug use | Low risk | Price policy changes not likely to affect drug expenditures registries |
| Intervention unlikely to affect data collection. (Protection against detection bias) Health Care Utilisation | Unclear risk | |
| Was knowledge of the allocated interventions adequately prevented during the study? Drug expenditures | Unclear risk | |
| Was knowledge of the allocated interventions adequately prevented during the study? Drug use | Unclear risk | Not discussed in the paper if pre knowledge of intervention affected behaviour of patients, physicians and pharma companies before intervention |
| Were incomplete outcome data adequately addressed? Drug expenditure | Unclear risk | |
| Were incomplete outcome data adequately addressed? Drug use | Low risk | National wide register data |
| Were incomplete outcome data adequately addressed? Health Care Utilization | Unclear risk | |
| Reliable primary outcome measure(s) Drug prices | Unclear risk | |
| Reliable primary outcome measure(s) Drug expenditures | Unclear risk | |
| Reliable primary outcome measure(s) Drug use | Low risk | National wide register data |
| Reliable primary outcome measure(s) Health care utilisation | Unclear risk | |
| Was the study adequately protected against contamination? Health Care Utilisation | Unclear risk | |
| Other risk of bias Drug prices | Unclear risk | |
| Other risk of bias Drug expenditures | Unclear risk | |
| Other risk of bias Drug use | Unclear risk | Not discussed in the paper |
| Other risk of bias Health care utilisation | Unclear risk | |
| Baseline adjustment analysis done (properly)? Drug use | Low risk | Comment: Probably done |
| Intention to treat analysis done (properly)? Drug use | Low risk | Comment: Not relevant |
Characteristics of excluded studies [ordered by study ID]
| Study | Reason for exclusion |
|---|---|
| Anis 1994 | Only intermediate outcomes (market shares and prescription shares) |
| Anis 2003 | Only intermediate outcomes (price ratios) |
| Atella 2000 | Simulation model study |
| Barberato 2007 | Not met design inclusion criteria |
| Bergman 1998 | Only intermediate outcomes (market shares and price ratios) |
| Bergman 2003 | The model considers a dummy variable taking the value one after the introduction of the Swedish reference price system |
| Borrell 1999 | Time series study, but not with interrupted time series (ITS) |
| Boyce 1990 | Too few data points to be an ITS |
| Danzon 1997 | This study could not be retrieved |
| Duetz 2003 | Before and after study |
| ECON 2000 | Survey without control group for assessing administration costs Not scannable figures for prices Do not take care of any historical trends in total reference group drug use, thus appropriate ITS study Assume total drug use not affected by RP Historical trends in composition of drug use not taken care of |
| Ekelund 2001 | Only intermediate outcome (generic entry) |
| Giuliani 1998 | Too few data points (post) to be an ITS |
| Hsiao 2010 | Less than three points before and after the intervention |
| Inocencio 2010 | Preintervention period was not assessed |
| Johnson 2011 | Too few data points (pre) with two months of transition period as an ITS |
| Lee 1983 | Too few data points (post) to be an ITS |
| Li 2008 | This study could not be retrieved |
| Morton 1997 | Outcome outside inclusion criteria: Price dispersion Cross‐sectional study of impact on prices |
| Narine 1997 | This study could not be retrieved |
| Narine 1999 | Before and after study |
| Rikstrygdeverket | Do not use relevant historical data Do not take care of any historical trends in total reference group drug use, thus not appropriate ITS study Assume total drug use not affected by RP Historical trends in composition of drug use not taken care of |
| Rothberg 2004 | Too few data points, no clear point of intervention to be an ITS |
| Schneeweiss 2004b | Time series data for drug use, but only post data for administration costs |
| Steyn 2007 | No information about primary data and no protection against secular changes |
| Thomas 1998 | Before and after study |
| Tordoff 2008 | Less than three points before the intervention |
| Ubeda 2007 | Time series. Unclear time point of the intervention |
| Vieira 2006 | Preintervention period was not assessed |
Characteristics of studies awaiting assessment [ordered by study ID]
Huang 2012.
| Methods | ITS |
| Participants | Setting: Taiwan, National Health Insurance system. Pharmaceutical Benefit Scheme Physicians: No information provided Patients: No information provided Prescriptions: No information provided |
| Interventions | Price adjustments |
| Outcomes | Drug use, drug expenditures |
| Notes | Authors were requested for more information about size and effect of outcomes and also pricing policies interventions description from Taiwan |
Lee 2006.
| Methods | ITS Limitations |
| Participants | Setting: Taiwan, National Health Insurance
Physicians: No information provided Patients: No information provided Prescriptions: No information provided |
| Interventions | Reference pricing and generic grouping for ceiling prices |
| Outcomes | Pharmaceutical expenditure |
| Notes | Authors were requested for more information about size and effect of outcomes and also pricing policies interventions description from Taiwan |
Differences between protocol and review
For this update we only included CBA and CRM studies if there were at least two sites in each comparison group, due to EPOC Group recommendations (EPOC 2013a): "We recommend only including cluster randomised trials, non‐randomised cluster trials, and CBA studies with at least two intervention sites and two control sites".
Contributions of authors
For the previous version of this review:
MOA, ATD and ADO prepared the protocol. JPK and HS commented on protocol drafts. MOA, ATD, JPK and HS applied the inclusion criteria, assessed the quality and extracted the data for the included studies. CR further developed the quality criteria (based on the EPOC criteria) for interrupted time series (ITS) and repeated measures (RM) studies and conducted statistical reanalyses for the ITS studies. MOA prepared the first draft of the report. The others commented on and contributed to subsequent iterations.
For this update:
AA, AC, DD, MM, MOA and VV conducted the screening references phase. AA, AC, CV, MOA and VV extracted data and assessed the quality for the included references. JOJ conducted statistical reanalyses for the ITS studies and guided methodological assessment (based on the EPOC criteria). AA, AC and VV prepared the first draft of the report. The others commented on and contributed to subsequent iterations.
Sources of support
Internal sources
Norwegian Knowledge Centre for the Health Services, Norway.
Health Services Research Unit, University of Aberdeen, UK.
-
Universidad Nacional de Colombia, Colombia.
Proyecto Colciencias 2011 ‐ Código 110151929152
-
Instituto de Efectividad Clínica y Sanitaria (IECS), Argentina.
Independent, non‐profit organization, created by professionals from the medical and social sciences devoted to research, education and technical support with the main goal of improving efficiency, equity, and quality of health care systems and policies.
External sources
No sources of support supplied
Declarations of interest
For the previous version of this review:
MOA has previously carried out short term pharmacoeconomic projects for the National Insurance Service and the Norwegian Medicines Agency. From 1997 to 1999 he worked for a private company, Brevreklame, doing market research for pharmaceutical firms in Norway. HS is supported by the Dutch Health Care Insurance Board (CVZ). JPK has previously worked for one year for each of the Danish Medicines Agency and Lundbeck A/S as part of a residency in clinical pharmacology and has been previously employed five hours a week at the Danish Medicines Agency (Licensing Division). Since March 2007 he has been working zero to five hours a week as an advisor for Nordic Biotech.
For this update:
AA has previously carried out short term pharmacoeconomic projects for the Commerce Ministry and other technical projects for the Ministry of Health and the local National Regulatory Authority (INVIMA) in Colombia.
AC has not carried out pharmacoeconomic projects before now.
Edited (no change to conclusions)
References
References to studies included in this review
Aronsson 2001 {published data only}
- Aronsson T, Bergman MA, Rudholm N. The impact of generic drug competition on brand name market shares ‐ evidence from micro data. Review of Industrial Organization 2001;19(4):425‐32. [MEDLINE: ] [Google Scholar]
Brekke 2003 {published data only}
- Brekke K, Grasdal A, Holmås TH, Steen F, Sunnevåg K. Evaluation of the new pharmacy act and the index price system [Evaluering av ny apoteklov og indeksprissystemet]. Bergen (Norway): Rokkansenteret; 2003; Rapport 17. Beregen, Norway: Rokkansenteret. [MEDLINE: ]
Brekke 2011 {published data only}
- Brekke KR, Holmas TH, Straume OR. Reference pricing, competition, and pharmaceutical expenditures: Theory and evidence from a natural experiment. Journal of Public Economics 2011;95:624‐38. [Google Scholar]
Grootendorst 2002 {published data only}
- Grootendorst P, Dolovich L, Holbrook A, Levy A, O'Brien B. The impact of reference pricing of cardiovascular drugs on health care costs and health outcomes: evidence from British Columbia. Volume 2: Technical Report. SEDAP research paper no. 71. Hamilton (ON): McMaster University QSEP Report Series No. 370; 2002. 2. Hamilton, Ontario, Canada: SEDAP.
- Grootendorst PV, Dolovich LR, O'Brien BJ, Holbrook AM, Levy AR. Impact of reference‐based pricing of nitrates on the use and costs of anti‐anginal drugs. Canadian Medical Association Journal 2001;165(8):1011‐19. [PMC free article] [PubMed] [Google Scholar]
Grootendorst 2005 {published data only}
- Grootendorst PV, Marshall JK, Holbrook AM, Dolovich LR, O'Brien BJ, Levy AR. The impact of reference pricing of nonsteroidal anti‐inflammatory agents on the use and costs of analgesic drugs. Health Services Research 2005;40(5 Pt 1):1297‐317. [PUBMED: 16174135] [DOI] [PMC free article] [PubMed] [Google Scholar]
Grootendorst 2006 {published and unpublished data}
- Grootendorst P, Stewart D. A re‐examination of the impact of reference pricing on anti‐hypertensive drug plan expenditures in British Columbia. Health Economics 24 February 2006;15:735–42. [DOI] [PubMed] [Google Scholar]
Hazlet 2002 {published data only}
- Hazlet TK, Blough DK. Health services utilization with reference drug pricing of histamine(2) receptor antagonists in British Columbia elderly. Medical Care 2002;40(8):640‐9. [DOI] [PubMed] [Google Scholar]
Kibicho 2012 {published data only}
- Kibicho J, Pinkerton SD. Multiple drug cost containment policies In Michigan's Medicaid program saved money overall, although some increased costs. Health Affairs 2012;31:816‐26. [DOI] [PMC free article] [PubMed] [Google Scholar]
Marshall 2002 {published data only}
- Marshall JK, Grootendorst PV, O'Brien BJ, Dolovich LR, Holbrook AM, Levy AR. Impact of reference‐based pricing for histamine‐2 receptor antagonists and restricted access for proton pump inhibitors in British Columbia. Canadian Medical Association Journal 2002;166(13):1655‐62. [PMC free article] [PubMed] [Google Scholar]
McManus 2001 {published data only}
- McManus P, Birkett DJ, Dudley J, Stevens A. Impact of the minimum pricing policy and introduction of brand (generic) substitution into the Pharmaceutical Benefits Scheme in Australia. Pharmacoepidemiology and Drug Safety 2001;10(4):295‐300. [DOI] [PubMed] [Google Scholar]
Moreno‐Torres 2011 {published data only}
- Moreno‐Torres I, Puig‐Junoy J, Raya JM. The impact of repeated cost containment policies on pharmaceutical expenditure: Experience in Spain. European Journal of Health Economics 2011;12:563‐73. [DOI] [PubMed] [Google Scholar]
Narine 2001 {published data only}
- Narine L, Senathirajah M, Smith T. An assessment of the impact of reference‐based pricing policies on the H2 antagonist market in British Columbia, Canada. Journal of Research in Pharmaceutical Economics 2001;11(1):63‐78. [Google Scholar]
Pavcnik 2002 {published data only}
- Pavcnik N. Do pharmaceutical prices respond to insurance?. Cambridge (MA): National Bureau of Economic Research; Working Paper 7865; 2000.
- Pavcnik N. Do pharmaceutical prices respond to potential patient out‐of‐pocket expenses?. Rand Journal of Economics 2002;33(3):469‐487. [MEDLINE: ] [PubMed] [Google Scholar]
Puig 2007 {published and unpublished data}
- Puig‐Junoy J. The impact of generic reference pricing interventions in the statin market. Health Policy 2007;84(1):14–29. [DOI] [PubMed] [Google Scholar]
Sawyer 1983 {published data only}
- Sawyer DO. Pharmaceutical reimbursement and drug cost control: the MAC experience in Maryland. Inquiry 1983;20(1):76‐87. [PubMed] [Google Scholar]
Schneeweiss 2002 {published data only}
- Schneeweiss S, Maclure M, Soumerai SB. Prescription duration after drug copay changes in older people: methodological aspects. Journal of the American Geriatrics Society 2002;50(3):521‐5. [DOI] [PubMed] [Google Scholar]
- Schneeweiss S, Soumerai SB, Glynn RJ, Maclure M, Dormuth C, Walker AM. Impact of reference‐based pricing for angiotensin‐converting enzyme inhibitors on drug utilization. Canadian Medical Association Journal 2002;166(6):737‐45. [PMC free article] [PubMed] [Google Scholar]
- Schneeweiss S, Walker AM, Glynn RJ, Maclure M, Dormuth C, Soumerai SB. Outcomes of reference pricing for angiotensin‐converting‐enzyme inhibitors. New England Journal of Medicine 2002;346(11):822‐9. [DOI] [PubMed] [Google Scholar]
Schneeweiss 2003 {published data only}
- Schneeweiss S, Soumerai SB, Maclure M, Dormuth C, Walker AM, Glynn RJ. Clinical and economic consequences of reference pricing for dihydropyridine calcium channel blockers. Clinical Pharmacology and Therapeutics 2003;74(4):388‐400. [DOI] [PubMed] [Google Scholar]
Stargardt 2010 {published and unpublished data}
- Stargardt T. The impact of reference pricing on switching behaviour and healthcare utilisation: the case of statins in Germany. European Journal of Health Economics 29 July 2010;2010(11):267–77. [DOI] [PubMed] [Google Scholar]
References to studies excluded from this review
Anis 1994 {published data only}
- Anis AH. Substitution laws, insurance coverage, and generic drug use. Medical Care 1994;32(3):240‐56. [DOI] [PubMed] [Google Scholar]
Anis 2003 {published data only}
- Anis AH, Guh DP, Woolcott J. Lowering generic drug prices: less regulation equals more competition. Medical Care 2003;41(1):135‐41. [MEDLINE: ] [DOI] [PubMed] [Google Scholar]
Atella 2000 {published data only}
- Atella V. Drug cost containment policies in Italy: are they really effective in the long‐run? The case of minimum reference price. Health Policy 2000;50(3):197‐218. [MEDLINE: ] [DOI] [PubMed] [Google Scholar]
Barberato 2007 {published data only}
- Barberato FS, Lopes LC. The influence of the profit margin on the marketing of medicines. [Portuguese]. Revista de Ciencias Farmaceuticas Basica e Aplicada 2007;28(1):99‐106. [Google Scholar]
Bergman 1998 {published data only}
- Bergman M, Aronsson T, Rudholm N. Reduced drug costs with the reference cost system [Swedish] [Sankta lakemedelspriser med referensprissystemet]. Lakartidningen 1998;95(23):2715‐7. [MEDLINE: ] [PubMed] [Google Scholar]
Bergman 2003 {published data only}
- Bergman MA, Rudholm N. The relative importance of actual and potential competition: empirical evidence from the pharmaceuticals market. Journal of Industrial Economics 2003;51:455‐67. [Google Scholar]
Borrell 1999 {published data only}
- Borrell JR. Pharmaceutical price regulation. A study on the impact of the rate‐of‐return regulation in the UK. Pharmacoeconomics 1999;15(3):291‐303. [MEDLINE: ] [DOI] [PubMed] [Google Scholar]
Boyce 1990 {published data only}
- Boyce D, Bartlett G. The maximum medical aid price programme. A review of the concept and of its ability to reduce expenditure on medicines. South African Medical Journal 1990;78:147‐51. [MEDLINE: ] [PubMed] [Google Scholar]
Danzon 1997 {published data only}
- Danzon PM, Liu H. Reference pricing and physician drug budgets: The German experience in controlling pharmaceutical expenditures. Philadelphia (USA): Wharton School Working Paper; University of Philadelpha; 1997. Wharton School Working Paper; University of Philadelpha, 1997. [MEDLINE: ]
Duetz 2003 {published data only}
- Duetz MS, Schneeweiss S, Maclure M, Abel T, Glynn RJ, Soumerai SB. Physician gender and changes in drug prescribing after the implementation of reference pricing in British Columbia. Clinical Therapeutics 2003;25(1):273‐84. [DOI] [PubMed] [Google Scholar]
ECON 2000 {published data only}
- ECON. Evaluation of the reference price system for pharmaceuticals [Norwegian] [Evaluering av referanseprissystemet for legemidler]. Oslo (Norway): ECON; 2000. ECON‐rapport 44/2000; Oslo Vol. ECON‐rapport 44/2000.
Ekelund 2001 {published data only}
- Ekelund M. Generic entry before and after the introduction of reference prices. In: Ekelund M editor(s). Competition and innovation in the Swedish pharmaceutical market. Stockholm: Stockholm School of Economics, 2001:Chapter 4. [MEDLINE: ] [Google Scholar]
Giuliani 1998 {published data only}
- Giuliani G, Selke G, Garattini L. The German experience in reference pricing. Health Policy 1998;44:73‐85. [DOI] [PubMed] [Google Scholar]
Hsiao 2010 {published data only}
- Hsiao FY, Tsai YW, Huang WF. Price regulation, new entry, and information shock on pharmaceutical market in Taiwan: a nationwide data‐based study from 2001 to 2004. BMC Health Services Research 2010;10:218. [DOI] [PMC free article] [PubMed] [Google Scholar]
Inocencio 2010 {published data only}
- Marcos I, Sanches Amorim MC, Hoyos Guevara AJ, Vivo B. Financial incentives for generic drugs: case study on a reimbursement program. Einstein (Säo Paulo) 2010;8(2 Pt 1):154‐61. [DOI] [PubMed] [Google Scholar]
Johnson 2011 {published data only}
- Johnson JT, Neill KK, Davis DA. Five‐year examination of utilization and drug cost outcomes associated with benefit design changes including reference pricing for proton pump inhibitors in a state employee health plan. Journal of Managed Care Pharmacy 2011;17:200‐12. [DOI] [PMC free article] [PubMed] [Google Scholar]
Lee 1983 {published data only}
- Lee AJ, Hefner D, Dobson A, Hardy RJ. Evaluation of the maximum allowable cost program. Health Care Financing Review 1983;4(3):71‐82. [PMC free article] [PubMed] [Google Scholar]
Li 2008 {published data only}
- Li L, Chen Y, Yao L, Li Y. Evaluation of the effects of implementing the policy "Without Added Profit" to sale drug in community health service institutions of Chengdu. [Chinese]. Chinese Journal of New Drugs 2008;17(21):1820‐2,1842. [Google Scholar]
Morton 1997 {published data only}
- Morton FMS. The interaction between a most‐favored‐customer clause and price dispersion: an empirical examination of the Medicaid rebate rules of 1990. Journal of Economics and Management Strategy 1997;6(1):151‐74. [Google Scholar]
Narine 1997 {published data only}
- Narine L, Senathirajah M. Pharmaceutical cost containment policies: intended and unintended impacts. Toronto (ON): University of Toronto; 1997; Report prepared for the Pharmaceutical Manufacturers Association of Canada. Toronto: Department of Health Administration, University of Toronto.
Narine 1999 {published data only}
- Narine L, Senathirajah M, Smith T. Evaluating reference‐based pricing: initial findings and prospects. Canadian Medical Association Journal 1999;161(3):286‐8. [PMC free article] [PubMed] [Google Scholar]
Rikstrygdeverket {published data only}
- Rikstrygdeverket. Economic consequences of the reference price scheme [Norwegian] [Økonomiske konsekvenser av referanseprisordningen]. Oslo (Norway): Rikstrygdeverket; 1999; Rapport 4/99. 4/99.
Rothberg 2004 {published data only}
- Rothberg AD, Blignault J, Serfontein CB, Valodia B, Eekhout S, Pels LM. Experience of a medicines reference‐pricing model. South African Medical Journal 2004;94:183‐8. [PubMed] [Google Scholar]
Schneeweiss 2004b {published data only}
- Schneeweiss S, Dormuth C, Grootendorst P, Soumerai S, Maclure M. Net health plan savings from reference pricing for angiotensin‐converting enzyme inhibitors in elderly British Columbia residents. Medical Care 2004;42(7):653‐60. [DOI] [PubMed] [Google Scholar]
Steyn 2007 {published data only}
- Steyn R, Burger JR, Serfontein JH, Lubbe MS. Influence of a new reference‐based pricing system in South Africa on the prevalence and cost of antidiabetic medicine: a pilot study [Influence of a new reference‐based pricing system in South Africa on the prevalence and cost of antidiabetic medicine: a pilot study]. International Journal of Pharmacy Practice 2007;15(4):307‐11. [Google Scholar]
Thomas 1998 {published data only}
- Thomas M, Mann J, Williams S. The impact of reference pricing on clinical lipid control. New Zealand Medical Journal 1998;August:292‐4. [PubMed] [Google Scholar]
Tordoff 2008 {published data only}
- Tordoff JM, Norris PT, Reith DM. "Price management" and its impact on hospital pharmaceutical expenditure and the availability of medicines in New Zealand hospitals. Value in Health 2008;11(7):1214‐26. [DOI] [PubMed] [Google Scholar]
Ubeda 2007 {published data only}
- Ubeda A, Cardo E, Selles N, Broseta R, Trillo JL, Fernandez‐Llimos F. Antidepressant utilization in primary care in a Spanish region: impact of generic and reference‐based pricing policy (2000‐2004). Social Psychiatry and Psychiatric Epidemiology 2007;42(3):181‐8. [DOI] [PubMed] [Google Scholar]
Vieira 2006 {published data only}
- Vieira FS, Zucchi P. [Price differences between generic and innovator medicines in Brazil] [Diferencas de precos entre medicamentos genericos e de referencia no Brasil]. Revista de Saude Publica 2006;40(3):444‐9. [DOI] [PubMed] [Google Scholar]
References to studies awaiting assessment
Huang 2012 {published data only}
- Huang SH, Hsu CN, Yu SH, Cham TM. Impact of drug price adjustments on utilization of and expenditures on angiotensin‐converting enzyme inhibitors and angiotensin receptor blockers in Taiwan. BMC Public Health 2012;12:288. [DOI] [PMC free article] [PubMed] [Google Scholar]
Lee 2006 {published and unpublished data}
- Lee YC, Yang MC, Huang YT, Liu CH, Chen SB. Impacts of cost containment strategies on pharmaceutical expenditures of the National Health Insurance in Taiwan, 1996–2003. Pharmacoeconomics 2006;24(9):891‐902. [DOI] [PubMed] [Google Scholar]
Additional references
Aaserud 2006a
- Aaserud M, Austvoll‐Dahlgren A, Sturm H, Kösters JP, Hill S, Furberg CD, et al. Pharmaceutical policies: effects on rational drug use (Protocol). Cochrane Database of Systematic Reviews 2006, Issue 2. [DOI: 10.1002/14651858.CD004397.pub2] [DOI] [Google Scholar]
Austvoll‐Dahlgren 2008
- Austvoll‐Dahlgren A, Aaserud M, Vist G, Ramsay C, Oxman AD, Sturm H, et al. Pharmaceutical policies: effects of cap and co‐payment on rational drug use. Cochrane Database of Systematic Reviews 2008, Issue 1. [CENTRAL: 005979; DOI: 10.1002/14651858.CD005979] [DOI] [PubMed] [Google Scholar]
Balshem 2011
- Balshem H, Helfand M, Schunemann HJ, Oxman AD, Kunz R, Brozek J, et al. GRADE guidelines: 3. Rating the quality of evidence. Journal of Clinical Epidemiology 2011;64(4):401‐6. [DOI] [PubMed] [Google Scholar]
Ciapponi 2011
- Ciapponi A, Glujovsky D, Bardach A, García Martí S, Comande D. EROS: a new software for early stage of systematic reviews. ISPOR 3rd Latin America Conference. Hilton Mexico City Reforma in Mexico City, Mexico, 2011.
Danzon 2008
- Danzon PM, Furukawa MF. International prices and availability of pharmaceuticals in 2005. Health Affairs (Millwood) 2008;1(1):221‐33. [DOI] [PubMed] [Google Scholar]
Dickson 1998
- Dickson M, Redwood H. Pharmaceutical reference prices. How do they work in practice?. Pharmacoeconomics 1998;14(5):471‐9. [DOI] [PubMed] [Google Scholar]
EPOC 2013a
- Effective Practice, Organisation of Care (EPOC). Suggested risk of bias criteria for EPOC reviews. EPOC resources for review authors. Available at: http://epocoslo.cochrane.org/epoc‐specific‐resources‐review‐authors 2013.
EPOC 2013b
- Effective Practice, Organisation of Care (EPOC). Interrupted time series (ITS) analyses. EPOC resources for review authors. Available at: http://epocoslo.cochrane.org/epoc‐specific‐resources‐review‐authors 2013.
EPOC 2013c
- Effective Practice, Organisation of Care (EPOC). Synthesising results when it does not make sense to do a meta‐analysis. EPOC Resources for review authors. Available at: http://epocoslo.cochrane.org/epoc‐specific‐resources‐review‐authors 2013.
EPOC 2013d
- Effective Practice, Organisation of Care (EPOC). EPOC Worksheets for preparing a Summary of Findings (SoF) table using GRADE. EPOC Resources for review authors. Available at: http://epocoslo.cochrane.org/epoc‐specific‐resources‐review‐authors 2013.
Espin 2007
- Espin J, Rovira R. Analysis of differences and commonalities in pricing and reimbursement systems in Europe. European Commission 2007; Vol. http://ec.europa.eu/enterprise/sectors/healthcare/files/docs/study_pricing_2007/andalusian_school_public_health_report_pricing_2007_en.pdf.
Espin 2011
- Espin J, Rovira J, Olry de Labry A. Review Series on Pharmaceutical Pricing Policies and Interventions Working Paper 1: External Reference Pricing. Review Series on Pharmaceutical Pricing Policies and Interventions. WHO/HAI Project on Medicine Prices and Availability May 2011.
Faden 2011
- Faden L, Vialle‐Valentin C, Ross‐Degnan D, Wagner A. Active pharmaceutical management strategies of health insurance systems to improve cost‐effective use of medicines in low‐ and middle‐income countries: a systematic review of current evidence. Health Policy (Amsterdam, Netherlands) 2011;100(2‐3):134‐43. [PUBMED: 21185616] [DOI] [PubMed] [Google Scholar]
Festoy 2008
- Festöy H, Sveen K, Yu LM, Gjönnes L, Gregersen T. Pharmaceutical pricing and reimbursement information. Norwegian Medicines Agency 2008.
Galizzi 2011
- Galizzi MM, Ghislandi S, Miraldo M. Effects of reference pricing in pharmaceutical markets: a review. PharmacoEconomics 2011;29(1):17‐33. [DOI] [PubMed] [Google Scholar]
Glujovsky 2010
- Glujovsky D, Bardach A, García Martí S, Comande D, Ciapponi A. New software for early stage of systematic reviews. XVIII Cochrane Colloquium. The Joint Colloquium of the Cochrane and Campbell Collaborations. Keystone Resort, Colorado, USA, 2010.
GRADEpro 2008 [Computer program]
- Brozek J, Oxman A, Schünemann H. GRADEpro. [Computer program]. Version 3.2 for Windows. the GRADE Working Group, 2008.
Green 2010
- Green CJ, Maclure M, Fortin PM, Ramsay CR, Aaserud M, Bardal S. Pharmaceutical policies: effects of restrictions on reimbursement.. Cochrane Database of Systematic Reviews 2010, Issue 8. [CENTRAL: 008654; DOI: 10.1002/14651858.CD008654] [DOI] [PMC free article] [PubMed] [Google Scholar]
Higgins 2011
- Higgins JPT, Green S. Cochrane Handbook for Systematic Reviews of Interventions Version 5.1.0 [updated March 2011]. The Cochrane Collaboration, 2011. [Google Scholar]
Ioannides‐Demos 2002
- Ioannides‐Demos LL, Ibrahim JE, McNeil JJ. Reference‐based pricing schemes: effect on pharmaceutical expenditure, resource utilisation and health outcomes. PharmacoEconomics 2002;20(9):577‐91. [DOI] [PubMed] [Google Scholar]
McLaughin 1997
- McLaughin P. Reference‐based pricing of prescription drugs. Canadian Journal of Cardiology 1997;13(1):31‐2. [PubMed] [Google Scholar]
Mossialos 2004
- Mossialos E, Mrazek M, Walley T. Regulating pharmaceuticals in Europe: striving for efficiency, equity and quality. First Edition. Great Britain: Open University Press, McGraw‐Hill Education, 2004. [Google Scholar]
Moïse 2008
- Moïse P, Docteur E. Pharmaceuticals pricing and reimbursement policies in Mexico, OECD, 2007 [Las políticas de precios y reembolsos farmacéuticos en México, OCDE, 2007]. OECD Health Working Papers 2008;No. 29:s504‐10. [PubMed] [Google Scholar]
Norwegian Pharmacy Association 2008
- The Norwegian Pharmacy Association. The medicines market in Norway ‐ prices and regulations. www.apotek.no August 2008.
OECD 2008
- OECD Health Data 2008 [Pharmaceutical Pricing Policies in a Global Market]. Organisation for Economic Co‐operation and Development. ORGANISATION FOR ECONOMIC CO‐OPERATION AND DEVELOPMENT, 2008.
Pharmanet 2003
- British Columbia Medical Association. Physician access to Pharmanet. http://www.bcma.org/public/news_publications/publications/policy_backgrounders/PhysicianAccessPharmaNet.asp (accessed 18 January 2006).
Pharmanet 2005
- Ministry of Health in British Columbia. Pharmanet. http://www.healthservices.gov.bc.ca/pharme/pharmanet/netindex.html (accessed 18 January 2006).
PHIS 2011
- AIFA, Gesundheit Österreich GmbH. PHIS Glossary [Pharmaceutical Health Information System Glossary]. http://whocc.goeg.at/Literaturliste/Dokumente/MethodologyTemplate/PHIS%20Glossary_UpdatedApril2011.pdf 2011:16, 25.
PPRS 2009
- Pharmaceutical Price Regulation Scheme, Tenth report Dec 2009. available at www.dh.gov.uk/publications [Accessed on 17th Oct 2011].
Productivity 2001
- Productivity Commission 2001. International pharmaceutical price differences. Canberra (AU): Research report, Ausinfo. Canberra.
Puig‐Junoy 2007
- Puig‐Junoy J, Moreno‐Torres I. Impact of pharmaceutical prior authorisation policies: a systematic review of the literature. PharmacoEconomics 2007;25(8):637‐48. [PUBMED: 17640106] [DOI] [PubMed] [Google Scholar]
Puig‐Junoy 2010
- Puig‐Junoy J. Impact of European pharmaceutical price regulation on generic price competition: a review. PharmacoEconomics 2010;28(8):649‐63. [DOI] [PubMed] [Google Scholar]
Puig‐Junoy 2010a
- Puig‐Junoy J. Policies encouraging price competition in the generic drug market: Lessons from the European experience [Polí́ticas de fomento de la competencia en precios en el mercado de genéricos: lecciones de la experiencia europea]. Gaceta Sanitaria 2010;24(3):193‐9. [MEDLINE: ] [DOI] [PubMed] [Google Scholar]
Ramsay 2003
- Ramsay CR, Matowe L, Grilli R, Grimshaw JM, Thomas RE. Interrupted time series design in health technology assessment: Lessons from two systematic reviews of behavior change strategies. International Journal of Technology Assessment in Health Care 2003;19(4):612‐23. [DOI] [PubMed] [Google Scholar]
RevMan 2011 [Computer program]
- The Nordic Cochrane Centre, The Cochrane Collaboration. Review Manager (RevMan). Copenhagen: The Nordic Cochrane Centre, The Cochrane Collaboration, 2011.
Sturm 2007
- Sturm H, Austvoll‐Dahlgren A, Aaserud M, Oxman AD, Ramsay C, Vernby A, Kösters JP. Pharmaceutical policies: effects of financial incentives for prescribers.. Cochrane Database of Systematic Reviews 2007, Issue 3. [CENTRAL: 006731; DOI: 10.1002/14651858.CD006731] [DOI] [PubMed] [Google Scholar]
Vacca 2011
- Vacca C, Acosta A, Rodriguez I. International reference prices and cost minimization analysis for pricing regulation in Colombia [Precios de Referencia Internacional y Análisis de Costo Minimización para la Regulación de Precios de Medicamentos en Colombia]. Value in Health July 2011;14(5):S16‐9. [DOI] [PubMed] [Google Scholar]
Vogler 2008
- Vogler S, Habl C, Leopold C, Rosian‐Schikuta I, Joncheere K, Thomsen T, et al. The Pharmaceutical Pricing and Reimbursement Information project Report [PPRI Report]. European Commission, Directorate‐General Health and Consumer Protection and Austrian Federal Ministry of Health, Family and Youth June, 2008:XVI‐XVIII.
WHO 2011
- The World Medicines Situation. WHO 2011.
Zammit‐Lucia 1995
- Zammit‐Lucia J, Dasgupta R. Reference pricing: the European experience. Health Policy Review. 10. England: St. Mary's Hospital Medical School, 1995; Vol. 10:1‐31.
References to other published versions of this review
Aaserud 2006b
- Aaserud M, Austvoll‐Dahlgren A, Kösters JP, Oxman AD, Ramsay C, Sturm H. Pharmaceutical policies: effects of reference pricing, other pricing, and purchasing policies. Cochrane Database of Systematic Reviews 2006, Issue 2. [DOI: 10.1002/14651858.CD005979] [DOI] [PubMed] [Google Scholar]