FIG 5.
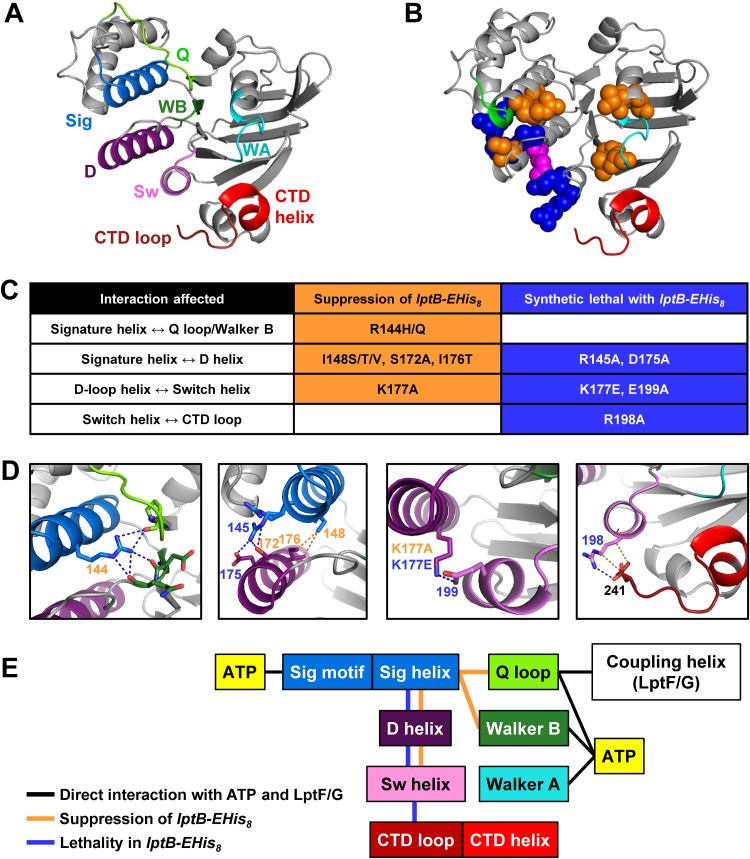
A network of helices connects the functions of the signature helix and the CTD of LptB. (A) Cartoon view of the structure of a monomer of ATP-bound His8-LptBE163Q (PDB 6MBN). Relevant domains are the Q loop (Q; chartreuse), signature domain and helix (Sig; blue), Walker B domain (WB; forest green), Walker A domain (WA; cyan), D-loop helix (D; dark purple), switch helix (Sw; violet), CTD helix (red), and CTD loop (brick red). (B) Interactions observed in the ATP-bound crystal structure of His8-LptBE163Q (dimer interface view of PDB 6MBN). Spheres correspond to residues that, when substituted, resulted in suppression (in orange) or synthetic lethality (in blue) or both depending on the substitution (pink). The Walker A and signature motifs are colored in cyan and green, respectively, and the CTD is shown in red. (C) Summary of substitutions that suppress (in orange) or cause lethality (in blue) when introduced into LptB-EHis8 (complete data are shown in Fig. 4; see also Fig. S6B and C). (D) Expanded views of structures of LptB (PDB 6MBN) with residues depicted as sticks and polar (blue) or nonpolar (orange) interactions depicted as dotted lines. Residue numbers are colored according to whether substitutions shown in panel C led to suppression (orange) or lethality (blue). (E) Schematics showing key domains and relevant physical and genetic interactions. Direct interactions between LptB domains and ATP or the coupling helices of LptF/G are marked with black lines. Orange lines represent interactions that, when altered, led to suppression of defects conferred by lptB-EHis8. Blue lines represent interactions that, when changed, led to synthetic lethality with lptB-EHis8.

