

Abstract
Human speech features rhythmicity that frames distinctive, fine-grained speech patterns. Speech can thus be counted among rhythmic motor behaviors that generally manifest characteristic spontaneous rates. However, the critical neural evidence for tuning of articulatory control to a spontaneous rate of speech has not been uncovered. The present study examined the spontaneous rhythmicity in speech production and its relationship to cortex–muscle neurocommunication, which is essential for speech control. Our MEG results show that, during articulation, coherent oscillatory coupling between the mouth sensorimotor cortex and the mouth muscles is strongest at the frequency of spontaneous rhythmicity of speech at 2–3 Hz, which is also the typical rate of word production. Corticomuscular coherence, a measure of efficient cortex–muscle neurocommunication, thus reveals behaviorally relevant oscillatory tuning for spoken language.
Introduction
The amplitude envelope of the human speech signal displays spectral maxima at frequencies below ∼5–7 Hz (Tilsen and Johnson, 2008; Chandrasekaran et al., 2009). The coordinated temporal patterns contain fine-grained local features that mark the constituents of speech, such as syllables and words, and more global features whose regularities appear as rhythmic patterns (MacNeilage, 1998). Prosodic regularities, including stress and syllabic grouping, occur at frequencies below ∼5 Hz (Allen, 1975). The rate of word production (in Finnish 2–3 Hz) also falls within this range, with the syllable frequency at double or triple the word rate (Sallinen-Kuparinen, 1978). Speech production thus seems to operate at relatively low-frequency rhythmicities.
Markedly consistent repetitive patterns, so-called preferred or spontaneous rates, have been observed for various rhythmic motor behaviors, such as human walking and finger tapping at ∼2 Hz (Frischeisen-Köhler, 1933; MacDougall and Moore, 2005; Ruspantini and Chistolini, 2009). Speech production is also likely to exhibit a similar kind of preference for certain rates. Yet, compared with conspicuous oromotor rhythms such as chewing or infantile babbling (Schieppati et al., 1989; Dolata et al., 2008), spontaneous rhythmicity in complex adult speech is likely to be a less salient phenomenon (Smith, 1992).
The present study examined the spontaneous rhythmicity in speech production and its relationship to cortex–muscle neurocommunication, which is essential for speech control (Penfield and Roberts, 1959; Terao et al., 2007). Mouth muscle activity was tracked with surface EMG during natural speech (overt narration) and repetitive syllable articulation, a rudimentary form of speech (MacNeilage and Davis, 2000). Whereas spontaneous natural speech displays a convoluted EMG pattern (Smith, 1992), with rhythmicity embedded in a strong 1/f trend (Fig. 1A, inset), syllable repetition serves as a useful and clear-cut paradigm for rate-controlled experimentation of articulatory behavior.
Figure 1.
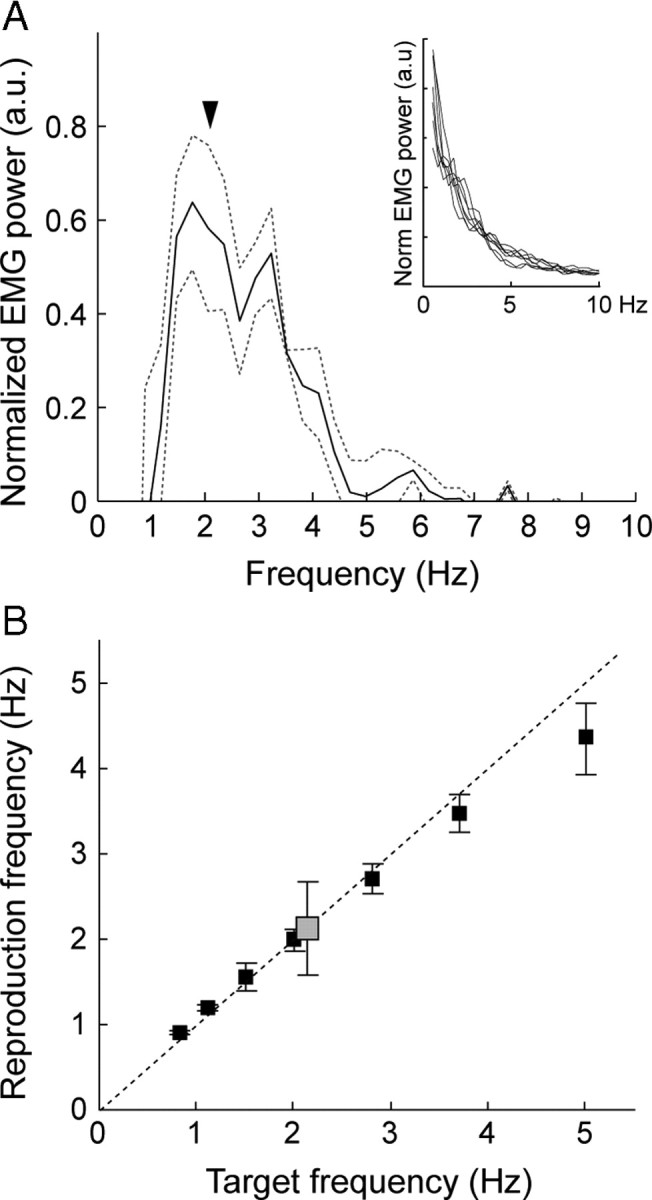
Behavioral results. A, Spontaneous speech (overt narration). Normalized mean (solid line) and variance (dashed lines) of the EMG power spectrum with the 1/f trend regressed out are shown. Inset, the original individual spectra (n = 7) are displayed for reference. The arrowhead indicates the mean rate of spontaneous syllable (/pa/) repetition. B, Syllable production. The gray box represents the mean (± SD; n = 11) /pa/ syllable rate in spontaneous production. For the reproduction experiment, the black boxes illustrate the actual reproduction frequencies of /pa/ syllables (mean ± SD; n = 11) as a function of the target frequencies (0.8, 1.1, 1.5, 2, 2.8, 3.7, and 5). The dashed diagonal line indicates ideal compliance with the target rate.
The cortex–muscle interplay was quantified with corticomuscular coherence. Coherence, a correlation measure between oscillatory signals, has been proposed to reflect efficiency of neuronal communication, such that increasing coherence between oscillating assemblies potentiates their mutual information transfer (communication through coherence hypothesis; Fries, 2005). High-frequency (20/40 Hz) coherence between the hand muscles and the hand representation area of the primary sensorimotor cortex (SMC) has been described during sustained contraction (Salenius et al., 1997; Schoffelen et al., 2005). Here, using MEG coherence imaging (Gross et al., 2001), we identified cortical activity that is coherent with oromuscular signals during syllable articulation and quantified it as a function of target rate.
We hypothesized that (1) both syllable repetition and complex natural speech show spontaneous rhythmicity at ∼2 Hz, which is characteristic of various rhythmic movements; (2) for articulation at different target rates, the mouth representation area of the SMC is the most prominent area of corticomuscular coherence; and (3) the cortex–muscle coherence is highest at frequencies that match the individual spontaneous rhythmicity of speech, likely indicating particularly efficient cortical control of mouth muscles.
Materials and Methods
Participants.
Twelve healthy Finnish-speaking subjects (6 females; 11 right-handed, 1 ambidextrous; mean age 32 years, range 28–43 years) gave their informed consent to participate in the study, as approved by the Helsinki and Uusimaa Ethics committee. One subject was excluded because of an anomalous rate of spontaneous syllable repetition (deviation from the sample mean exceeded 2 SD).
Experimental design.
In each trial of the MEG/EMG experiment, the subject first listened to a 10 s sequence of /pa/ syllables at a specific frequency and, subsequently, sought to repeat the syllable at this target rate for 10 s. The stimulus syllable was a synthesized Finnish /pa/ lasting for 150 ms and resembling a male voice. Syllable reproduction was prompted by a go signal (50-ms, 1 kHz tone) that was presented after a delay equal to the interstimulus interval of the preceding /pa/ sequence. An identical signal indicated the end of the reproduction period 10 s later. The next trial started 100 ms after the stop signal. All sounds were presented binaurally through plastic tubes and intracanal earpieces at a comfortable listening level. Seven frequencies (0.8, 1.1, 1.5, 2, 2.8, 3.7, and 5 Hz), overlapping with rhythmicity in natural speech (Allen, 1975; Tilsen and Johnson, 2008), were set equally spaced on a logarithmic scale. The syllables were mouthed silently, without vocalization, to emphasize articulation. The subjects were trained to articulate with small-amplitude, lip-rather-than-jaw-weighted movements and refrain from head movements to reduce artifacts in MEG signals. The target frequency remained the same for three consecutive trials (a mini-block) to stabilize the reproduction. The experiment included six pause-separated measurement sessions that comprised one mini-block of each target frequency, with the order of frequencies randomized.
The spontaneous frequency of syllable repetition was acquired for each subject before the MEG recording, with the subject asked to periodically articulate the /pa/ syllable, mouthing silently, at a self-paced, comfortable rate.
EMG of natural speech production was recorded from 7/11 subjects, in a separate occasion to avoid possible entrainment effects. Inspired by displayed photographs, the subjects freely produced overt narration with vocalization. Furthermore, the subjects read aloud a Finnish 600 word book chapter to facilitate consistent estimation of behavioral word/syllable production rates.
Recordings.
MEG signals were recorded with a Neuromag Vectorview whole-head device (Elekta Oy), filtered to 0.03–200 Hz and sampled at 600 Hz. The MEG coordinate system was aligned with individual MRIs (3T General Electric Signa) with the help of four head position indicator coils attached to the scalp. The coils were briefly energized before measurement, and their locations were determined with respect to anatomical landmarks, identified with a 3D digitizer (Isotrak 3S1002, Polhemus Navigation Science).
Muscular activity was recorded with surface electromyography, using bipolar electrodes attached to the diametrically opposite corners of the mouth (orbicularis oris muscle). Blinks and eye movements were monitored with EOG. A fixation point was presented during the MEG measurements to avoid eye movements.
Behavioral analysis.
The individual rates of /pa/ reproduction (at seven target frequencies) and spontaneous /pa/ repetition were obtained from the power spectral peaks of the high-pass-filtered (>30 Hz) and rectified mouth EMG signal. To describe the more convoluted spectral pattern of the overt spontaneous narration data, frequencies of the local EMG power maxima were collected automatically (range 0.5–7.5 Hz; points of positive-to-negative reversals in the first derivate). For easier visualization of the concentration of EMG maxima the dominant 1/f trend was regressed out. Word/syllable production rates were estimated from the overt reading sample.
Identification of cortical sources.
External disturbances and movement artifacts were removed from the MEG data by using spatiotemporal signal space separation (Taulu and Simola, 2006). EMG–MEG coherence and power levels were first estimated at the MEG sensor level. The cortical areas showing rhythmic activity coherent with the mouth EMG were then identified with dynamic imaging of coherent sources (DICS) (Gross et al., 2001). Based on the oscillatory components and their linear dependencies, represented as a cross-spectral density matrix (CSD), DICS uses spatial filtering to estimate oscillatory power and coherence in the brain. In the present analysis, CSDs across all planar-gradiometer MEG signals and the high-pass-filtered and rectified mouth EMG signal were calculated separately for each target frequency of /pa/ reproduction, across the 3 min of data collected per condition. These calculations used Welch's averaged periodogram method (Hanning 2048-point window; 0.3 Hz resolution; 75% window overlap). A spherical conductor model was used in the DICS spatial filter. Coherence and power estimates were calculated on a grid with 6 mm spacing, covering the entire brain.
First, the group-level spatial configuration of corticomuscular coherence was estimated as a statistical map (pairwise t statistics; p < 0.05 with Bonferroni correction), with the individual coherence maps transformed to one subject's brain (Schormann and Zilles, 1998). The results were visualized by using the FreeSurfer software package (http://surfer.nmr.mgh.harvard.edu/). The coherence maps were calculated across all the /pa/ reproduction frequencies and contrasted against resting-state data (3 min).
Subsequently, an accurate individual-level spatial description of the consistent group-level foci (the left and right SMC) was obtained for a precise quantification of the cortex–muscle coherence. The frequency range 2–6 Hz was applied for all conditions; it represented a tradeoff between identifying an optimal frequency range for all conditions and avoiding any error caused by typical low-frequency artifacts. For each subject, the center points of salient SMC foci were collected in each /pa/ rate condition, and their cluster centers were determined to obtain a single representative cortical locus per hemisphere.
Cortical source-level analysis.
At the individual cluster centers, the time series of activity in /pa/ reproduction was estimated with spatial filtering, using a 1.8 Hz wide band centered at the actual reproduction frequency. Both power spectra and coherence spectra (with mouth EMG as the reference) were computed. Coherence was considered significant when it exceeded the 99% confidence levels estimated using two separate approaches. First, the confidence levels under the hypothesis of independence were estimated based on the number of disjoint Fourier transformation sections in the coherence calculation (Halliday et al., 1995). Second, surrogate data were generated by adding a different random phase angle to the EMG and MEG Fourier transformations in each section and calculating the new coherence estimates. The procedure was repeated 1000 times to obtain a distribution from which the 99% confidence levels could be calculated. For each target rate, the peak coherence level was collected either at the fundamental performance frequency or the exact first harmonic frequency, depending on which one displayed the strongest peak in that individual; the first harmonic likely reflects the pseudosinusoidal nature of the open–close phases of syllable articulation (cf. Pollok et al., 2005; Butz et al., 2006).
Modulation of the corticomuscular coherence strength by target rate was evaluated statistically at the group level by using a nonparametric related-samples Friedman rank test with post hoc pairwise comparisons of mean rank differences as a z-standardization (PASW statistics 18.0; SPSS), separately for each hemisphere. The hypothesized positive association between the individual spontaneous /pa/ production rate and the reproduction frequency with the strongest corticomuscular coherence was tested by using Spearman's one-tailed rank correlation test.
Results
Figure 1A illustrates the mean mouth EMG power spectrum for spontaneous overt narration with the 1/f trend regressed out (original curves in the inset); local rhythmicities were concentrated at the prosodic/word production frequencies, ∼2.5 Hz (∼1.5–3.5 Hz), combined with less pronounced higher rhythmicities close to 6 Hz (∼4–8 Hz). Complementing these results, the estimated word rate from overt reading was 2.3 Hz (±0.2 Hz, SD) and syllable rate 5.2 Hz (±0.6 Hz, SD). When subjects were asked to repetitively produce /pa/, self-paced, a spontaneous rate emerged at 2.1 Hz (±0.5 Hz) (Fig. 1B, gray box). In the reproduction experiment with specified target rates, all subjects successfully produced the /pa/ syllables at rates close to the target frequencies (Fig. 1B). The intersubject variability (SD) tended to increase with the target rate, and the performance overall was biased toward the ∼2 Hz middle range, as evident particularly in the slower-than-target performance at the fastest rates (Fig. 1B).
EMG–MEG coherence displayed peaks at frequencies that corresponded to the movement rate (fundamental and its first harmonic) (Fig. 2A, one subject) on MEG sensors located bilaterally above the ventral part of the SMC. In each subject, the primary cerebral source was found, consistently, in the bilateral ventral SMC, corresponding to the sensorimotor representation area of the mouth (Fig. 2B) (mean location in Talairach coordinates −53, − 11, and 34 in the left SMC and 57, − 9, and 34 in the right SMC). Notably, identification of the SMC sources was possible only through corticomuscular coherence, not based on signal power at these low frequencies.
Figure 2.

Sensor-level and source-level results. A, On the MEG helmet, EMG-MEG coherence was detected bilaterally above the lateral SMC, as displayed for one subject. Coherence spectra of the highlighted left (L) and right (R) hemisphere sensors show, in this individual, a maximum at the fundamental (/pa/ reproduction rate) coherence frequency over the left SMC and maxima at both the fundamental and its harmonic frequency over the right SMC. B, The ventral SMC, bilaterally, shows corticomuscular coherence in a group-level statistical map, calculated across all /pa/ reproduction frequencies and contrasted against resting-state data (pairwise t statistics; p < 0.05; Bonferroni corrected; n = 10). The color bar indicates t score.
Coherence peaks, salient at all target rates, exceeded the strict 99% confidence level in 10/11 subjects in the left SMC and 9/11 subjects in the right SMC (on average, in 4/7 target-rate conditions per subject). The strongest peak occurred either at the performance rate (left, 5/10 subjects; right, 4/9 subjects) or its first harmonic (left, 5/10 subjects; right, 5/9 subjects). The strength of the cortex–muscle coherence, as a function of the target frequency, displayed a bell-shaped relationship in both hemispheres (Fig. 3A). The highest coherence values were found in the middle range of the target frequencies (1.5–3.5 Hz; Friedman rank test, p < 0.005 for both hemispheres; post hoc comparisons 2 vs 0.8 Hz and 2 vs 5 Hz, p < 0.01 for the left and p < 0.05 for the right hemisphere). This optimal frequency range for corticomuscular coherence in rate-controlled /pa/ production (Fig. 3A) agreed markedly well with the concentration of the EMG local maxima in natural spontaneous speech (Fig. 1A) and overlapped with the spontaneous rate of /pa/ repetition (Fig. 3A). The individual /pa/ target reproduction frequency that yielded the strongest corticomuscular coherence was significantly correlated with the spontaneous rate of /pa/ production in both the left SMC (Spearman's ρ = 0.68; p = 0.02) and the right SMC (ρ = 0.66; p = 0.03) (Fig. 3B).
Figure 3.
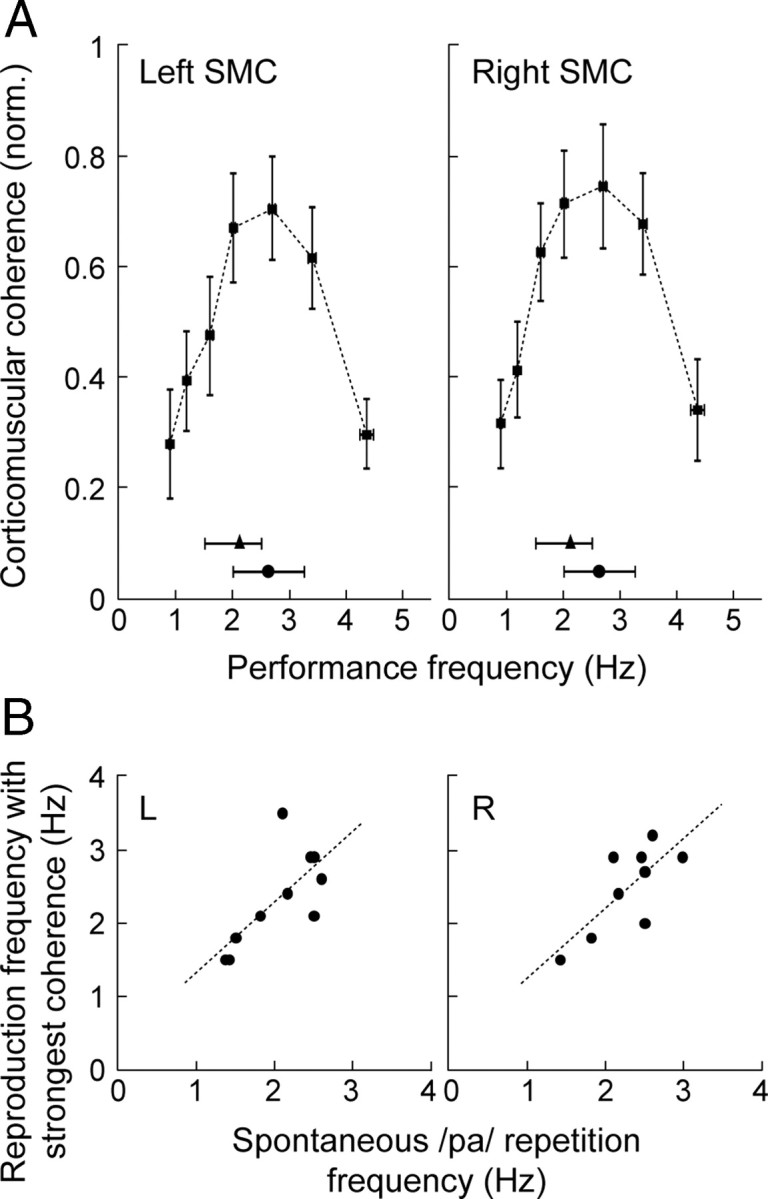
Speech rate and corticomuscular coherence. A, Bell-shaped profile of the normalized peak coherence values (mean ± SEM) for each actual /pa/ reproduction frequency (mean ± SEM) in the left and right SMC (normalized to the individual maximum value across target conditions to lend equal weight to all subjects' data). The horizontal lines below the coherence curves denote the mean rate (with 25 and 75% percentiles) of spontaneous /pa/ repetition (triangles) and the mean frequency of the local rhythmic EMG maxima in overt narration (corresponding to the ∼1.5–3.5 Hz concentration) (circles) (see Fig. 1A). B, Significant positive correlation (Spearman's ρ) between the individual spontaneous /pa/ repetition frequency and the /pa/ reproduction frequency at which the corticomuscular coherence was strongest, plotted for each hemisphere (L, left; R, right).
Discussion
Our present EMG results revealed that articulatory behavior manifests spontaneous rhythmicity at ∼2–3 Hz. The MEG–EMG analysis displayed salient corticomuscular coherence at the articulation rate (fundamental and/or first harmonic) in the mouth SMC bilaterally. The corticomuscular coherence varied as a function of speech rate (∼0.8–5 Hz). The highest coherence occurred in the midrange (∼2–3 Hz) and was tuned to the individual preferred rate of repetitive articulation and aligned with the spontaneous 2–3 Hz rhythmicity of speech.
Behaviorally, these low-frequency speech cycles are well in line with spontaneous rates of limb movements (Frischeisen-Köhler, 1933; MacDougall and Moore, 2005). Overlapping with the preferred rate of /pa/ repetition, oromuscular rhythmicities of spontaneous natural speech were concentrated at ∼2–3 Hz. This range aligns with prosodic frequencies and rate of word production (Allen, 1975; Sallinen-Kuparinen, 1978). Indeed, the individual /pa/ syllables in the rate-controlled experiment were more akin to unisyllabic words than coarticulated syllables. The EMG of natural speech additionally indicated rhythmicity at higher frequencies (∼4–8 Hz), particularly at around the syllabic rate (∼6 Hz) (Sallinen-Kuparinen, 1978). This identification of layers of rhythmicity in natural complex speech, despite the strong 1/f effect, concurs with the multitime resolute or multitiered accounts of spoken language (Greenberg, 2006; Poeppel et al., 2008). These EMG rhythmicities further agree with the 2–7 Hz range of temporal modulation in both kinematic measures of mouth opening and acoustic amplitude envelope of speech (Chandrasekaran et al., 2009). The relationship between neuromuscular activity and periodic acousto-linguistic events in speech warrants further detailed clarification.
The tuning of the mouth SMC–muscle coherence to an individual's spontaneous movement rate is a novel finding, as such, and unprecedented in the context of spoken language. Earlier studies have described hand SMC–muscle coherence for slow finger movements at 7–9 Hz (Gross et al., 2002), auditorily paced finger movements and handwriting at the movement rate (Pollok et al., 2005; Butz et al., 2006), as well as corticokinematic coherence at 4 Hz, the first harmonic of the spontaneous 2 Hz rhythm of hand velocity (Jerbi et al., 2007). However, none of those studies examined the effect of movement rate. The mouth SMC activation level, in hemodynamic brain imaging, increases monotonously with the frequency of articulation (Wildgruber et al., 2001; Riecker et al., 2006). Importantly, the present nonmonotonically varying electrophysiological coherence does not reflect engagement of an isolated brain area but functional connectivity at behaviorally relevant frequencies.
Some degree of coupling between the ventral SMC and mouth muscles is expected because of their close anatomical and functional linkage (Kuypers, 1958; Penfield and Roberts, 1959; Huang et al., 1989). MEG signal reflects mainly dendritic activity of cortical pyramidal cells (Okada et al., 1997). Here, this signal in the SMC was particularly well coordinated with periodic muscle activity at 2–3 Hz. According to concepts of motor control, both feedback signals from the peripheral effectors and brain-mediated predictive and corrective signals related to internal modeling of speech converge on the SMC activity (Guenther et al., 2006; Houde and Nagarajan, 2011). Hence, high corticomuscular coherence may signify a frequency range where the timing of efferent–afferent information flow in the cortex–muscle–cortex loop supports a resonant, energetically low-cost pattern of network activity.
The relatively slow 2–3 Hz cycle can be viewed as a rhythmic frame for more fine-grained control signaling. In line with the communication through coherence hypothesis (Fries, 2005), a high level of coherence could potentiate the SMC for efficient communication with the muscles for fine motor control. Theoretically, the hypothesis of a rhythmic frame approaches the core idea of the frame/content theory of speech production, which hypothesizes that originally feeding-related mandibular alternations grant a frame for speech where each cycle can be modulated to produce a specific syllable, i.e., content (MacNeilage, 1998). The 2–3 Hz range emerging in the present study would endorse a prosodic/word level rather than syllabic frame. Furthermore, these slow oscillations may represent an essentially subcortical template, potentially supported even by brainstem pattern generators (Barlow et al., 2010), on which detailed gestural patterning can be interwoven at the cortical level.
The corticomuscular tuning to 2–3 Hz seems to have no obvious behavioral correlates in normally speaking adults, because articulation is clearly possible also at other rates. Yet a stronger neuromuscular coupling may play a central role in stability of performance (Smith et al., 1995) and individual speech rate differences (Tsao and Weismer, 1997). In motor speech disorders, such as dysarthria and apraxia (Kent, 2000), one might expect an altered tuning of corticomuscular coherence. Neurological disorders that affect speech but not the SMC–muscle system directly are particularly interesting (aphasia, Parkinsonism, ataxic dysarthria) because they can potentially inform about the modulatory influence of other cortical and subcortical/cerebellar sites on the SMC–muscle coherence.
The present study highlights the mouth SMC as an epicenter of the cortical speech representation network, which also includes areas such as the left inferior frontal cortex and supplementary motor cortex (Penfield and Roberts, 1959; Indefrey and Levelt, 2004). Articulation is likely to have an essential role in language function as a whole (Liberman and Whalen, 2000). At the cortical level, functioning of networks involved in language perception has been linked with activity in the 2–6 Hz range (Giraud et al., 2007; Morillon et al., 2010), thus corresponding with the present observations of preferred speech production rates. Future studies should address this intriguing possibility of an oscillatory match between cortical representations of speech production and perception.
In conclusion, our neurobiological finding ties corticomuscular tuning in experimentally well controlled syllable production with the spontaneous rhythmicity of natural speech and underscores the importance of rhythmicity as a frame of spoken language, onto which fine-grained articulatory control may be merged. Thus, at the core of the complex human neurocognition of speech production seems to lie an essentially rhythmic pattern.
Footnotes
This work was supported by the Academy of Finland (National Centres of Excellence Programme 2006–2011; grants to R.S. and T.P.), the Sigrid Jusélius Foundation, the Emil Aaltonen Foundation, the Jenny and Antti Wihuri Foundation, and the Finnish Cultural Foundation.
References
- Allen, 1975.Allen GD. Speech rhythm: its relation to performance universals and articulatory timing. J Phon. 1975;3:75–86. [Google Scholar]
- Barlow et al., 2010.Barlow SM, Lund JP, Estep M, Kolta A. Central pattern generators for orofacial movements and speech. In: Brudzynski SM, editor. Handbook of mammalian vocalization. Oxford: Elsevier; 2010. pp. 351–370. [Google Scholar]
- Butz et al., 2006.Butz M, Timmermann L, Gross J, Pollok B, Dirks M, Hefter H, Schnitzler A. Oscillatory coupling in writing and writer's cramp. J Physiol Paris. 2006;99:14–20. doi: 10.1016/j.jphysparis.2005.06.003. [DOI] [PubMed] [Google Scholar]
- Chandrasekaran et al., 2009.Chandrasekaran C, Trubanova A, Stillittano S, Caplier A, Ghazanfar AA. The natural statistics of audiovisual speech. PLoS Comput Biol. 2009;5:e1000436. doi: 10.1371/journal.pcbi.1000436. [DOI] [PMC free article] [PubMed] [Google Scholar]
- Dolata et al., 2008.Dolata JK, Davis BL, Macneilage PF. Characteristics of the rhythmic organization of vocal babbling: implications for an amodal linguistic rhythm. Infant Behav Dev. 2008;31:422–431. doi: 10.1016/j.infbeh.2007.12.014. [DOI] [PubMed] [Google Scholar]
- Fries, 2005.Fries P. A mechanism for cognitive dynamics: neuronal communication through neuronal coherence. Trends Cogn Sci. 2005;9:474–480. doi: 10.1016/j.tics.2005.08.011. [DOI] [PubMed] [Google Scholar]
- Frischeisen-Köhler, 1933.Frischeisen-Köhler I. The personal tempo and its inheritance. Character Personality. 1933;1:301–313. [Google Scholar]
- Giraud et al., 2007.Giraud AL, Kleinschmidt A, Poeppel D, Lund TE, Frackowiak RS, Laufs H. Endogenous cortical rhythms determine cerebral specialization for speech perception and production. Neuron. 2007;56:1127–1134. doi: 10.1016/j.neuron.2007.09.038. [DOI] [PubMed] [Google Scholar]
- Greenberg, 2006.Greenberg S. A multi-tier framework for understanding spoken language. In: Greenberg S, Ainsworth W, editors. Listening to speech–an auditory perspective. Mahwah, NJ: Erlbaum; 2006. pp. 411–434. [Google Scholar]
- Gross et al., 2001.Gross J, Kujala J, Hämäläinen M, Timmermann L, Schnitzler A, Salmelin R. Dynamic imaging of coherent sources: studying neural interactions in the human brain. Proc Natl Acad Sci U S A. 2001;98:694–699. doi: 10.1073/pnas.98.2.694. [DOI] [PMC free article] [PubMed] [Google Scholar]
- Gross et al., 2002.Gross J, Timmermann L, Kujala J, Dirks M, Schmitz F, Salmelin R, Schnitzler A. The neural basis of intermittent motor control in humans. Proc Natl Acad Sci U S A. 2002;99:2299–22302. doi: 10.1073/pnas.032682099. [DOI] [PMC free article] [PubMed] [Google Scholar]
- Guenther et al., 2006.Guenther FH, Ghosh SS, Tourville JA. Neural modeling and imaging of the cortical interactions underlying syllable production. Brain Lang. 2006;96:280–301. doi: 10.1016/j.bandl.2005.06.001. [DOI] [PMC free article] [PubMed] [Google Scholar]
- Halliday et al., 1995.Halliday DM, Rosenberg JR, Amjad AM, Breeze P, Conway BA, Farmer SF. A framework for the analysis of mixed time series/point process data–theory and application to the study of physiological tremor, single motor unit discharges and electromyograms. Prog Biophys Mol Biol. 1995;64:237–278. doi: 10.1016/s0079-6107(96)00009-0. [DOI] [PubMed] [Google Scholar]
- Houde and Nagarajan, 2011.Houde JF, Nagarajan SS. Speech production as state feedback control. Front Hum Neurosci. 2011;5:82. doi: 10.3389/fnhum.2011.00082. [DOI] [PMC free article] [PubMed] [Google Scholar]
- Huang et al., 1989.Huang CS, Hiraba H, Sessle BJ. Input–output relationships of the primary face motor cortex in the monkey (Macaca fascicularis) J Neurophysiol. 1989;61:350–362. doi: 10.1152/jn.1989.61.2.350. [DOI] [PubMed] [Google Scholar]
- Indefrey and Levelt, 2004.Indefrey P, Levelt WJ. The spatial and temporal signatures of word production components. Cognition. 2004;92:101–144. doi: 10.1016/j.cognition.2002.06.001. [DOI] [PubMed] [Google Scholar]
- Jerbi et al., 2007.Jerbi K, Lachaux JP, N′Diaye K, Pantazis D, Leahy RM, Garnero L, Baillet S. Coherent neural representation of hand speed in humans revealed by MEG imaging. Proc Natl Acad Sci U S A. 2007;104:7676–7681. doi: 10.1073/pnas.0609632104. [DOI] [PMC free article] [PubMed] [Google Scholar]
- Kent, 2000.Kent RD. Research on speech motor control and its disorders: a review and prospective. J Commun Disord. 2000;33:391–427. doi: 10.1016/s0021-9924(00)00023-x. quiz 428. [DOI] [PubMed] [Google Scholar]
- Kuypers, 1958.Kuypers HG. Corticobulbar connections to the pons and lower brainstem in man. Brain. 1958;81:364–388. doi: 10.1093/brain/81.3.364. [DOI] [PubMed] [Google Scholar]
- Liberman and Whalen, 2000.Liberman AM, Whalen DH. On the relation of speech to language. Trends Cogn Sci. 2000;4:187–196. doi: 10.1016/s1364-6613(00)01471-6. [DOI] [PubMed] [Google Scholar]
- MacDougall and Moore, 2005.MacDougall HG, Moore ST. Marching to the beat of the same drummer: the spontaneous tempo of human locomotion. J Appl Physiol. 2005;99:1164–1173. doi: 10.1152/japplphysiol.00138.2005. [DOI] [PubMed] [Google Scholar]
- MacNeilage, 1998.MacNeilage PF. The frame/content theory of evolution of speech production. Behav Brain Sci. 1998;21:499–511. doi: 10.1017/s0140525x98001265. discussion 511–546. [DOI] [PubMed] [Google Scholar]
- MacNeilage and Davis, 2000.MacNeilage PF, Davis BL. On the origin of internal structure of word forms. Science. 2000;288:527–531. doi: 10.1126/science.288.5465.527. [DOI] [PubMed] [Google Scholar]
- Morillon et al., 2010.Morillon B, Lehongre K, Frackowiak RS, Ducorps A, Kleinschmidt A, Poeppel D, Giraud AL. Neurophysiological origin of human brain asymmetry for speech and language. Proc Natl Acad Sci U S A. 2010;107:18688–18693. doi: 10.1073/pnas.1007189107. [DOI] [PMC free article] [PubMed] [Google Scholar]
- Okada et al., 1997.Okada YC, Wu J, Kyuhou S. Genesis of MEG signals in a mammalian CNS structure. Electroencephalogr Clin Neurophysiol. 1997;103:474–485. doi: 10.1016/s0013-4694(97)00043-6. [DOI] [PubMed] [Google Scholar]
- Penfield and Roberts, 1959.Penfield W, Roberts L. Speech and brain mechanisms. Princeton, NJ: Princeton UP; 1959. [Google Scholar]
- Poeppel et al., 2008.Poeppel D, Idsardi WJ, van Wassenhove V. Speech perception at the interface of neurobiology and linguistics. Philos Trans R Soc Lond B Biol Sci. 2008;363:1071–1086. doi: 10.1098/rstb.2007.2160. [DOI] [PMC free article] [PubMed] [Google Scholar]
- Pollok et al., 2005.Pollok B, Gross J, Müller K, Aschersleben G, Schnitzler A. The cerebral oscillatory network associated with auditorily paced finger movements. Neuroimage. 2005;24:646–655. doi: 10.1016/j.neuroimage.2004.10.009. [DOI] [PubMed] [Google Scholar]
- Riecker et al., 2006.Riecker A, Kassubek J, Gröschel K, Grodd W, Ackermann H. The cerebral control of speech tempo: opposite relationship between speaking rate and BOLD signal changes at striatal and cerebellar structures. Neuroimage. 2006;29:46–53. doi: 10.1016/j.neuroimage.2005.03.046. [DOI] [PubMed] [Google Scholar]
- Ruspantini and Chistolini, 2009.Ruspantini I, Chistolini P. Short- and long-term correlations in repetitive movements. Cogn Process. 2009;10(Suppl 2):S290–S293. doi: 10.1007/s10339-009-0318-3. [DOI] [PubMed] [Google Scholar]
- Salenius et al., 1997.Salenius S, Portin K, Kajola M, Salmelin R, Hari R. Cortical control of human motoneuron firing during isometric contraction. J Neurophysiol. 1997;77:3401–3405. doi: 10.1152/jn.1997.77.6.3401. [DOI] [PubMed] [Google Scholar]
- Sallinen-Kuparinen, 1978.Sallinen-Kuparinen A. How does a Finn speak (in Swedish)? In: Gårding E, Bruce G, Bannert R, editors. Nordic prosody. Papers from a symposium. Lund, Sweden: Lund UP; 1978. pp. 255–261. [Google Scholar]
- Schieppati et al., 1989.Schieppati M, Di Francesco G, Nardone A. Patterns of activity of perioral facial muscles during mastication in man. Exp Brain Res. 1989;77:103–112. doi: 10.1007/BF00250572. [DOI] [PubMed] [Google Scholar]
- Schoffelen et al., 2005.Schoffelen JM, Oostenveld R, Fries P. Neuronal coherence as a mechanism of effective corticospinal interaction. Science. 2005;308:111–113. doi: 10.1126/science.1107027. [DOI] [PubMed] [Google Scholar]
- Schormann and Zilles, 1998.Schormann T, Zilles K. Three-dimensional linear and nonlinear transformations: an integration of light microscopical and MRI data. Hum Brain Mapp. 1998;6:339–347. doi: 10.1002/(SICI)1097-0193(1998)6:5/6<339::AID-HBM3>3.0.CO;2-Q. [DOI] [PMC free article] [PubMed] [Google Scholar]
- Smith, 1992.Smith A. The control of orofacial movements in speech. Crit Rev Oral Biol Med. 1992;3:233–267. doi: 10.1177/10454411920030030401. [DOI] [PubMed] [Google Scholar]
- Smith et al., 1995.Smith A, Goffman L, Zelaznik HN, Ying G, McGillem C. Spatiotemporal stability and patterning of speech movement sequences. Exp Brain Res. 1995;104:493–501. doi: 10.1007/BF00231983. [DOI] [PubMed] [Google Scholar]
- Taulu and Simola, 2006.Taulu S, Simola J. Spatiotemporal signal space separation method for rejecting nearby interference in MEG measurements. Phys Med Biol. 2006;51:1759–1768. doi: 10.1088/0031-9155/51/7/008. [DOI] [PubMed] [Google Scholar]
- Terao et al., 2007.Terao Y, Ugawa Y, Yamamoto T, Sakurai Y, Masumoto T, Abe O, Masutani Y, Aoki S, Tsuji S. Primary face motor area as the motor representation of articulation. J Neurol. 2007;254:442–447. doi: 10.1007/s00415-006-0385-7. [DOI] [PubMed] [Google Scholar]
- Tilsen and Johnson, 2008.Tilsen S, Johnson K. Low-frequency Fourier analysis of speech rhythm. J Acoust Soc Am. 2008;124:EL34–EL39. doi: 10.1121/1.2947626. [DOI] [PMC free article] [PubMed] [Google Scholar]
- Tsao and Weismer, 1997.Tsao YC, Weismer G. Interspeaker variation in habitual speaking rate: evidence for a neuromuscular component. J Speech Lang Hear Res. 1997;40:858–866. doi: 10.1044/jslhr.4004.858. [DOI] [PubMed] [Google Scholar]
- Wildgruber et al., 2001.Wildgruber D, Ackermann H, Grodd W. Differential contributions of motor cortex, basal ganglia and cerebellum to speech motor control: effects of syllable repetition rate evaluated by fMRI. Neuroimage. 2001;13:101–109. doi: 10.1006/nimg.2000.0672. [DOI] [PubMed] [Google Scholar]