

Abstract
Transcranial direct current stimulation (tDCS) has been proposed for experimental and therapeutic modulation of regional brain function. Specifically, anodal tDCS of the dorsolateral prefrontal cortex (DLPFC) together with cathodal tDCS of the supraorbital region have been associated with improvement of cognition and mood, and have been suggested for the treatment of several neurological and psychiatric disorders. Although modeled mathematically, the distribution, direction, and extent of tDCS-mediated effects on brain physiology are not well understood. The current study investigates whether tDCS of the human prefrontal cortex modulates resting-state network (RSN) connectivity measured by functional magnetic resonance imaging (fMRI). Thirteen healthy subjects underwent real and sham tDCS in random order on separate days. tDCS was applied for 20 min at 2 mA with the anode positioned over the left DLPFC and the cathode over the right supraorbital region. Patterns of resting-state brain connectivity were assessed before and after tDCS with 3 T fMRI, and changes were analyzed for relevant networks related to the stimulation–electrode localizations. At baseline, four RSNs were detected, corresponding to the default mode network (DMN), the left and right frontal-parietal networks (FPNs) and the self-referential network. After real tDCS and compared with sham tDCS, significant changes of regional brain connectivity were found for the DMN and the FPNs both close to the primary stimulation site and in connected brain regions. These findings show that prefrontal tDCS modulates resting-state functional connectivity in distinct functional networks of the human brain.
Introduction
Transcranial direct current stimulation (tDCS) is a noninvasive stimulation technique of the cerebral cortex by means of a weak constant direct current (DC; usually 1–2 mA) applied to the scalp surface. At the primary motor cortex, anodal tDCS induces excitatory effects, whereas cathodal stimulation results in inhibitory effects on motor cortex excitability (Nitsche and Paulus, 2000; Nitsche et al., 2003). Based on early experimental work investigating DC effects on neuronal activity in animal models, it has been hypothesized that tDCS-mediated effects are related to a shift in neuronal resting membrane potential either toward depolarization and increased spontaneous neuronal firing (anodal tDCS) or toward hyperpolarization and decreased firing (cathodal tDCS) (Bindman et al., 1964).
Numerous studies have investigated the effect of prefrontal cortex tDCS in healthy subjects and patients with neurological or psychiatric disorders. Anodal tDCS of the dorsolateral prefrontal cortex (DLPFC) with the cathode placed over the contralateral supraorbital region has been found to improve performance in several cognitive domains, including executive functions, verbal skills, and memory performance in healthy subjects (Iyer et al., 2005; Wassermann and Grafman, 2005; Cerruti and Schlaug, 2009; Sparing et al., 2008; Dockery et al., 2009; Fiori et al., 2011), as well as in patients with Parkinson's disease and stroke (Boggio et al., 2006; Jo et al., 2009). Promising pilot data suggest a positive therapeutic effect in patients with major depression (Fregni et al., 2006; Boggio et al., 2008; Rigonatti et al., 2008; Ferrucci et al., 2009). Moreover, prefrontal tDCS could influence the emotional-affective domain of the self (Boggio et al., 2009; Karim et al., 2010; Mameli et al., 2010).
Although these studies are encouraging from a clinical point of view, the distribution, direction, and extent of tDCS-mediated effects on brain physiology are not well understood. However, specific hypotheses regarding the neurophysiological action of tDCS seem crucial to further tailor tDCS for experimental and therapeutic applications. Neuroimaging studies using positron emission tomography (PET) (Lang et al., 2005) or functional magnetic resonance imaging (fMRI) have shown widespread (Kwon et al., 2008; Stagg et al., 2009) and subtle (Baudewig et al., 2001) cortical and subcortical changes in regional brain activity following anodal tDCS of the primary motor cortex.
To further investigate the effects of prefrontal tDCS on functional connectivity, we conducted resting-state fMRI measurements, which were subsequently analyzed using independent component analysis (ICA). During, the last decade, an emerging number of resting-state fMRI studies have demonstrated the existence of coherent fluctuations in functionally related regions of the brain (Greicius et al., 2003; Damoiseaux et al., 2006; De Luca et al., 2006; Biswal et al., 2010). We hypothesized that changes of functional connectivity would be detectable in resting-state networks (RSNs) comprising regions within the prefrontal cortex [i.e., the default mode network (DMN), the frontal-parietal network (FPN), and the self-referential network (SRN)], as well as in areas below or close to the stimulation electrodes.
Materials and Methods
Subjects.
After giving their written informed consent, 13 healthy male volunteers (mean age: 27.4 years; age range: 23–32 years) participated in this double-blind, placebo-controlled, and randomized study. All subjects were right-handed (Edinburgh Handedness Inventory) (Oldfield, 1971) and went through a semistructured interview to exclude a history of neurological and psychiatric diseases and the intake of medication affecting the CNS. The study was approved by the local ethics committee (Department of Psychiatry and Psychotherapy, Ludwig Maximilians University Munich, Munich, Germany).
Experimental design.
The study was conducted in a double-blind and placebo-controlled design to guarantee that neither subjects nor researchers were aware of the stimulation condition. The blinding was reversed after all steps of the procedure were completed. All subjects underwent two tDCS sessions (real and sham tDCS) in random order and counterbalanced across subjects on 2 separate days with a 1 week interval between both stimulations (Fig. 1). All tDCS-fMRI sessions were scheduled between 4:00 and 8:00 P.M. The first resting-state fMRI scan was conducted before each tDCS procedure (baseline1′, baseline2′), and another scan was conducted after each tDCS procedure (real tDCS or sham tDCS). The second scan was started immediately after stimulation, and not later than 5 min after stimulation. The time delay between the end of stimulation and the start of the fMRI scan was recorded.
Figure 1.

Experimental protocol. Real and sham tDCS conditions were applied in random order after baseline fMRI scans within a double-blind, crossover design.
Transcranial direct current stimulation.
Bipolar tDCS was administered using two saline-soaked surface sponge electrodes (area = 7 × 5 cm2) and delivered by an Eldith DC stimulator (neuroConn). The anode was placed above F3 (according to the EEG international 10–20 system) corresponding to the left DLPFC, and the cathode was positioned above the contralateral supraorbital region, at least 5 cm from the anode (Miranda et al., 2006). DC stimulation was delivered for a duration of 20 min at 2 mA intensity (15 s ramp in and 15 s ramp out).
For sham tDCS, the Eldith DC stimulator has a built-in placebo mode, which is activated by a code number and includes ramp periods at the beginning and the end of sham stimulation to mimic the somatosensory artifact of real tDCS. Thus, placebo tDCS could be identified neither by the operator who administered tDCS nor by the subjects participating in the trial (Gandiga et al., 2006).
The impedance was controlled by the device throughout each tDCS session, ranging <10 kΩ and limited by the voltage at <26 V. An excess of limits (e.g., an increase of impedance by drying up or chute of the electrodes) would have led to an automatic termination of stimulation.
Functional MRI acquisition.
For resting-state data acquisition, subjects were instructed to keep their eyes closed without falling asleep and try to think of nothing in particular.
Each subject was scanned using a 3.0 T magnetom (VERIO, Siemens). For functional imaging, an EPI sequence with the following parameters was used: repetition time (TR), 3000 ms; echo time (TE), 30 ms; flip angle (FA), 90°; spatial resolution, 3 × 3 × 4 mm3; imaging matrix, 64 × 64; field-of-view (FoV), 192 × 192 mm2; number of slices, 28; number of volumes, 120. Functional images were acquired in axial orientation. For anatomical reference, a high-resolution MPRAGE was performed with the following specifications: FoV, 256 × 240 mm2; spatial resolution, 1 × 1 × 1 mm3; TR, 14 ms; TE, 7.61 ms; FA, 20°; number of slices, 160.
Functional MRI analysis.
All image data analyses were performed using FSL 4.16 (http://www.fmrib.ox.ac.uk/fsl/index.html). Individual high-resolution T1-weightened images were processed using AFNI (Analyses of Functional Images, http://afni.nimh.nih.gov/afni). The first five functional scans of each session were discarded to account for T1 effects.
We used the FEAT (FMRI Expert Analysis Tool) analysis tool box, version 5.98 (Smith et al., 2004) for the preprocessing of fMRI resting-state data. Head motion correction was done using MCFLIRT [Motion Correction using the FMRIB (Oxford Centre for Functional MRI of the Brain) Linear Image Registration Tool] (Jenkinson et al., 2002). The skull was removed using BET (Brain Extraction Tool) (Smith, 2002) followed by spatial smoothing using a 5 mm FWHM Gaussian kernel with high-pass temporal filtering (Gaussian-weighted, least-squares, straight-line fitting with σ = 50 s). Registration to the individual high-resolution T1-weighted images, and afterward to the MNI-152 standard space template, was performed using FLIRT, version 5.5 (Jenkinson et al., 2002). The preprocessed four-dimensional (4D) datasets were resampled to 2 mm isotropic voxels in the following group analyses.
Independent component analysis.
ICA was performed on all resting-state runs using the MELODIC (Multivariate Exploratory Linear Optimized Decomposition) routine, version 3.10, implemented in FSL (Beckmann and Smith, 2004). Decomposition into different functional networks was performed automatically by a dimensionality estimation of the MELODIC 3.10 tool.
Since spontaneous resting-state connectivity measured by BOLD fMRI may comprise ultraslow frequencies (Greicius et al., 2003; Fox et al., 2005; Damoiseaux et al., 2006; Vincent et al., 2007; Boly et al., 2008; Horovitz et al., 2009; Miller et al., 2009), only independent components with signals in the range of 0.01–0.1 were included. Higher-frequency signals with respiratory (0.1–0.5 Hz) or cardiovascular (0.6–1.2 Hz) origin were excluded (Cordes et al., 2000, 2001; van de Ven et al., 2004; De Martino et al., 2007).
Resting-state datasets of all subjects and experimental conditions (baseline1, baseline2, after real tDCS and after sham tDCS) were concatenated in time to create a single 4D dataset. After ICA decomposition of these datasets, we chose four resting-state networks, which are known to involve brain regions within the prefrontal cortex close to tDCS electrode sites: the DMN, the left FPN, the right FPN and the SRN. An average z-score of 2.3 < z < 10 was defined as the threshold for the resulting statistical group maps. The alternative was that the resulting statistical group maps were thresholded at z < 2.3.
Group-level analyses.
A validated dual-regression approach was used (Filippini et al., 2009; Biswal et al., 2010; Zuo et al., 2010). The dual-regression approach summons several processing steps starting with a temporal concatenation of all time series into a single 4D time series file. Another process includes the registration of all individual time series with regard to the estimated group RSNs using spatial regression against the individual datasets. Additionally, the temporal dynamics at the subject level were regressed against the primary data.
In a hypothesis-driven approach, we analyzed (1) the effects restricted to the RSN templates to specifically measure the effects of tDCS on RSN connectivity, and (2) the effects below both stimulation electrodes to measure local effects at primary stimulation sites. The respective masks are shown in Figure 2. In an additional exploratory approach, the four RSNs were analyzed against fluctuations in the entire brain.
Figure 2.

Study-specific masks. A, RSN masks were created using the group average ICA of all subjects including all conditions. B, Electrode position masks were defined according to EEG positions F3 (anode) and Fp2 (cathode) of the international 10–20 electrode system. A representative T1 image projected on the MNI-T1 Colin 1 mm template (Holmes et al., 1998) from one of the subjects illustrates the localization of the stimulation electrodes.
The chosen RSNs were thresholded at p < 0.01 (z = 2.32). The areas below the tDCS electrodes were defined as regions of interest (ROIs) using EEG positions F3 (anode) and Fp2 (cathode) of the international 10–20 electrode system. Conversions from these coordinates to MNI coordinates were drawn from the center of the stimulation electrodes (MNI coordinates for F3: x = −34, y = 26, z = 44; for Fp2: x = 29, y = 84, z = −10) according to the 10–20 electrode system on the closest MNI cortical standard space using the Münster T2T-Converter (O. Steinsträter, J. Sommer, M. Deppe, S. Knecht, unpublished observations; http://wwwneuro03.uni-muenster.de/ger/t2tconv/) and then converted to a binary form. The electrode ROIs were positioned for each subject separately with a cube width of 35 mm horizontal (anode) or vertical (cathode) using MANGO (Multi-Image Analysis GUI) software (http://ric.uthscsa.edu/mango/mango.html). Areas outside the cortex were rejected individually (Fig. 2B).
Masks of the RSNs and the theoretically chosen area below the anode and the cathode electrodes were created for each subject and all four conditions separately. The average MNI coordinates for F3 were comparable to that used by Miranda et al. (2006), with the difference that we used an electrode size of 35 cm2 and not 25 cm2.
The resulting seed time courses for each region and subject were generated by averaging the signal within the ROIs. This was done for each time course and for all conditions. To include only gray matter within the ROIs, we removed possible nuisance confounders: six different motion parameters, white matter, the CSF signals, and the global signal based on the approach of Biswal et al. (2010).
Each subject's maps of the four RSNs were combined to a single 4D dataset for each network, and dual regression was performed for each of the 4 RSNs separately.
The following contrasts were calculated: (real > baseline1) > (sham > baseline2); (real > baseline1) < (sham > baseline2); real > baseline1; real < baseline1; sham > baseline2; sham < baseline2; and baseline1 > baseline2. We applied a statistical threshold with family-wise error rate (threshold-free cluster enhancement) corrected for multiple comparisons (Smith and Nichols, 2009) of p values <0.05 with a cluster extent of >20 voxels. We report only the contrasts (real > baseline1) > (sham > baseline2), (real > baseline1) < (sham > baseline2), real > baseline1, real < baseline1 for the whole-brain analysis approach descriptively (see Table 3).
Table 3.
Exploratory tDCS effects on RSNs: significant clusters for the contrast real tDCS > baseline1
| Contrast/network | Brain area | Brodmann's area | Number of voxels | MNI coordinates |
||
|---|---|---|---|---|---|---|
| x | y | z | ||||
| Real tDCS > baseline1 | ||||||
| RSNc1/default mode | L superior frontal gyrus | 8 | 392 | −24 | 30 | 44 |
| Posterior cingulate gyrus | 23 | 370 | 0 | −54 | 21 | |
| L middle temporal gyrus | 21 | 337 | −62 | −24 | −14 | |
| R middle temporal gyrus | 21 | 289 | 68 | −14 | −14 | |
| L medial frontal gyrus/anterior cingulate | 10/32 | 201 | −6 | 56 | −10 | |
| L parahippocampal gyrus | 35 | 137 | −20 | −26 | −14 | |
| RSNc2/Left frontal-parietal | R precuneus | 7 | 271 | 24 | −62 | 54 |
| L inferior frontal gyrus | 10 | 219 | −42 | 42 | 8 | |
| L middle frontal gyrus | 8 | 214 | −22 | 28 | 38 | |
| R posterior cingulate | 31 | 130 | 16 | −22 | 40 | |
| L lingual gyrus | 19 | 110 | −20 | −70 | 4 | |
| L inferior parietal lobule | 40 | 97 | −60 | −34 | 28 | |
| R superior parietal lobule | 7 | 67 | 34 | −60 | 64 | |
| RSNc4/self-referential | L precentral/postcentral | 3/4 | ||||
| Gyrus/superior parietal lobule | 5/7 | 768 | −16 | −20 | 72 | |
| L superior temporal gyrus | 22 | 695 | −68 | −14 | 2 | |
| L superior temporal gyrus | 38 | 512 | −26 | 16 | −40 | |
| L lingual gyrus | 19 | 297 | −28 | −64 | 2 | |
| R parahippocampal gyrus | 30 | 169 | 28 | −54 | 4 | |
| L precuneus/supramarginal gyrus | 7/40 | 133 | −20 | −50 | 38 | |
| L cerebellum culmen | 95 | −34 | −60 | −22 | ||
| L insula | 13 | 45 | −36 | −28 | 22 | |
| R middle temporal gyrus | 21 | 35 | 70 | −12 | −10 | |
| L subgenual gyrus | 25 | 30 | −14 | 12 | −24 | |
Resting-state network contrast (RSNc) 1 corresponds to the contrast on the DMN, RSNc 2 to the contrast on the left FPN, RSNc 3 to the contrast on the right FPN, and RSNc 4 corresponds to the contrast of the self-referential network. Results are based on a whole-brain dual-regression approach and presented uncorrected with a p < 0.001 (cluster size, >20 voxels).
The dual-regression analysis produces z-score maps representing connectivity within the four RSNs. We used Randomize 2.6 (permutation-based nonparametric inference) to determine the voxelwise nonparametric statistical contrasts (with 5000 permutations) (Nichols and Holmes, 2002) between the conditions for the four selected networks. Due to the exploratory character of the second analysis, effects were considered significant at a level of puncorrected < 0.001 with a cluster extent of >20 voxels.
Results
Overall, neither side effects nor any relevant discomfort were observed during the experiment, and tDCS was generally well tolerated. Moreover, subjects were not able to guess whether they had received real or sham tDCS.
Detection of resting-state networks
Four RSNs relevant for higher cognition were identified using group clustering of subjects resting-state fMRI data before stimulation: the first network (RSN1) was consistent with the DMN and comprised the posterior cingulate cortex/precuneus [Brodmann's area (BA) 23/31], the middle/superior temporal gyrus bilaterally (BA 31/39), the superior frontal gyrus bilaterally (BA 8/9), and the ventromedial prefrontal cortex bilaterally (BA 10/11). A second network (RSN2) was identified as the left FPN, consisting of the left middle (BA 8/9/10/46) and the left superior parietal lobule (BA 7/40). A third network (RSN3) comprised the right superior frontal gyrus/middle frontal gyrus (BA 8/9/10/46) and the right inferior parietal lobule (BA 7/40) (right FPN). The fourth network (RSN4) included the anterior cingulate (BA 24/32) and the subgenual gyrus (BA 25), and was consistent with the SRN.
Activation patterns of the four different functional networks are shown in Figure 3.
Figure 3.
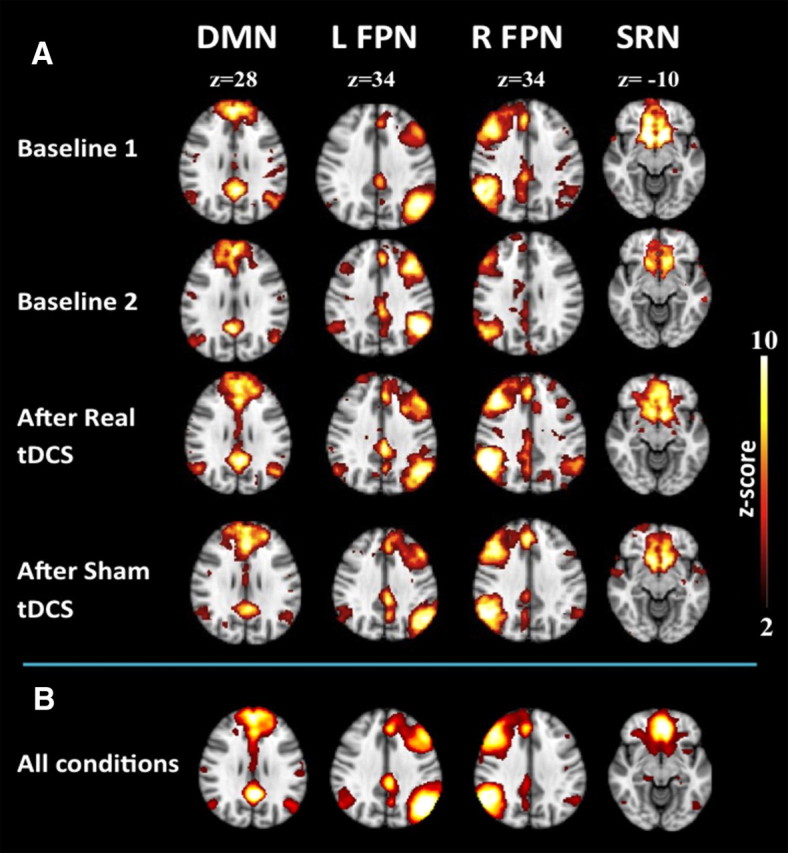
Group analysis of RSN time series. Group analysis of resting-state time series of the 13 subjects revealed four resting-state networks. A, The DMN, left FPN (L FPN), right FPN (R FPN), and SRN are shown before real tDCS, after real tDCS, and after sham tDCS, respectively. B, Group ICA RSNs derived from resting-state scans of all individuals during all conditions. Group analyses of RSN time series are shown for the conditions baseline1, baseline2, after real tDCS, and after sham tDCS.
Effects of tDCS on functional connectivity
Within the ROI templates for different RSNs, neither a significant difference between baseline scans nor any significant effect of sham tDCS compared with baseline was observed. Significant effects were identified for real > baseline1 and (real > baseline1) > (sham > baseline2) comparisons within RSN1 (DMN), RSN2 (left FPN), and RSN3 (right FPN), whereas no significant differences were found for RSN 4 (SRN). Detailed results are shown in Figure 4 and Table 1.
Figure 4.
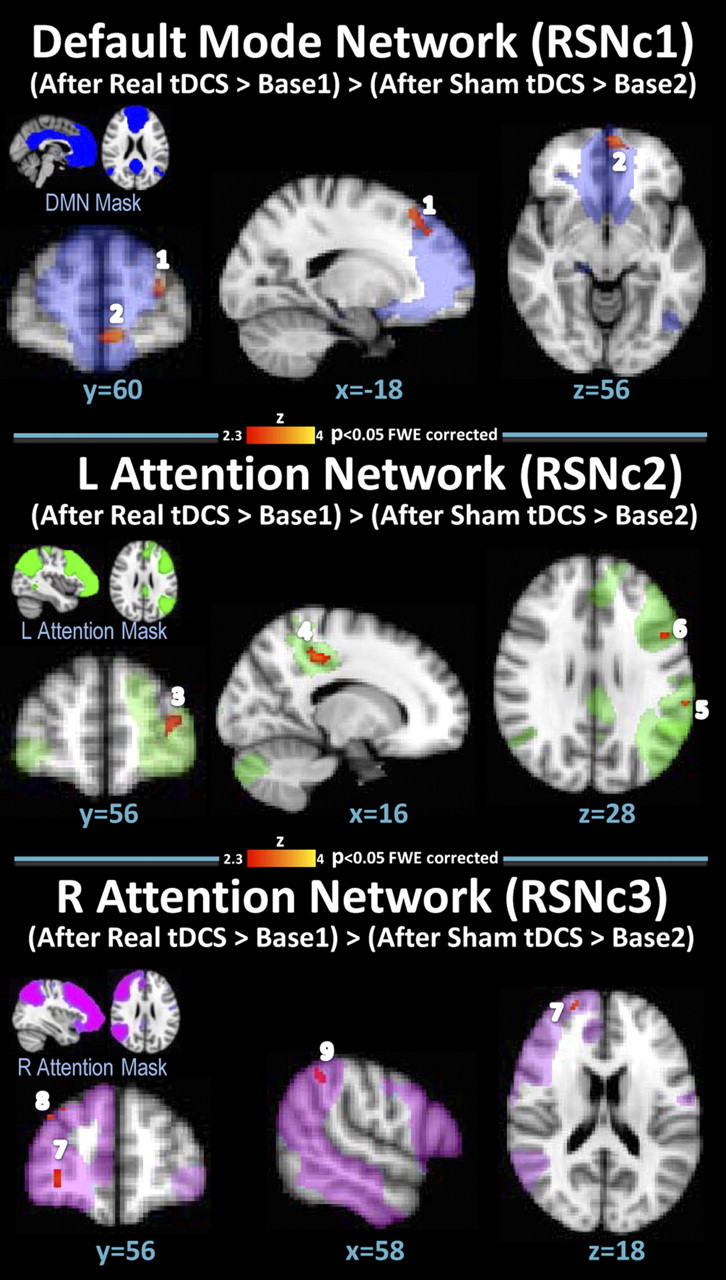
Effects of tDCS on connectivity. Connectivity differences within the RSNs (RSNc 1–3) for the contrasts (after real tDCS > baseline1) > (after sham tDCS > baseline2). Results are cluster corrected for familywise errors (p < 0.05). Resting-state network contrast (RSNc) 1 corresponds to the contrast in the DMN, RSNc 2 corresponds to the contrast in the left FPN, and RSNc 3 corresponds to the contrast in the right FPN (radiological convention). Numbers correspond to the clusters presented in Table 1.
Table 1.
Significant differences within the RSN-based masks
| Contrast/network | Cluster | Brain area | Brodmann's area | Number of voxels | MNI coordinates |
||
|---|---|---|---|---|---|---|---|
| x | y | z | |||||
| (Real > baseline1) > (sham > baseline2), p < 0.05 FWE corrected | |||||||
| RSNc1/default mode | 1 | L superior frontal gyrus | 6/8 | 81 | −22 | 32 | 44 |
| 2 | L superior frontal gyrus/L anterior cingulate | 10/32 | 62 | −6 | 54 | −8 | |
| RSNc2/left frontal-parietal | 3 | L superior frontal gyrus | 10 | 91 | −30 | 56 | 8 |
| 4 | R posterior cingulate gyrus | 31 | 85 | 16 | −26 | 40 | |
| 5 | L inferior parietal lobule | 40 | 56 | −62 | −34 | 30 | |
| 6 | L inferior frontal gyrus | 9/45 | 49 | −52 | 14 | 28 | |
| RSNc3/right frontal-parietal | 7 | R superior frontal gyrus | 10 | 189 | 28 | 56 | −2 |
| 8 | R middle frontal gyrus/R superior frontal gyrus | 8/9 | 103 | 34 | 46 | 36 | |
| 9 | R inferior parietal lobule | 40 | 42 | 58 | −48 | 48 | |
| Real tDCS > Baseline 1, p < 0.05 FWE corrected | |||||||
| RSNc1/default mode | 1 | L superior frontal gyrus | 8 | 104 | −22 | 36 | 46 |
| 2 | L medial frontal gyrus/L anterior cingulate | 10/32 | 61 | −6 | 62 | −8 | |
| RSNc2/left frontal-parietal | 3 | L inferior frontal gyrus/L middle frontal gyrus | 10 | 95 | −40 | 42 | 8 |
| 4 | L middle frontal gyrus | 8 | 82 | −24 | 30 | 40 | |
| 5 | R posterior cingulate | 31 | 49 | 18 | −26 | 40 | |
| 6 | L inferior parietal lobule | 40 | 33 | −54 | −36 | 44 | |
| RSNc3/right | 7 | R medial frontal gyrus | 10 | 139 | 20 | 52 | 2 |
| 8 | R superior frontal gyrus | 9 | 63 | 28 | 60 | 28 | |
| 9 | R superior parietal lobule | 7 | 54 | 44 | −54 | 58 | |
Results are cluster corrected for familywise errors (p < 0.05) with a cluster size of >20 voxels. Significant clusters are shown for the contrast (real tDCS > baseline1) > (sham > baseline 2) and real tDCS > baseline1 for each of the four networks. Resting-state network contrast (RSNc) 1 corresponds to the contrast of the DMN, RSNc 2 corresponds to the contrast of the left FPN, and RSNc 3 corresponds to the contrast on the right FPN. Results are cluster corrected for familywise errors (p < 0.05) with a cluster size of >20 voxels. Numbers correspond to clusters shown in Figure 4.
When exploring the local effects of tDCS that were dependent on the electrode positions, an increased coactivation outside RSN 1 (DMN), but within the anode ROI, was observed in the left middle frontal gyrus (x = −20, y = 22, z = 56; BA 6; 32 voxels). Increased coactivations were also observed outside the FPN masks in the left superior frontal gyrus (outside the left FPN mask: x = −30, y = 52, z = 28; BA 9; 25 voxels) and the left middle frontal gyrus (outside the right FPN mask: x = −38, y = 48, z = 18; BA 10; 31 voxels).
In addition to the hypothesis-driven ROI analyses, whole-brain dual-regression analysis showed significant effects for the comparison (real > baseline1) > (sham > baseline2) in all four RSNs at an uncorrected p < 0.001 (cluster size, >20 voxels). These findings are presented in Table 2 and Figure 5. The results for the comparison real tDCS > baseline1 are shown in Table 3.
Table 2.
Exploratory tDCS effects on RSNs: significant clusters for the contrast (real tDCS > baseline1) > (sham > baseline 2) and (real tDCS > baseline1) < (sham > baseline2) for each of the four networks
| Contrast/network | Cluster | Brain area | Brodmann's area | Number of voxels | MNI coordinates |
||
|---|---|---|---|---|---|---|---|
| x | y | z | |||||
| (Real tDCS > baseline 1) > (sham tDCS > baseline2) | |||||||
| RSNc1/default mode | 1 | R inferior parietal lobule | 40 | 277 | 64 | −28 | 44 |
| 1 | Postcentral gyrus | 3 | |||||
| x | R middle frontal gyrus | 11 | 84 | 28 | 26 | −24 | |
| 2 | R anterior cingulate | 32 | 77 | 4 | 48 | −12 | |
| 3 | L superior frontal gyrus | 8 | 61 | −32 | 26 | 48 | |
| 4 | R superior frontal gyrus | 8 | 54 | 6 | 50 | 42 | |
| 5 | L precuneus/L posterior | 7/31 | 52 | −2 | −60 | 38 | |
| 6 | R middle frontal gyrus | 8 | 41 | 50 | 14 | 42 | |
| 7 | L middle frontal gyrus | 8 | 40 | −48 | 20 | 40 | |
| 8 | L superior frontal gyrus | 9 | 33 | −18 | 52 | 28 | |
| 9 | R superior frontal gyrus | 8 | 27 | 26 | 40 | 46 | |
| 10 | R superior frontal gyrus | 8 | 25 | 38 | 32 | 48 | |
| (Real tDCS > baseline1) < (sham tDCS > baseline2) | 11 | Posterior cingulate | 23 | 114 | 0 | −54 | 20 |
| x | L superior temporal gyrus | 21 | 105 | −40 | −6 | −36 | |
| 12 | L superior frontal gyrus | 6 | 85 | −24 | 26 | 58 | |
| 13 | R superior frontal gyrus | 6 | 68 | 20 | 20 | 54 | |
| 14 | L middle frontal gyrus | 6 | 52 | −34 | 10 | 60 | |
| 15 | Brainstem | 38 | 0 | −20 | −14 | ||
| RSNc2/left frontal-parietal | 1 | L inferior frontal gyrus | 46/10 | 206 | −42 | 48 | 0 |
| 2 | L parahippocampal gyrus | 30 | 163 | −12 | −40 | −2 | |
| 3 | L posterior cingulate | 29 | 162 | −12 | −44 | 10 | |
| 4 | L brainstem | 159 | −2 | −12 | −12 | ||
| x | R posterior cingulate gyrus | 31 | 158 | 6 | −30 | 38 | |
| 5 | R middle frontal gyrus | 10 | 52 | 40 | 42 | 4 | |
| 6 | R middle frontal gyrus | 8 | 37 | 38 | 44 | 36 | |
| 7 | L inferior frontal gyrus | 44 | 32 | −50 | 18 | 10 | |
| 8 | R inferior parietal lobule | 40 | 31 | 54 | −54 | 48 | |
| 9 | R precentral gyrus | 44 | 24 | 56 | 16 | 4 | |
| RSNc3/right frontal-parietal | 1 | R middle frontal gyrusa | 8/9 | 444 | 38 | 44 | 36 |
| 2 | L middle frontal gyrus | 9 | 327 | −44 | 38 | 34 | |
| 3 | R superior parietal lobule | 7 | 191 | 44 | −60 | 58 | |
| 4 | R precentral gyrus | 44 | 184 | 56 | 12 | 4 | |
| 5 | R middle frontal gyrus | 10 | 96 | 42 | 44 | 8 | |
| 6 | R middle frontal gyrus | 9/10 | 75 | 38 | 48 | 24 | |
| 7 | R superior frontal gyrusa | 10 | 57 | 16 | 68 | 8 | |
| 8 | R inferior frontal gyrus | 11 | 53 | 28 | 26 | −24 | |
| 9 | R superior frontal gyrus | 9 | 27 | 26 | 60 | 26 | |
| RSNc4/self-referential | 1 | L hippocampus/L parahippocampal gyrus | 19 | 228 | −30 | −48 | −4 |
| 2 | R hippocampus/R parahippocampal gyrus | 19 | 218 | 36 | −42 | −4 | |
| 3 | L cerebellum culmen | 217 | −12 | −32 | −20 | ||
| 4 | L uncus | 28 | 186 | −28 | 4 | −28 | |
| 5 | L brainstem/thalamus | 117 | −2 | −6 | −4 | ||
| 6 | L superior temporal gyrus | 28 | −40 | 14 | −22 | ||
Resting-state network contrast (RSNc) 1 corresponds to the contrast on the DMN, RSNc 2 to the contrast on the left FPN and RSNc 3 to the contrast on the right FPN, RSNc 4 corresponds to the contrast of the self referential network. Results are based on a whole brain dual regression approach and presented uncorrected with a p < 0.001 (cluster size >20 voxels). Numbers correspond to clusters in Figure 5. x = Clusters are not shown in Figure 5.
aConnected within one cluster.
Figure 5.

Exploratory analysis of whole-brain tDCS effects. RSN contrasts resulting from the contrast baseline1 > baseline2, real tDCS > baseline12, sham tDCS > baseline12, (after real > before real) > (after sham > before sham), and inverse contrasts for each of the four networks detected after stimulation [resting-state network contrast (RSNc) 1 corresponds to the contrast on the DMN, RSNc 2 to the contrast on the left FPN, RSNc 3 to the contrast on the right FPN, and RSNc4 to the contrast of the SRN]. Numbers correspond to the clusters presented in Table 2. Red color scales represent functional correlation for the contrast (after real tDCS > baseline1) > (after sham tDCS > baseline2), and blue color represents functional correlation for the contrast after real tDCS > baseline1 < (after sham tDCS > baseline2). Radiological convention: p < 0.001 (uncorrected); cluster size, >20 voxels.
Discussion
Combining prefrontal tDCS and resting-state fMRI, this study shows that prefrontal tDCS modulates large-scale patterns of resting-state connectivity in the human brain by inducing changes of functional connectivity close to anode and cathode stimulation sites, but also in distant brain regions. These effects were detectable in three resting-state networks (i.e., the DMN as well as the left and right FPN), involving brain regions of higher cognitive functions (Raichle and Gusnard, 2002; Greicius et al., 2003; Damoiseaux et al., 2006; Laufs, 2008; van den Heuvel et al., 2009). Moreover, resting-state fMRI revealed increased coactivations between different frontal brain regions close to or between both tDCS electrodes.
Effects of tDCS on RSNs
Our results suggest that prefrontal tDCS influences coactivation in frontal parts of the DMN, parts of the left frontal-parietal network and the right posterior cingulated cortex (PCC), as well as parts of the right frontal-parietal network. The DMN is thought to reflect an intrinsic state associated with alertness and self-related processes, whereas goal-directed extrinsic cognitive tasks suspend this network (Gusnard et al., 2001; Raichle et al., 2001). The neuronal basis of the DMN has been established using electrocorticographic recordings (He et al., 2008; Miller et al., 2009), and highly reproducible multicenter consistency has been shown for the DMN (Biswal et al., 2010). The DMN has been hypothesized to be involved in cognitive functions associated with intrinsic processing and external inputs (Hampson et al., 2006; Schilbach et al., 2008; Wirth et al., 2011). Although deactivation of DMN components has been reported, some studies show the opposite—a strengthening of DMN components, accompanied by improved working memory (Hampson et al., 2006) or semantic memory performance (Wirth et al., 2011).
Analysis of the left FPN revealed increased coactivations between regions within the frontal lobe, the parietal lobule, and the posterior cingulate gyrus. These frontoparietal coactivations may be localized in well known projections between the DLPFC, the cingulate cortex, and the parietal lobe (Hagmann et al., 2008; van den Heuvel et al., 2008; Bohland et al., 2009; Greicius et al., 2009). Therefore, it could be hypothesized that frontal tDCS increases connectivity within these pathways, which are also part of the so-called attention network (Laufs et al., 2003; Greicius and Menon, 2004; Fox et al., 2005; Fransson, 2005; van de Ven et al., 2008). Functionally, an increased coactivation of frontal and parietal regions has been related to top-down modulation of attention and working memory (Corbetta and Shulman, 2002). Several studies show an increased activation of left or right frontal-parietal components during cognitive engagement and correct task performance (D'Esposito et al., 1995; Braver et al., 1997; He et al., 2007; Kelly et al., 2008; Volle et al., 2008). The left frontal-parietal network appears to be particularly essential for cognitive functioning as shown by lesion studies (Turken et al., 2008), and increased connectivity within this network has been demonstrated after cognitive training (Lewis et al., 2009; Mazoyer et al., 2009).
Since tDCS led to increased coactivation within parts of the DMN and FPN bilaterally, we hypothesize that tDCS may enhance the state of alertness and therefore impact alertness-dependent cognitive functions. So far, there is growing evidence that the integrity and strength of spontaneous functional connectivity in several networks are of behavioral and cognitive relevance (Massimini et al., 2005; Hampson et al., 2006; He et al., 2007; Schacter et al., 2007; Kelly et al., 2008; Schilbach et al., 2008; Lewis et al., 2009; Ferrarelli et al., 2010; Wirth et al., 2011). Thus, our findings may explain why a wide range of cognitive domains has already been successfully modulated by prefrontal tDCS (Wassermann and Grafman, 2005; Sparing et al., 2008; Cerruti and Schlaug, 2009; Dockery et al., 2009; Elmer et al., 2009; Fertonani et al., 2010; Hecht et al., 2010; Ambrus et al., 2011; Fiori et al., 2011). Within this range of cognitive domains, we have recently shown that prefrontal tDCS using similar stimulation parameters as in the current study, led to an improvement of working memory performance (n-back) associated with changes in EEG activity patterns (Keeser et al., 2011).
Effects of tDCS in models and imaging studies
To predict the distribution of the electric field induced by tDCS in the brain, various electrode positions have been mathematically modeled (Miranda et al., 2006, 2009; Wagner et al., 2007). Using a standard spherical head model together with different bipolar electrode montages at 2 mA stimulation intensity (electrode size 25 cm2), cortical current densities of ∼0.01 mA/cm2 were calculated (Miranda et al., 2006). However, Wagner et al. (2007) found current density maxima between 0.77 and 2 mA/cm2 for different electrode montage using 1 mA tDCS on a realistic MRI-derived finite-element model. Thus, previous models resulted in a considerable range of assumed induced peak current densities and showed a nonfocal electric field close to the electrode positions (Miranda et al., 2006; Wagner et al., 2007). In addition to analyzing tDCS effects on resting-state networks, we therefore also applied electrode-specific masks and detected stimulation effects localized close to the cathode, but outside the RSNs. However, the functional relevance of these effects within other distinct networks remains to be clarified. The same is true for the multiple effects in more distant regions revealed by an exploratory whole-brain analysis (uncorrected p < 0.001; cluster size, >20 voxels). We present also these data for further comparison with the results of future studies, but withhold a detailed discussion as these data may contain a considerable number of false-positive results.
To our knowledge, there has only been one functional neuroimaging study published so far focusing on prefrontal tDCS. Merzagora et al. (2010) used functional near-infrared spectroscopy (fNIRS) for investigating the effects of bilateral prefrontal tDCS (1 mA for 10 ms; anode, lateral to Fp1; cathode, lateral to Fp2). They observed a local increase of the concentration of oxyhemoglobin, relatively focal and close to the anode. Our results corroborate and extend this finding by demonstrating tDCS-specific effects on different RSNs, where fNIRS is methodologically limited. However, the majority of previous combined tDCS and functional neuroimaging studies have focused on motor cortex stimulation, also including motor activation paradigms. Most studies found fMRI signal changes close to the stimulation site and in distant regions (Kwon et al., 2008; Jang et al., 2009; Stagg et al., 2009). Lang et al. (2005) used H215O PET and observed an increased regional cerebral blood flow (rCBF) in widespread cortical and subcortical areas that reached the magnitude of effects of finger movement on rCBF in motor areas and were stable for ∼50 min. To further elucidate the network-specific effects of motor cortex tDCS, Polanía et al. (2011) used resting-state fMRI combined with a graph theory approach instead of ICA. They found a decrease in the average number of direct functional connections from the left somatomotor cortex (SM) to topologically distant gray matter regions accompanied by an increase in functional connectivity between SM and the left premotor, motor, and left parietal cortex. In addition, nodal functional connectivity increased in the left PCC and the right DLPFC. Thus, these results suggest a network-specific enhancement of connectivity following motor cortex tDCS and parallel our findings for prefrontal tDCS. Future studies are needed to differentiate these effects in terms of their functional relevance.
Limitations
One limiting factor of the current study is that small sample size may have reduced statistical power. Another factor limiting the interpretation of our findings is the principle difficulty in separating the effects of anodal versus cathodal stimulation for tDCS. Even in experimental designs where different electrode positions are compared, each combination of anode-cathode positions can be regarded as a different bipolar tDCS modality. Also, physical models show that the electric field generated by tDCS is probably distributed throughout the brain (Wagner et al., 2007; Oostendorp et al., 2008; Miranda et al., 2009; Sadleir et al., 2010; Suh et al., 2010). Thus, our findings may just be valid for the specific set of parameters and electrode positions applied in the current study.
A third limitation of our study may be that we did not include a behavioral task to probe the functional relevance of our findings. Further studies are necessary to clarify this issue, and thus the relation between RSN connectivity and cognitive functions discussed above may be regarded as speculative.
Conclusion
In conclusion, our results support the hypothesis that prefrontal tDCS alters the level of neural excitability. We propose that the findings of an augmented connectivity within different RSNs after prefrontal tDCS reflect increased resources and a higher readiness to facilitate cognitive performance. Indeed, there is an increasing body of evidence that prefrontal tDCS acts on different cognitive domains and is clinically effective in several neuropsychiatric disorders. Therefore, resting-state fMRI could become a valuable tool to explore the effects of tDCS on these disorders and may help to tailor the tDCS procedure to individual needs. However, additional studies are necessary to replicate our findings and further specify their relationship to short- and long-term neurocognitive functioning in healthy and patient groups.
Footnotes
This study was financially supported by Aspect Medical Systems Inc. (Norwood, MA). Neuroconn GmbH (Ilmenau, Germany) has provided DC stimulators for rent. This study is part of the PhD thesis of Daniel Keeser at the Faculty of Medicine of the Ludwig-Maximilians University of Munich (in preparation). Moreover, we gratefully acknowledge F. Esposito for his invaluable advice; and thank M. Hartmann, D. Maxwell, H.J. Engelbregt, and D. Todder for critically reading the manuscript.
References
- Ambrus GG, Zimmer M, Kincses ZT, Harza I, Kovács G, Paulus W, Antal A. The enhancement of cortical excitability over the DLPFC before and during training impairs categorization in the prototype distortion task. Neuropsychologia. 2011;49:1974–1980. doi: 10.1016/j.neuropsychologia.2011.03.026. [DOI] [PubMed] [Google Scholar]
- Baudewig J, Nitsche MA, Paulus W, Frahm J. Regional modulation of BOLD MRI responses to human sensorimotor activation by transcranial direct current stimulation. Magn Reson Med. 2001;45:196–201. doi: 10.1002/1522-2594(200102)45:2<196::aid-mrm1026>3.0.co;2-1. [DOI] [PubMed] [Google Scholar]
- Beckmann CF, Smith SM. Probabilistic independent component analysis for functional magnetic resonance imaging. IEEE Trans Med Imaging. 2004;23:137–152. doi: 10.1109/TMI.2003.822821. [DOI] [PubMed] [Google Scholar]
- Bindman LJ, Lippold OC, Redfearn JW. The Action of Brief Polarizing Currents on the Cerebral Cortex of the Rat (1) During Current Flow and (2) in the Production of Long-Lasting after-Effects. J Physiol. 1964;172:369–382. doi: 10.1113/jphysiol.1964.sp007425. [DOI] [PMC free article] [PubMed] [Google Scholar]
- Biswal BB, Mennes M, Zuo XN, Gohel S, Kelly C, Smith SM, Beckmann CF, Adelstein JS, Buckner RL, Colcombe S, Dogonowski AM, Ernst M, Fair D, Hampson M, Hoptman MJ, Hyde JS, Kiviniemi VJ, Kotter R, Li SJ, Lin CP, et al. Toward discovery science of human brain function. Proc Natl Acad Sci U S A. 2010;107:4734–4739. doi: 10.1073/pnas.0911855107. [DOI] [PMC free article] [PubMed] [Google Scholar]
- Boggio PS, Ferrucci R, Rigonatti SP, Covre P, Nitsche M, Pascual-Leone A, Fregni F. Effects of transcranial direct current stimulation on working memory in patients with Parkinson's disease. J Neurol Sci. 2006;249:31–38. doi: 10.1016/j.jns.2006.05.062. [DOI] [PubMed] [Google Scholar]
- Boggio PS, Rigonatti SP, Ribeiro RB, Myczkowski ML, Nitsche MA, Pascual-Leone A, Fregni F. A randomized, double-blind clinical trial on the efficacy of cortical direct current stimulation for the treatment of major depression. Int J Neuropsychopharmacol. 2008;11:249–254. doi: 10.1017/S1461145707007833. [DOI] [PMC free article] [PubMed] [Google Scholar]
- Boggio PS, Zaghi S, Fregni F. Modulation of emotions associated with images of human pain using anodal transcranial direct current stimulation (tDCS) Neuropsychologia. 2009;47:212–217. doi: 10.1016/j.neuropsychologia.2008.07.022. [DOI] [PubMed] [Google Scholar]
- Bohland JW, Wu C, Barbas H, Bokil H, Bota M, Breiter HC, Cline HT, Doyle JC, Freed PJ, Greenspan RJ, Haber SN, Hawrylycz M, Herrera DG, Hilgetag CC, Huang ZJ, Jones A, Jones EG, Karten HJ, Kleinfeld D, Kötter R, et al. A proposal for a coordinated effort for the determination of brainwide neuroanatomical connectivity in model organisms at a mesoscopic scale. PLoS Comput Biol. 2009;5:e1000334. doi: 10.1371/journal.pcbi.1000334. [DOI] [PMC free article] [PubMed] [Google Scholar]
- Boly M, Phillips C, Balteau E, Schnakers C, Degueldre C, Moonen G, Luxen A, Peigneux P, Faymonville ME, Maquet P, Laureys S. Consciousness and cerebral baseline activity fluctuations. Hum Brain Mapp. 2008;29:868–874. doi: 10.1002/hbm.20602. [DOI] [PMC free article] [PubMed] [Google Scholar]
- Braver TS, Cohen JD, Nystrom LE, Jonides J, Smith EE, Noll DC. A parametric study of prefrontal cortex involvement in human working memory. Neuroimage. 1997;5:49–62. doi: 10.1006/nimg.1996.0247. [DOI] [PubMed] [Google Scholar]
- Cerruti C, Schlaug G. Anodal transcranial direct current stimulation of the prefrontal cortex enhances complex verbal associative thought. J Cogn Neurosci. 2009;21:1980–1987. doi: 10.1162/jocn.2008.21143. [DOI] [PMC free article] [PubMed] [Google Scholar]
- Corbetta M, Shulman GL. Control of goal-directed and stimulus-driven attention in the brain. Nat Rev Neurosci. 2002;3:201–215. doi: 10.1038/nrn755. [DOI] [PubMed] [Google Scholar]
- Cordes D, Haughton VM, Arfanakis K, Wendt GJ, Turski PA, Moritz CH, Quigley MA, Meyerand ME. Mapping functionally related regions of brain with functional connectivity MR imaging. AJNR Am J Neuroradiol. 2000;21:1636–1644. [PMC free article] [PubMed] [Google Scholar]
- Cordes D, Haughton VM, Arfanakis K, Carew JD, Turski PA, Moritz CH, Quigley MA, Meyerand ME. Frequencies contributing to functional connectivity in the cerebral cortex in “resting-state” data. AJNR Am J Neuroradiol. 2001;22:1326–1333. [PMC free article] [PubMed] [Google Scholar]
- Damoiseaux JS, Rombouts SA, Barkhof F, Scheltens P, Stam CJ, Smith SM, Beckmann CF. Consistent resting-state networks across healthy subjects. Proc Natl Acad Sci U S A. 2006;103:13848–13853. doi: 10.1073/pnas.0601417103. [DOI] [PMC free article] [PubMed] [Google Scholar]
- De Luca M, Beckmann CF, De Stefano N, Matthews PM, Smith SM. fMRI resting state networks define distinct modes of long-distance interactions in the human brain. Neuroimage. 2006;29:1359–1367. doi: 10.1016/j.neuroimage.2005.08.035. [DOI] [PubMed] [Google Scholar]
- De Martino F, Gentile F, Esposito F, Balsi M, Di Salle F, Goebel R, Formisano E. Classification of fMRI independent components using IC-fingerprints and support vector machine classifiers. Neuroimage. 2007;34:177–194. doi: 10.1016/j.neuroimage.2006.08.041. [DOI] [PubMed] [Google Scholar]
- D'Esposito M, Detre JA, Alsop DC, Shin RK, Atlas S, Grossman M. The neural basis of the central executive system of working memory. Nature. 1995;378:279–281. doi: 10.1038/378279a0. [DOI] [PubMed] [Google Scholar]
- Dockery CA, Hueckel-Weng R, Birbaumer N, Plewnia C. Enhancement of planning ability by transcranial direct current stimulation. J Neurosci. 2009;29:7271–7277. doi: 10.1523/JNEUROSCI.0065-09.2009. [DOI] [PMC free article] [PubMed] [Google Scholar]
- Elmer S, Burkard M, Renz B, Meyer M, Jancke L. Direct current induced short-term modulation of the left dorsolateral prefrontal cortex while learning auditory presented nouns. Behav Brain Funct. 2009;5:29. doi: 10.1186/1744-9081-5-29. [DOI] [PMC free article] [PubMed] [Google Scholar]
- Ferrarelli F, Massimini M, Sarasso S, Casali A, Riedner BA, Angelini G, Tononi G, Pearce RA. Breakdown in cortical effective connectivity during midazolam-induced loss of consciousness. Proc Natl Acad Sci U S A. 2010;107:2681–2686. doi: 10.1073/pnas.0913008107. [DOI] [PMC free article] [PubMed] [Google Scholar]
- Ferrucci R, Bortolomasi M, Vergari M, Tadini L, Salvoro B, Giacopuzzi M, Barbieri S, Priori A. Transcranial direct current stimulation in severe, drug-resistant major depression. J Affect Disord. 2009;118:215–219. doi: 10.1016/j.jad.2009.02.015. [DOI] [PubMed] [Google Scholar]
- Fertonani A, Rosini S, Cotelli M, Rossini PM, Miniussi C. Naming facilitation induced by transcranial direct current stimulation. Behav Brain Res. 2010;208:311–318. doi: 10.1016/j.bbr.2009.10.030. [DOI] [PubMed] [Google Scholar]
- Filippini N, MacIntosh BJ, Hough MG, Goodwin GM, Frisoni GB, Smith SM, Matthews PM, Beckmann CF, Mackay CE. Distinct patterns of brain activity in young carriers of the APOE-epsilon4 allele. Proc Natl Acad Sci U S A. 2009;106:7209–7214. doi: 10.1073/pnas.0811879106. [DOI] [PMC free article] [PubMed] [Google Scholar]
- Fiori V, Coccia M, Marinelli CV, Vecchi V, Bonifazi S, Ceravolo MG, Provinciali L, Tomaiuolo F, Marangolo P. Transcranial direct current stimulation improves word retrieval in healthy and nonfluent aphasic subjects. J Cogn Neurosci. 2011;23:2309–2323. doi: 10.1162/jocn.2010.21579. [DOI] [PubMed] [Google Scholar]
- Fox MD, Snyder AZ, Vincent JL, Corbetta M, Van Essen DC, Raichle ME. The human brain is intrinsically organized into dynamic, anticorrelated functional networks. Proc Natl Acad Sci U S A. 2005;102:9673–9678. doi: 10.1073/pnas.0504136102. [DOI] [PMC free article] [PubMed] [Google Scholar]
- Fransson P. Spontaneous low-frequency BOLD signal fluctuations: an fMRI investigation of the resting-state default mode of brain function hypothesis. Hum Brain Mapp. 2005;26:15–29. doi: 10.1002/hbm.20113. [DOI] [PMC free article] [PubMed] [Google Scholar]
- Fregni F, Boggio PS, Nitsche MA, Marcolin MA, Rigonatti SP, Pascual-Leone A. Treatment of major depression with transcranial direct current stimulation. Bipolar Disord. 2006;8:203–204. doi: 10.1111/j.1399-5618.2006.00291.x. [DOI] [PubMed] [Google Scholar]
- Gandiga PC, Hummel FC, Cohen LG. Transcranial DC stimulation (tDCS): a tool for double-blind sham-controlled clinical studies in brain stimulation. Clin Neurophysiol. 2006;117:845–850. doi: 10.1016/j.clinph.2005.12.003. [DOI] [PubMed] [Google Scholar]
- Greicius MD, Menon V. Default-mode activity during a passive sensory task: uncoupled from deactivation but impacting activation. J Cogn Neurosci. 2004;16:1484–1492. doi: 10.1162/0898929042568532. [DOI] [PubMed] [Google Scholar]
- Greicius MD, Krasnow B, Reiss AL, Menon V. Functional connectivity in the resting brain: a network analysis of the default mode hypothesis. Proc Natl Acad Sci U S A. 2003;100:253–258. doi: 10.1073/pnas.0135058100. [DOI] [PMC free article] [PubMed] [Google Scholar]
- Greicius MD, Supekar K, Menon V, Dougherty RF. Resting-state functional connectivity reflects structural connectivity in the default mode network. Cereb Cortex. 2009;19:72–78. doi: 10.1093/cercor/bhn059. [DOI] [PMC free article] [PubMed] [Google Scholar]
- Gusnard DA, Akbudak E, Shulman GL, Raichle ME. Medial prefrontal cortex and self-referential mental activity: relation to a default mode of brain function. Proc Natl Acad Sci U S A. 2001;98:4259–4264. doi: 10.1073/pnas.071043098. [DOI] [PMC free article] [PubMed] [Google Scholar]
- Hagmann P, Cammoun L, Gigandet X, Meuli R, Honey CJ, Wedeen VJ, Sporns O. Mapping the structural core of human cerebral cortex. PLoS Biol. 2008;6:e159. doi: 10.1371/journal.pbio.0060159. [DOI] [PMC free article] [PubMed] [Google Scholar]
- Hampson M, Driesen NR, Skudlarski P, Gore JC, Constable RT. Brain connectivity related to working memory performance. J Neurosci. 2006;26:13338–13343. doi: 10.1523/JNEUROSCI.3408-06.2006. [DOI] [PMC free article] [PubMed] [Google Scholar]
- He BJ, Snyder AZ, Vincent JL, Epstein A, Shulman GL, Corbetta M. Breakdown of functional connectivity in frontoparietal networks underlies behavioral deficits in spatial neglect. Neuron. 2007;53:905–918. doi: 10.1016/j.neuron.2007.02.013. [DOI] [PubMed] [Google Scholar]
- He BJ, Snyder AZ, Zempel JM, Smyth MD, Raichle ME. Electrophysiological correlates of the brain's intrinsic large-scale functional architecture. Proc Natl Acad Sci U S A. 2008;105:16039–16044. doi: 10.1073/pnas.0807010105. [DOI] [PMC free article] [PubMed] [Google Scholar]
- Hecht D, Walsh V, Lavidor M. Transcranial direct current stimulation facilitates decision making in a probabilistic guessing task. J Neurosci. 2010;30:4241–4245. doi: 10.1523/JNEUROSCI.2924-09.2010. [DOI] [PMC free article] [PubMed] [Google Scholar]
- Holmes CJ, Hoge R, Collins L, Woods R, Toga AW, Evans AC. Enhancement of MR images using registration for signal averaging. J Comput Assist Tomogr. 1998;22:324–333. doi: 10.1097/00004728-199803000-00032. [DOI] [PubMed] [Google Scholar]
- Horovitz SG, Braun AR, Carr WS, Picchioni D, Balkin TJ, Fukunaga M, Duyn JH. Decoupling of the brain's default mode network during deep sleep. Proc Natl Acad Sci U S A. 2009;106:11376–11381. doi: 10.1073/pnas.0901435106. [DOI] [PMC free article] [PubMed] [Google Scholar]
- Iyer MB, Mattu U, Grafman J, Lomarev M, Sato S, Wassermann EM. Safety and cognitive effect of frontal DC brain polarization in healthy individuals. Neurology. 2005;64:872–875. doi: 10.1212/01.WNL.0000152986.07469.E9. [DOI] [PubMed] [Google Scholar]
- Jang SH, Ahn SH, Byun WM, Kim CS, Lee MY, Kwon YH. The effect of transcranial direct current stimulation on the cortical activation by motor task in the human brain: an fMRI study. Neurosci Lett. 2009;460:117–120. doi: 10.1016/j.neulet.2009.05.037. [DOI] [PubMed] [Google Scholar]
- Jenkinson M, Bannister P, Brady M, Smith S. Improved optimization for the robust and accurate linear registration and motion correction of brain images. Neuroimage. 2002;17:825–841. doi: 10.1016/s1053-8119(02)91132-8. [DOI] [PubMed] [Google Scholar]
- Jo JM, Kim YH, Ko MH, Ohn SH, Joen B, Lee KH. Enhancing the working memory of stroke patients using tDCS. Am J Phys Med Rehabil. 2009;88:404–409. doi: 10.1097/PHM.0b013e3181a0e4cb. [DOI] [PubMed] [Google Scholar]
- Karim AA, Schneider M, Lotze M, Veit R, Sauseng P, Braun C, Birbaumer N. The truth about lying: inhibition of the anterior prefrontal cortex improves deceptive behavior. Cereb Cortex. 2010;20:205–213. doi: 10.1093/cercor/bhp090. [DOI] [PubMed] [Google Scholar]
- Keeser D, Padberg F, Reisinger E, Pogarell O, Kirsch V, Palm U, Karch S, Möller HJ, Nitsche MA, Mulert C. Prefrontal direct current stimulation modulates resting EEG and event-related potentials in healthy subjects: a standardized low resolution tomography (sLORETA) study. Neuroimage. 2011;55:644–657. doi: 10.1016/j.neuroimage.2010.12.004. [DOI] [PubMed] [Google Scholar]
- Kelly AM, Uddin LQ, Biswal BB, Castellanos FX, Milham MP. Competition between functional brain networks mediates behavioral variability. Neuroimage. 2008;39:527–537. doi: 10.1016/j.neuroimage.2007.08.008. [DOI] [PubMed] [Google Scholar]
- Kwon YH, Ko MH, Ahn SH, Kim YH, Song JC, Lee CH, Chang MC, Jang SH. Primary motor cortex activation by transcranial direct current stimulation in the human brain. Neurosci Lett. 2008;435:56–59. doi: 10.1016/j.neulet.2008.02.012. [DOI] [PubMed] [Google Scholar]
- Lang N, Siebner HR, Ward NS, Lee L, Nitsche MA, Paulus W, Rothwell JC, Lemon RN, Frackowiak RS. How does transcranial DC stimulation of the primary motor cortex alter regional neuronal activity in the human brain? Eur J Neurosci. 2005;22:495–504. doi: 10.1111/j.1460-9568.2005.04233.x. [DOI] [PMC free article] [PubMed] [Google Scholar]
- Laufs H. Endogenous brain oscillations and related networks detected by surface EEG-combined fMRI. Hum Brain Mapp. 2008;29:762–769. doi: 10.1002/hbm.20600. [DOI] [PMC free article] [PubMed] [Google Scholar]
- Laufs H, Krakow K, Sterzer P, Eger E, Beyerle A, Salek-Haddadi A, Kleinschmidt A. Electroencephalographic signatures of attentional and cognitive default modes in spontaneous brain activity fluctuations at rest. Proc Natl Acad Sci U S A. 2003;100:11053–11058. doi: 10.1073/pnas.1831638100. [DOI] [PMC free article] [PubMed] [Google Scholar]
- Lewis CM, Baldassarre A, Committeri G, Romani GL, Corbetta M. Learning sculpts the spontaneous activity of the resting human brain. Proc Natl Acad Sci U S A. 2009;106:17558–17563. doi: 10.1073/pnas.0902455106. [DOI] [PMC free article] [PubMed] [Google Scholar]
- Mameli F, Mrakic-Sposta S, Vergari M, Fumagalli M, Macis M, Ferrucci R, Nordio F, Consonni D, Sartori G, Priori A. Dorsolateral prefrontal cortex specifically processes general-but not personal-knowledge deception: multiple brain networks for lying. Behav Brain Res. 2010;211:164–168. doi: 10.1016/j.bbr.2010.03.024. [DOI] [PubMed] [Google Scholar]
- Massimini M, Ferrarelli F, Huber R, Esser SK, Singh H, Tononi G. Breakdown of cortical effective connectivity during sleep. Science. 2005;309:2228–2232. doi: 10.1126/science.1117256. [DOI] [PubMed] [Google Scholar]
- Mazoyer B, Houdé O, Joliot M, Mellet E, Tzourio-Mazoyer N. Regional cerebral blood flow increases during wakeful rest following cognitive training. Brain Res Bull. 2009;80:133–138. doi: 10.1016/j.brainresbull.2009.06.021. [DOI] [PubMed] [Google Scholar]
- Merzagora AC, Foffani G, Panyavin I, Mordillo-Mateos L, Aguilar J, Onaral B, Oliviero A. Prefrontal hemodynamic changes produced by anodal direct current stimulation. Neuroimage. 2010;49:2304–2310. doi: 10.1016/j.neuroimage.2009.10.044. [DOI] [PubMed] [Google Scholar]
- Miller KJ, Weaver KE, Ojemann JG. Direct electrophysiological measurement of human default network areas. Proc Natl Acad Sci U S A. 2009;106:12174–12177. doi: 10.1073/pnas.0902071106. [DOI] [PMC free article] [PubMed] [Google Scholar]
- Miranda PC, Lomarev M, Hallett M. Modeling the current distribution during transcranial direct current stimulation. Clin Neurophysiol. 2006;117:1623–1629. doi: 10.1016/j.clinph.2006.04.009. [DOI] [PubMed] [Google Scholar]
- Miranda PC, Faria P, Hallett M. What does the ratio of injected current to electrode area tell us about current density in the brain during tDCS? Clin Neurophysiol. 2009;120:1183–1187. doi: 10.1016/j.clinph.2009.03.023. [DOI] [PMC free article] [PubMed] [Google Scholar]
- Nichols TE, Holmes AP. Nonparametric permutation tests for functional neuroimaging: a primer with examples. Hum Brain Mapp. 2002;15:1–25. doi: 10.1002/hbm.1058. [DOI] [PMC free article] [PubMed] [Google Scholar]
- Nitsche MA, Paulus W. Excitability changes induced in the human motor cortex by weak transcranial direct current stimulation. J Physiol. 2000;527:633–639. doi: 10.1111/j.1469-7793.2000.t01-1-00633.x. [DOI] [PMC free article] [PubMed] [Google Scholar]
- Nitsche MA, Nitsche MS, Klein CC, Tergau F, Rothwell JC, Paulus W. Level of action of cathodal DC polarisation induced inhibition of the human motor cortex. Clin Neurophysiol. 2003;114:600–604. doi: 10.1016/s1388-2457(02)00412-1. [DOI] [PubMed] [Google Scholar]
- Oldfield RC. The assessment and analysis of handedness: the Edinburgh inventory. Neuropsychologia. 1971;9:97–113. doi: 10.1016/0028-3932(71)90067-4. [DOI] [PubMed] [Google Scholar]
- Oostendorp TF, Hengeveld YA, Wolters CH, Stinstra J, van Elswijk G, Stegeman DF. Modeling transcranial DC stimulation. Conf Proc IEEE Eng Med Biol Soc. 2008;2008:4226–4229. doi: 10.1109/IEMBS.2008.4650142. [DOI] [PubMed] [Google Scholar]
- Polanía R, Paulus W, Antal A, Nitsche MA. Introducing graph theory to track for neuroplastic alterations in the resting human brain: a transcranial direct current stimulation study. Neuroimage. 2011;54:2287–2296. doi: 10.1016/j.neuroimage.2010.09.085. [DOI] [PubMed] [Google Scholar]
- Raichle ME, Gusnard DA. Appraising the brain's energy budget. Proc Natl Acad Sci U S A. 2002;99:10237–10239. doi: 10.1073/pnas.172399499. [DOI] [PMC free article] [PubMed] [Google Scholar]
- Raichle ME, MacLeod AM, Snyder AZ, Powers WJ, Gusnard DA, Shulman GL. A default mode of brain function. Proc Natl Acad Sci U S A. 2001;98:676–682. doi: 10.1073/pnas.98.2.676. [DOI] [PMC free article] [PubMed] [Google Scholar]
- Rigonatti SP, Boggio PS, Myczkowski ML, Otta E, Fiquer JT, Ribeiro RB, Nitsche MA, Pascual-Leone A, Fregni F. Transcranial direct stimulation and fluoxetine for the treatment of depression. Eur Psychiatry. 2008;23:74–76. doi: 10.1016/j.eurpsy.2007.09.006. [DOI] [PubMed] [Google Scholar]
- Sadleir RJ, Vannorsdall TD, Schretlen DJ, Gordon B. Transcranial direct current stimulation (tDCS) in a realistic head model. Neuroimage. 2010;51:1310–1318. doi: 10.1016/j.neuroimage.2010.03.052. [DOI] [PubMed] [Google Scholar]
- Schacter DL, Addis DR, Buckner RL. Remembering the past to imagine the future: the prospective brain. Nat Rev Neurosci. 2007;8:657–661. doi: 10.1038/nrn2213. [DOI] [PubMed] [Google Scholar]
- Schilbach L, Eickhoff SB, Rotarska-Jagiela A, Fink GR, Vogeley K. Minds at rest? Social cognition as the default mode of cognizing and its putative relationship to the “default system” of the brain. Conscious Cogn. 2008;17:457–467. doi: 10.1016/j.concog.2008.03.013. [DOI] [PubMed] [Google Scholar]
- Smith SM. Fast robust automated brain extraction. Hum Brain Mapp. 2002;17:143–155. doi: 10.1002/hbm.10062. [DOI] [PMC free article] [PubMed] [Google Scholar]
- Smith SM, Nichols TE. Threshold-free cluster enhancement: addressing problems of smoothing, threshold dependence and localisation in cluster inference. Neuroimage. 2009;44:83–98. doi: 10.1016/j.neuroimage.2008.03.061. [DOI] [PubMed] [Google Scholar]
- Smith SM, Jenkinson M, Woolrich MW, Beckmann CF, Behrens TE, Johansen-Berg H, Bannister PR, De Luca M, Drobnjak I, Flitney DE, Niazy RK, Saunders J, Vickers J, Zhang Y, De Stefano N, Brady JM, Matthews PM. Advances in functional and structural MR image analysis and implementation as FSL. Neuroimage. 2004;23(Suppl 1):S208–S219. doi: 10.1016/j.neuroimage.2004.07.051. [DOI] [PubMed] [Google Scholar]
- Sparing R, Dafotakis M, Meister IG, Thirugnanasambandam N, Fink GR. Enhancing language performance with non-invasive brain stimulation—a transcranial direct current stimulation study in healthy humans. Neuropsychologia. 2008;46:261–268. doi: 10.1016/j.neuropsychologia.2007.07.009. [DOI] [PubMed] [Google Scholar]
- Stagg CJ, O'Shea J, Kincses ZT, Woolrich M, Matthews PM, Johansen-Berg H. Modulation of movement-associated cortical activation by transcranial direct current stimulation. Eur J Neurosci. 2009;30:1412–1423. doi: 10.1111/j.1460-9568.2009.06937.x. [DOI] [PubMed] [Google Scholar]
- Suh HS, Lee WH, Cho YS, Kim JH, Kim TS. Reduced spatial focality of electrical field in tDCS with ring electrodes due to tissue anisotropy. Conf Proc IEEE Eng Med Biol Soc. 2010;2010:2053–2056. doi: 10.1109/IEMBS.2010.5626502. [DOI] [PubMed] [Google Scholar]
- Turken A, Whitfield-Gabrieli S, Bammer R, Baldo JV, Dronkers NF, Gabrieli JD. Cognitive processing speed and the structure of white matter pathways: convergent evidence from normal variation and lesion studies. Neuroimage. 2008;42:1032–1044. doi: 10.1016/j.neuroimage.2008.03.057. [DOI] [PMC free article] [PubMed] [Google Scholar]
- van den Heuvel MP, Mandl RC, Kahn RS, Hulshoff Pol HE. Functionally linked resting-state networks reflect the underlying structural connectivity architecture of the human brain. Hum Brain Mapp. 2009;30:3127–3141. doi: 10.1002/hbm.20737. [DOI] [PMC free article] [PubMed] [Google Scholar]
- van den Heuvel M, Mandl R, Luigjes J, Hulshoff Pol H. Microstructural organization of the cingulum tract and the level of default mode functional connectivity. J Neurosci. 2008;28:10844–10851. doi: 10.1523/JNEUROSCI.2964-08.2008. [DOI] [PMC free article] [PubMed] [Google Scholar]
- van de Ven VG, Formisano E, Prvulovic D, Roeder CH, Linden DE. Functional connectivity as revealed by spatial independent component analysis of fMRI measurements during rest. Hum Brain Mapp. 2004;22:165–178. doi: 10.1002/hbm.20022. [DOI] [PMC free article] [PubMed] [Google Scholar]
- van de Ven V, Bledowski C, Prvulovic D, Goebel R, Formisano E, Di Salle F, Linden DE, Esposito F. Visual target modulation of functional connectivity networks revealed by self-organizing group ICA. Hum Brain Mapp. 2008;29:1450–1461. doi: 10.1002/hbm.20479. [DOI] [PMC free article] [PubMed] [Google Scholar]
- Vincent JL, Patel GH, Fox MD, Snyder AZ, Baker JT, Van Essen DC, Zempel JM, Snyder LH, Corbetta M, Raichle ME. Intrinsic functional architecture in the anaesthetized monkey brain. Nature. 2007;447:83–86. doi: 10.1038/nature05758. [DOI] [PubMed] [Google Scholar]
- Volle E, Kinkingnéhun S, Pochon JB, Mondon K, Thiebaut de Schotten M, Seassau M, Duffau H, Samson Y, Dubois B, Levy R. The functional architecture of the left posterior and lateral prefrontal cortex in humans. Cereb Cortex. 2008;18:2460–2469. doi: 10.1093/cercor/bhn010. [DOI] [PubMed] [Google Scholar]
- Wagner T, Fregni F, Fecteau S, Grodzinsky A, Zahn M, Pascual-Leone A. Transcranial direct current stimulation: a computer-based human model study. Neuroimage. 2007;35:1113–1124. doi: 10.1016/j.neuroimage.2007.01.027. [DOI] [PubMed] [Google Scholar]
- Wassermann EM, Grafman J. Recharging cognition with DC brain polarization. Trends Cogn Sci. 2005;9:503–505. doi: 10.1016/j.tics.2005.09.001. [DOI] [PubMed] [Google Scholar]
- Wirth M, Jann K, Dierks T, Federspiel A, Wiest R, Horn H. Semantic memory involvement in the default mode network: a functional neuroimaging study using independent component analysis. Neuroimage. 2011;54:3057–3066. doi: 10.1016/j.neuroimage.2010.10.039. [DOI] [PubMed] [Google Scholar]
- Zuo XN, Kelly C, Adelstein JS, Klein DF, Castellanos FX, Milham MP. Reliable intrinsic connectivity networks: test-retest evaluation using ICA and dual regression approach. Neuroimage. 2010;49:2163–2177. doi: 10.1016/j.neuroimage.2009.10.080. [DOI] [PMC free article] [PubMed] [Google Scholar]