

Abstract
In this study, we have investigated the contribution of oligodendrocytic connexin47 (Cx47) and astrocytic Cx30 to panglial gap junctional networks as well as myelin maintenance and function by deletion of both connexin coding DNAs in mice. Biocytin injections revealed complete disruption of oligodendrocyte-to-astrocyte coupling in the white matter of 10- to 15-d-old Cx30/Cx47 double-deficient mice, while oligodendrocyte-to-oligodendrocyte coupling was maintained. There were no quantitative differences regarding cellular networks in acute brain slices obtained from Cx30/Cx47 double-null mice and control littermates, probably caused by the upregulation of oligodendrocytic Cx32 in Cx30/Cx47 double-deficient mice. We observed early onset myelin pathology, and ∼40% of Cx30/Cx47 double-deficient animals died within 42 to 90 d after birth, accompanied by severe motor impairments. Histological and ultrastructural analyses revealed severe vacuolization and myelination defects in all white matter tracts of the CNS. Furthermore, Cx30/Cx47 double-deficient mice exhibited a decreased number of oligodendrocytes, severe astrogliosis, and microglial activation in white matter tracts. Although less affected concerning motor impairment, surviving double-knock-out (KO) mice showed behavioral alterations in the open field and in the rotarod task. Vacuole formation and thinner myelin sheaths were evident also with adult surviving double-KO mice. Since interastrocytic coupling due to Cx43 expression and interoligodendrocytic coupling because of Cx32 expression are still maintained, Cx30/Cx47 double-deficient mice demonstrate the functional role of both connexins for interastrocytic, interoligodendrocytic, and panglial coupling, and show that both connexins are required for maintenance of myelin.
Introduction
Gap junctions are clustered intercellular conduits composed of connexin (Cx) protein subunits which allow diffusional exchange of ions, metabolites, and second messengers. Six connexin proteins contribute to one hemichannel (connexon), and two connexons of adjacent cells form one gap junction channel. While homomeric connexons are composed of one connexin isoform, heteromeric connexons are formed by at least two connexin isoforms. Equal connexons form homotypic gap junction channels and combinations of two distinct connexon hemichannels are termed heterotypic.
In the CNS, neurons and macroglia express distinct sets of connexin isoforms (Nagy et al., 2003; Rash et al., 2005). Astrocytes express Cx43 and Cx30, and some of them Cx26, whereas Cx47, Cx32, and Cx29 are expressed by oligodendrocytes (Nagy et al., 2001; Kleopa et al., 2004). Gap junction channels are formed among astrocytes (A/A), among oligodendrocytes (O/O), and between oligodendrocytes and astrocytes (O/A), which results in formation of panglial networks (Wallraff et al., 2006; Maglione et al., 2010; Wasseff and Scherer, 2011). Since Cx29 does not form functional gap junction channels in cell culture experiments and Cx26 expression is limited to few gray matter astrocytes, panglial networks are mainly formed by astrocytic Cx43 and Cx30 and oligodendrocytic Cx47 and Cx32 (Ahn et al., 2008; Giaume and Theis, 2010; Nagy et al., 2011).
Loss of either Cx47 or Cx32 results in only mild myelin defects in adult mice (Odermatt et al., 2003; Menichella et al., 2003; Sargiannidou et al., 2009). In contrast, deficiency of both oligodendrocytic connexins, Cx32 and Cx47, leads to loss of O/O and O/A coupling, severe myelin abnormalities, and death at ∼6 weeks after birth (Odermatt et al., 2003; Menichella et al., 2003; Maglione et al., 2010). However, mice deficient for both astrocytic connexins, Cx43 and Cx30, display only mild myelin defects and normal viability, although A/A coupling is abolished and O/A coupling reduced in the CNS of these mice (Wallraff et al., 2006; Lutz et al., 2009; Maglione et al., 2010).
Electrophysiological studies on mammalian cells transfected with distinct glial connexins identified Cx47/Cx43, Cx47/Cx30, and Cx32/Cx30 as the only combinations showing functional heterotypic channels (Orthmann-Murphy et al., 2007; Magnotti et al., 2011a). Furthermore, ultrastructural and immunohistochemical analyses, mainly on gray matter tissue, revealed colocalization of oligodendrocytic Cx47 and astrocytic Cx43 at oligodendrocyte-to-astrocyte gap junctions, while oligodendrocytic Cx32 colocalizes with astrocytic Cx30 or Cx26 (Nagy et al., 2003; Altevogt and Paul, 2004). Thus we reasoned that deletion of Cx47 and Cx30 should strongly inhibit channel formation among oligodendrocytes and astrocytes, whereas O/O coupling remains restricted to Cx32 channels, and A/A coupling remains mainly dependent on Cx43 channels.
In a recent study, Cx43/Cx32 double-deficient mice were described to develop white matter vacuolation, astrocyte loss, and early death, but functional panglial coupling was not investigated (Magnotti et al., 2011b).
Here we have investigated the contribution of oligodendrocytic Cx47 and astrocytic Cx30 to panglial networks and myelin maintenance and function using Cx47/Cx30 double-deficient mice.
Materials and Methods
Animals.
All mice used were kept under standard housing conditions with a 12 h dark/light cycle and with food and water ad libitum. All experiments were performed in accordance with local and state regulations for research with animals.
Cx30−/−/Cx47−/− double-deficient mice and control littermates were obtained by breeding Cx30−/−/Cx47+/− and Cx30+/−/Cx47−/− mice. In Cx30 knock-out (KO) mice, the Cx30 coding region had been replaced by the LacZ reporter DNA preceded by a nuclear localization signal (Teubner et al., 2003). In the Cx47-deficient mouse line, expression of the enhanced green fluorescent protein (eGFP) indicates the activity of the endogenous Cx47 gene (Odermatt et al., 2003). All mice used had a minimum genetic background of 87.5% C57BL/6.
Genotyping was performed using isolated DNA obtained from tail tips and three primer PCRs. The primers for Cx30 PCR were WT-5 (5′-GGT ACC TTC TAC TAA TTA GCT TGG-3′), WT-3 (5′-AGG TGG TAC CCA TTG TAG AGG AAG-3′), LacZ-3 (5′-AGC GAG TAA CAA CCC GTC GGA TTC-3′); a transgenic band 414 bp, WT band 550 bp. The primers for Cx47 PCR were Cx47_n_EcoRI (5′-CAG CAA GGC ACA ACA GAA CTT CCA GG-3′), Cx47E_for (5′-GCA GCA GAG ACG GCA AGG CCA CC-3′), HPRT_Cx47 (5′-CCA TTT GTC ACG TCC TGC ACG ACG C-3′); a transgenic band 296 bp, WT band 641 bp.
Dye-coupling experiments.
Acute coronal brain slices containing the corpus callosum were prepared from postnatal day 10 (P10) to P15 mice as described previously (Haas et al., 1996). For patch-clamp recordings, slices were placed in a recording chamber and perfused continuously with artificial CSF composed of the following (in mm): 134 NaCl, 2.5 KCl, 1.3 MgCl2, 2 CaCl2, 1.25 K2HPO4, 26 NaHCO3, and d-glucose 10, saturated with carbogen (95% O2, 5% CO2) to pH 7.4 at room temperature. Patch-clamp recordings were performed as described previously (Maglione et al., 2010). Pipettes had a resistance ranging from 3 to 7 MΩ when filled with an intracellular solution containing the following (in mm): 4 NaCl, 120 KCl, 4 MgCl2, 0.5 CaCl2, 10 HEPES, 5 EGTA, 5 d-glucose, and 0.5% biocytin at pH 7.4. Alexa Fluor 594 (10 μg/ml; Invitrogen) was added to the pipette solution to confirm intracellular access. To improve voltage-clamp control, capacitance was compensated by TIDA software (HEKA Elektronik). In each individual slice, only a single cell was filled via the patch pipette during whole-cell recordings (20 min) (Haas et al., 1996). Only cells with stable input resistance over the 20 min period were considered for data analysis. During recording, the membrane was continuously depolarized and hyperpolarized between −170 and +50 mV from a holding potential of −70 mV (10 mV steps, 50 ms). Current signals were amplified (EPC9/2 or EPC10 amplifiers; HEKA), filtered (3 kHz), sampled (5 kHz), and monitored with TIDA software (HEKA).
Immunohistochemistry following dye-coupling experiments.
After recording and dialysis, the slices were fixed for 1 h in a solution of 4% paraformaldehyde in 0.1 m phosphate buffer (PB), pH 7.4, at 4°C and processed for biocytin visualization with Cy3 conjugated streptavidin. Specific cell type identification was performed combining biocytin/streptavidin-Cy3 labeling with immunostaining for the oligodendrocyte marker 2′,3′-cyclic nucleotide-3′ phosphodiesterase (CNPase) and the astrocytic marker GFAP. In Cx30/Cx47 double-deficient mice oligodendrocytes were identified by immunostaining against eGFP, specifically expressed under the Cx47 promoter (Odermatt et al. 2003). Immunostaining for eGFP was performed to increase the signal-to-noise ratio. After fixation, slices were incubated in a solution containing 2% Triton X-100 (TX-100), 2% BSA, and 10% donkey serum (DS) or 2% TX-100 and 10% DS in PB at pH 7.4 for 4 h to permeabilize and to block nonspecific binding of the primary antibodies. Cy3-conjugated streptavidin (1:200; Jackson ImmunoResearch/Dianova), mouse anti-CNPase oligodendrocyte cell marker (1:200; Sigma), rabbit polyclonal anti-GFAP (1:1000 or 1:500; Dako), chicken polyclonal anti-eGFP (1:500; Millipore Bioscience Research Reagents), or goat polyclonal anti-GFP (1:500; Acris) antibodies were diluted in 0.1 m phosphate buffer containing 2% TX-100, 2% BSA, and 5% DS, or 2% TX-100 and 5% DS.
The floating slices were incubated with the primary antibodies at 4°C overnight. Primary antibodies were visualized by application of FITC-conjugated donkey anti-mouse IgG (1:200), Cy5 or DyLight 649-conjugated donkey anti-mouse IgG (1:200), Cy5-conjugated donkey anti-rabbit IgG (1:200), AMCA (aminomethylcoumarin acetate) or DyLight 405-conjugated donkey anti-rabbit IgG (1:200), FITC-conjugated donkey anti-chicken IgG (1:200), or FITC-conjugated donkey anti-goat IgG (1:125; all secondary antibodies were purchased from Jackson ImmunoResearch/Dianova) for 2 h at room temperature. No unspecific cross-reaction between secondary antibodies was observed. Slices were rinsed and mounted with aqua polymount (Polysciences). Images were acquired by confocal microscopy with Leica software (TCS SP5).
Evaluation of dye-coupling experiments.
Electrophysiological data were analyzed and plotted using TIDA and Origin software (MicroCal). Dye coupling was evaluated as reported previously (Haas et al., 1996).
Statistical analysis was performed with SPSS 11.5 for Windows. Data regarding the number of biocytin-positive cells, the extent of tracer spread in cerebellum, and the population of coupled cells in both white matter areas were analyzed by Kruskal–Wallis nonparametric test followed by Mann–Whitney test for independent samples, with Bonferroni's correction for n pair comparisons. All values are expressed as median and 25th and 75th percentiles. Values of specific glial cell types are indicated as percentages of the number of biocytin-positive cells per network. Data regarding the extent of tracer spread and the number of coupled cells in the corpus callosum are expressed as mean ± SD and were analyzed with one-way ANOVA followed by Bonferroni's post hoc analysis. For differences between groups, the number of oligodendrocytes forming networks was evaluated by χ2 test. Values of p < 0.05 were considered statistically significant.
Semiquantitative RT-PCR.
Tissue samples were isolated from the cerebellum. For each genotype, at least three mice were used. Total RNA was isolated from tissue samples with Trizol (Invitrogen) and dissolved in 20 μl DEPC-treated water. Genomic DNA was removed by DNase treatment in a mixture containing PCR buffer, 2.5 mm MgCl2, 10 mm DTT (all Invitrogen), 40 U DNaseI (Roche), and 40 U RNase inhibitor (Promega; final volume 20 μl; incubation at 37°C for 30 min). Subsequently, mRNA was isolated using oligo(dT)25-linked Dynabeads (Invitrogen). Dynabeads suspended in lysis buffer (50 μl) were added to the reaction tube. After wash (200 μl), beads with the adherent mRNA were suspended in DEPC-treated water (20 μl), frozen, and stored at −20°C.
RT-PCR was performed as a single enzyme procedure using recombinant Thermus thermophilus (rTth) DNA polymerase (TaqMan EZ RT-PCR Kit; Applied Biosystems). The reaction volume was 12.5 μl. The reaction mixture contained TaqMan EZ buffer, 3× 300 μm dNTPs (dATP, dCTP, dGTP), 600 μm dUTP, 3 mm Mn(OAc)2, 1.25 U rTth DNA polymerase, and 0.125 U uracil-N-glycosylase. For Cx43 semiquantitative RT (sqRT)-PCR analysis, 100 nm fluorogenic TaqMan probe and 600 nm of each primer was added (Table 1). For β-actin and Cx32 detection and quantification, a TaqMan probe/primer mix was used (Applied Biosystems). Aliquots of 1 μl mRNA were added to each tube. RT-PCRs for Cx32, Cx43, and β-actin were run in parallel tubes for each sample. Negative controls (water) were also performed in each run. Samples were incubated at 50°C (2 min), and first strand synthesis was performed at 60°C (20 min). After denaturation (95°C, 5 min), 50 cycles were performed (denaturation at 94°C, 15 s; primer annealing and extension at 59°C, 60 s). Fluorescence intensity was read out during each annealing/extension step.
Table 1.
Primers and probe for semi-quantitative RT-PCR
| Gene | Sequence | Position | Product length |
|---|---|---|---|
| Cx43 (gja1) | Sense 5′-TTTGACTTCAGCCTCCAAGGA | −80 | 79 bp |
| Antisense 5′-TCTGGGCACCTCTCTTTCACTTA | −24 | ||
| Cx43 (probe) | Sense FAM-5′-TTCCACCACTTTGGCGTGCCG-TAMRA | −58 |
Position 1 is the first nucleotide of the initiation codon. The fluorogenic TaqMan Cx43 probe was labeled at their 5′ end with 6-carboxyfluorescein (FAM) and at their 3′ end with 6-carboxytetramethylrhodamine (TAMRA). The GenBank accession number for Cx43 (gja1) is NM_010288.
Data analysis.
The Cx32/β-actin and the Cx43/β-actin gene expression ratio was determined by comparing CT values of the respective target gene with those of the reference gene, β-actin. The relative quantification of different genes was determined according to the following equation:
or, in the logarithmic form,
with Y being the amount of the PCR product, X the input copy number, E the efficiency of amplification, and CT the cycle number at threshold. According to Equation 1, the fluorescence intensity, Rn, which is proportional to Y, was determined at each cycle. By quantification of Cx32 and Cx43 gene expression against that of β-actin, CT was determined for each gene at the same Rn, and the difference in input copy number was estimated according to Equation 1:
The amplification efficiency, E, was 1.93 for both Cx32 and Cx43, and 1.90 for β-actin. Data are presented as the mean ± SEM.
Electron microscopy study.
Mice were anesthetized deeply by sodium pentobarbital (100 mg/kg body weight; Sanofi) and perfused intracardially with 4% paraformaldehyde and 2% glutaraldehyde in 0.1 m PB. Brains were removed, postfixed overnight at 4°C, and subsequently rinsed in cold PB. Coronal sections (50 μm) of the cerebellum and corpus callosum were cut on a vibratome (Vibracut; FTB Feinwerktechnik), postfixed in osmium tetroxide, dehydrated through graded concentrations of ethanol, preembedded with propylene oxide, and flat-embedded in epoxy resin (agar 100 resin; Araldite CY 212, dodecenylsuccinic anhydride, Tris-2,3,6-(dimethylaminomethyl)phenol; Plano). Semithin sections (2 μm thick) were stained with toluidine blue for light microscopy. Ultrathin sections were mounted on copper grids, stained with uranyl acetate and lead citrate, and examined in an electron microscope (EM910; Carl Zeiss) at 80 kV.
The ratio of myelin sheath thickness to axon diameter (g ratio) was calculated for 400 fibers of cerebellum and corpus callosum of at least three Cx30−/−/Cx47−/− and Cx30+/−/Cx47+/− mice in electron micrographs using the iTEM 5.0 program (Olympus Soft Imaging Solutions). The g ratio was plotted against the diameter of axons to directly compare the extent of myelination around an axon size. Statistic analysis was performed with SPSS 11.5 for Windows. Comparison between groups was evaluated with the nonparametric Mann–Whitney test or with Student's t test for independent samples. Values are expressed as the median and 25th and 75th percentiles or as the mean ± SD. Values of p < 0.05 were considered significant.
Immunohistochemical staining on vibratome sections.
At different ages, mice were killed by injecting an anesthetic solution (0.3 mg ketamine and 0.03 mg xylazine per gram body weight, i.p.). Mice were transcardially perfused with 25–40 ml PB followed by 25–40 ml phosphate-buffered 4% formaldehyde solution (Roti-Histofix; Roth). Brains were rapidly prepared and postfixed in 2% phosphate-buffered formaldehyde solution for at least 48 h at 4°C. Vibratome sections (30 μm thick) were obtained (VT 1200 S; Leica), and free-floating slices were incubated with 0.1% H2O2 in 10% methanol/PB, pH 7.4, for 20 min to inhibit endogenous peroxidase activity, washed in PB, and incubated in blocking solution [5% normal goat serum (NGS), 4% BSA, 0.3% Triton X-100] for 1 h at room temperature to avoid unspecific cross-reactivity. Primary antibodies in blocking solution were applied overnight at room temperature. After washing with PB, sections were incubated with corresponding biotin-conjugated secondary antibodies for 2 h at room temperature and washed again. Vectastain Peroxidase ABC reagent (Vector Laboratories) was applied according to manufacturers' instructions. After 30 min incubation in working solution, free-floating sections were washed in PB for 60 min and then transferred to aqua bidest for at least 5 min before NovaRed (Vector Laboratories) staining. Sections were mounted on glass slides, air dried at 42°C on a slide warmer, and coverslipped with Entellan (Merck). Rat primary antibodies directed against myelin basic protein (MBP; 1:500; Millipore Bioscience Research Reagents) were used for myelin staining, and rabbit polyclonal antibodies against ionized calcium-binding adapter molecule 1 (Iba1; 1:500; Wako) were used for staining of microglia. Rabbit polyclonal GFAP antibodies (1:1000; Dako) were used for labeling of astrocytes, and rabbit polyclonal anti-GFP (1:500; Invitrogen) was used for detection of the eGFP reporter protein. Nuclei of oligodendrocytes were stained by rabbit polyclonal anti-oligodendrocyte transcription factor 2 (anti-Olig2; 1:500; Millipore Bioscience Research Reagents).
Quantification of Olig2-positive cells.
Olig2-stained cell counts were based on regional analysis of cerebellar white matter and corpus callosum in 30 μm vibratome sections of at least three mice per genotype and age. White matter regions were cut out from pictures with identical magnification levels by manual selection using Photoshop software (Photoshop CS4; Adobe Systems). Counting of Olig2-positive nuclei and area evaluation of corresponding white matter regions were performed using MBF-ImageJ software (NIH). Data are given as mean ± SEM and were analyzed with one-way ANOVA followed by Bonferroni's post hoc analysis. Values of p < 0.05 were considered significant.
Immunofluorescence staining on vibratome sections.
For double immunofluorescence labeling, vibratome sections (25 μm) were blocked with PB containing 0.3% Triton X-100, 0.02% NaN3, and 5% NGS for 1 h at room temperature. Sections were incubated with both primary antibodies, rabbit polyclonal anti-Cx30 (1:500; Invitrogen) and polyclonal chicken anti-GFP (1:500; Abcam), at room temperature overnight in blocking solution, washed with PB-T (0.1% Triton X-100), and incubated for 1 h with corresponding goat polyclonal secondary antibodies conjugated to Alexa 488 and Alexa 594 (1:500; Invitrogen) diluted in PB containing 0.3% Triton X-100 and 5% NGS. After PB washes, sections were mounted with PermaFluor (Thermo Fisher Scientific), and images were taken with a laser scanning microscope (LSM 510, Zeiss).
Black-Gold II staining.
Black-Gold II (Histo-Chem) staining was performed on 16 μm cryosections according to manufacturers instructions (Schmued et al., 2008).
Animals for behavioral experiments.
Adult male mice, 7 ± 0.3 months old (n = 37), were used for behavioral experiments. Double-homozygous Cx30−/−/Cx47−/− (Cx30 and Cx47 deficient) mice (n = 9), double-heterozygote Cx30+/−/Cx47+/− mice (n = 10), Cx30−/−/Cx47+/− mice (n = 7), and Cx30+/−/Cx47−/− mice (n = 11) were tested in a behavioral test battery including open-field exploration and behavioral habituation, one-trial object recognition, novelty-induced continuous spontaneous spatial alternation, as well as motor coordination learning and long-term motor memory.
Housing conditions.
Animals were group housed until 1 week before the beginning of the experiments. Thereafter, they were single housed in standard Makrolon cages (type 2; 22 × 16 × 13 cm; Emiscon Jung) with metal covers and dust-free sawdust bedding until the end of the study. The mice had continuous access to food (Ssniff Spezialdiäten) and tap water, and were maintained on a 12 h light/dark cycle. Experiments were performed during the light phase, between 10:00 A.M. and 5:00 P.M. Animals were maintained in an air-conditioned room. During the week preceding the experiments, the mice were handled for 2 min per day to reduce possible stress from the testing procedure. All experiments were performed according to the guidelines of the German Animal Welfare Act and were approved by the local state authority.
Open-field exploration and behavioral habituation.
Exploratory activity induced by a novel environment and behavioral habituation to spatial novelty was measured using an open-field setting. The animals were given three exposures to an open field with a 24 h intertrial interval. Mice exposed to a novel environment show explorative behaviors in terms of increased locomotion and rearing activity. When mice are repeatedly placed into the same open field, a progressive reduction in these exploratory behaviors becomes evident, suggesting that the initially novel environment has become familiar (Sadile et al., 1996). The open field was a rectangular chamber (30 × 30 × 40 cm) made of gray polyvinylchloride and had a gray metal floor. A video camera was mounted 50 cm above the maze. The open-field apparatus was placed in a sound-attenuating cubicle. The open field was illuminated by diffuse white light with an intensity of 9 lux at the center of the apparatus. The digitized image of the animal's path was analyzed with a semiautomated tracing device (EthoVision; Noldus). After each trial, the apparatus was cleaned with water containing 75% ethanol. The behavioral parameters registered during 10 min sessions were (1) locomotion (the distance in centimeters that an animal moved) and (2) rearings [the frequency and average duration (in seconds) of rearings on hindlimbs]. One Cx30−/−/Cx47−/− mouse and one Cx30+/−/Cx47+/− mouse had to be excluded from data analysis due to technical problems during the digitalizing/tracking of the animal's path in the open field.
Novelty-induced continuous spontaneous spatial alternation.
When mice are placed in a novel, Y-shaped maze, they typically show continuous spontaneous spatial alternation behavior for at least 5 min until the Y maze has become familiar. This task utilizes the congenital tendency of rodents to frequent relatively novel places not visited quite recently when allowed to choose freely among respective alternatives. Spontaneous spatial alternation in a Y maze is induced by spatial novelty and requires basic spatial working memory capacities. The Y maze was made of black Plexiglas with three arms (see Fig. 12C; A–C), each 7.5 cm wide and 18 cm long, with 23.5-cm-high walls and an open roof, radiating from a triangle-shaped central platform. One of the three arms differed from the others in respect of three rectangular gaps (2.3 × 7.5 cm, 4.8 × 7.5 cm, and 2.3 × 7.5 cm) which were cut into the end wall. These gaps were separated by 1 cm, with the first one located at a height of 12 cm. The Y maze was placed in a sound-attenuating cubicle and was illuminated by diffuse white light with an intensity of 5 lux at the center of the apparatus. The animals were placed on the central platform and were allowed to explore the Y maze for 5 min. An arm entry was scored when the animal entered an arm with all four paws. The sequence of arm entries was recorded manually (i.e., ABCBAC) for each animal for the first 20 entries to calculate the number of triplets. The following parameters were scored: (1) arm entries (the total number of arm entries made during the 5 min trial) and (2) triplets (the number of consecutive choices of each of the three arms, without reentries, during the last three choices and regardless of the order of the chosen arms, calculated from the sequence of the first 20 arm entries). The following example illustrates the scoring of triplets and the calculation of above-chance-level performance in this task. A mouse chooses arm A, and thereafter arm B, and then returns to the decision area. The mouse now has the option to enter arm A, B, or C. If the mouse fails to remember the sequence of arm entries, the probability to exert a “correct” response, C, to perform a triplet is, by definition, one in three. Therefore, performance above chance level for a total of 20 arm entries with a maximum number of 18 triplets possible can be assumed when triplet values above six are achieved.
Figure 12.

Behavior and motor coordination of adult mice. A, B, Open-field exploration and behavioral habituation. Error bars represent the mean ± SEM of locomotion in centimeters (A) and the mean ± SEM of rearings (B). *p < 0.05, Cx30−/−/Cx47−/− versus Cx30+/−/Cx47+/− and Cx30−/−/Cx47−/− versus Cx30+/−/Cx47−/− (LSD test). C–E, Novelty-induced continuous spontaneous spatial alternation. C, Schematic drawing of the Y-maze apparatus. D, Error bars represent the mean ± SEM of arm entries accumulated over 5 min. *p < 0.05, Cx30−/−/Cx47−/− versus Cx30+/−/Cx47+/− (LSD test). E, Error bars represent the mean ± SEM of triplets accumulated during the first 20 entries. *p < 0.05 (significantly different from chance level against a comparison value of six triplets, single-group t test). F–H, One-trial object recognition. F, Experimental design. G, Mean ± SEM of time spent (in seconds) exploring both objects during the sample or test trial. H, Mean ± SEM of novel object preference ratios. *p < 0.05 (significantly different from chance level against a comparison value of 0.5, single-group t test). I, Motor coordination learning and long-term motor memory. Circles represent the mean ± SEM of latency (in seconds) to fall from the rotating drum. ***p < 0.05 (main effect of genotype, repeated-measures ANOVA); ###p < 0.05, compared to Cx30+/−/Cx47+/− controls (LSD test).
One-trial object recognition.
Four different objects (in triplets) made of plastic that differed in terms of height, color, shape, and surface texture were used. Since the objects were made of the same material, they could not be distinguished by olfactory cues during the test trial. The objects had sufficient weight to ensure that the mice could not displace them. The objects had no known ethological significance for the mice and had never been paired with a reinforcer. Pilot studies ensured that mice of the C57BL/6 genetic background strain could discriminate between the objects, and there was no preference for one of the objects per se.
During the sample trial, the mouse was placed into the center of a familiar open field containing two copies of one object, placed in a balanced fashion in opposite corners. After 10 min, the animal was removed from the open field and placed back into its home cage for the retention delay of 60 min. During the test trial of 5 min duration, the animal was again released into the open field, now containing a familiar object, known from the sample trial, and a novel object. The same two locations as during the sample phase were used for object placement. The exact position for the placement of the novel object was determined randomly.
For each mouse, the times spent exploring the objects (in seconds) during the sample and test trial were scored off-line from video tapes. Exploration of an object was assumed when the mouse approached an object and had physical contact with it, either with its vibrissae, snout, or forepaws. Being in the vicinity of an object, at a distance <2 cm, was not considered exploratory behavior. The proportion of time exploring the novel object relative to the total time spend exploring both objects was taken as a measure of object recognition: recognition index = tnovel/(tnovel + tfamiliar). Recognition index values >0.5 suggest a preference for the novel object, values close to 0.5 suggest no recognition, whereas values well below 0.5 suggest a preference for the familiar object. Animals which did not showed significant levels of object exploration during the sample trial were excluded from data analysis. Accordingly, one Cx30−/−/Cx47−/− mouse, one Cx30+/−/Cx47+/− mouse, two Cx30−/−/Cx47+/− mice, and two Cx30+/−/Cx47−/− mice had to be excluded from data analysis.
Motor coordination learning and long-term motor memory.
The accelerating rotarod (TSE Systems, Model #7650) was elevated 10 cm off the floor and had an axis diameter of 3.5 cm and a striated surface made of black rubber. During the acquisition phase, each mouse was given three trials (with an intertrial interval of 10–25 min to control for possible effects of physical exhaustion) per day for 3 consecutive days. After a retention delay of 7 d, the animals were given another three trials with the same intertrial interval as during the acquisition phase. The mouse was placed on the inactive drum, which thereafter was accelerated to a speed of 40 rpm over a period of 5 min. The mouse had to move forward on the drum, which was rotating with increasing speed along its vertical axis, to avoid falling off. As some mice tend to passively ride around the rod, especially at higher velocities, the duration (in seconds) of active performance until the mouse fell off the drum was registered with a cutoff after 300 s. One Cx30+/−/Cx47+/− mouse was excluded from data analysis because of a deviation from the group mean of >3.5 SEs.
Statistics.
Values in the figures depicting behavioral data represent the mean ± SEM. Open-field exploration, behavioral habituation, motor coordination learning, and long-term motor memory data were analyzed by means of two-way repeated-measures ANOVA. Novelty-induced continuous spontaneous spatial alternation and one-trial object recognition data were analyzed by one-way ANOVA. Preplanned comparisons (focused comparison) between homozygote Cx30−/−/Cx47−/− and heterozygote Cx30+/−/Cx47+/− mice were done by using Fisher's least significant difference (LSD) procedure. In the case of significant differences between Cx30−/−/Cx47−/− and Cx30+/−/Cx47+/− mice, Cx30+/−/Cx47+/− mice were further compared to both Cx30−/−/Cx47+/− and Cx30+/−/Cx47−/− mice by means of pairwise LSD tests. To determine whether one-trial object recognition ratios and triplet number in the novelty-induced continuous spontaneous spatial alternation task of Cx30−/−/Cx47−/− and Cx30+/−/Cx47+/− mice were above chance level, single-group t tests were performed on ratios and triplets against comparison values of 0.5 and 0.6, respectively. The p values given are two tailed and were considered to be significant at p < 0.05.
Results
More than 40% of the Cx30/Cx47 double-deficient mice die between 6 and 13 weeks after birth
To gain new insights into the function of connexins expressed by astrocytes and oligodendrocytes and their contribution to panglial networks, double-heterozygous mice were generated by breeding Cx47−/− mice with Cx30−/− mice. Cx30+/−/Cx47+/− express the reporter DNA LacZ under control of the Cx30 gene (Teubner et al., 2003) and eGFP via Cx47 gene regulatory elements (Odermatt et al., 2003). Cx30+/−/Cx47+/− were further bred to obtain Cx30/Cx47 double-deficient mice. Cx30−/−/Cx47+/− and Cx30+/−/Cx47−/− mice served as controls with functional deficiency of a single connexin isoform.
Breeding of Cx30−/−/Cx47+/− and Cx30+/−/Cx47−/− mice yielded offspring at expected Mendelian frequencies (Cx30+/−/Cx47+/−, 23.3%, n = 55; Cx30−/−/Cx47+/−, 26.7%, n = 63; Cx30+/−/Cx47−/−, 22.3%, n = 52; Cx30−/−/Cx47−/−, 28%, n = 66). Approximately 2 weeks after birth, an action tremor was detected in most of the Cx30−/−/Cx47−/− [double KO (dKO)] mice. Subsequently, >40% of the Cx30−/−/Cx47−/− animals developed a profound ataxic phenotype and died between P42 and P90 (Fig. 1). Surviving mice showed a less obvious but still visible action tremor and mild ataxia.
Figure 1.

The Kaplan–Meier survival curve illustrates early death of Cx30−/−/Cx47−/− mice. Double-deficient mice began to die on P42. More than 40% of the double-deficient mice die within the first 3 months after birth. Older animals survive to almost normal life expectancy but display motor impairments and action tremor.
Panglial networks in Cx30/Cx47 double-deficient mice
To determine whether lack of both Cx47 and Cx30 affects panglial coupling, we performed dye transfer experiments in Cx30+/−/Cx47+/−, Cx30−/−/Cx47+/−, Cx30+/−/Cx47−/−, and Cx30−/−/Cx47−/− mice compared with wild-type animals. Oligodendrocytes were approached with a patch-clamp pipette in acute sagittal slices of cerebellar white matter or in acute coronal slices of corpus callosum obtained from P10–P15 mice, before the action tremor was evident. By whole-cell patch-clamp recording, single oligodendrocytes were dialyzed via the patch pipette with the gap junction permeable tracer biocytin as described previously (Maglione et al., 2010). For a detailed numeric representation, see Tables 2 and 3.
Table 2.
Quantification of dye coupling in the cerebellar white matter of Cx30−/−/Cx47−/−, Cx30−/−/Cx47+/−, and Cx30+/−/Cx47−/− mice compared to Cx30+/−/Cx47+/− and wild-type controls at P10–P15
| Cerebellum | Wild type | Cx30+/−/Cx47+/− | Cx30−/−/Cx47+/− | Cx30+/−/Cx47−/− | Cx30−/−/Cx47−/− |
|---|---|---|---|---|---|
| Networks of coupled cells (%) | 54 (n = 35) | 83 (n = 24) | 36 (n = 33)### | 14 (n = 21)*,*** | 68 (n = 37) |
| Extent of tracer spread (in μm) | 150 (80–226) (n = 19) | 149 (81–224; n = 20) | 61 (47–127; n = 12)# | 49 (31–79; n = 3) | 151 (96–203; n = 25) |
| Number of coupled cells per network | 14 (8–36) | 13 (8–25) | 8 (2–18) | 5 (4–6) | 15 (7–21) |
| CNPase+ cells per network (%) | 100 (87–100) | – | – | – | – |
| eGFP+ cells per network (%) | – | 100 (86–100) | 100 (100–100) | 100 (100–100) | 100 (100–100)††† |
| GFAP+ cells per network (%) | 0 (0–13) | 0 (0–14) | 0 (0–0) | 0 (0–0) | 0 (0–0)‡‡‡ |
Networks are shown as percentages of biocytin-injected oligodendrocytes found coupled to at least one adjacent cell. Data regarding the extent of tracer spread are reported as median (25th–75th percentiles). Quantification of the number of coupled cells is indicated as median (25th–75th percentiles). Quantification of the population of coupled cells (CNPase+, GFAP+, eGFP+) is indicated as median (25th–75th percentiles). (n), number of experiments.
#p < 0.05, Cx30−/−/Cx47+/− versus Cx30−/−/Cx47−/− (Mann–Whitney U test, Kruskal–Wallis test, p < 0.05); ###p < 0.001 Cx30−/−/Cx47+/− versus Cx30+/−/Cx47+/− (χ2 test).
*p < 0.05, Cx30+/−/Cx47−/− versus wild type (χ2 test); ***p < 0.001 Cx30+/−/Cx47−/− versus Cx30+/−/Cx47+/− and versus Cx30−/−/Cx47−/− (χ2 test).
†††p < 0.001, Cx30−/−/Cx47−/− versus Cx30+/−/Cx47+/− (Mann–Whitney U test; Kruskal–Wallis test, p < 0.01).
‡‡‡p < 0.001, Cx30−/−/Cx47−/− versus wild type and versus Cx30+/−/Cx47+/− (Mann–Whitney U test; Kruskal–Wallis test, p < 0.01).
Table 3.
Quantification of dye coupling in Cx30−/−/Cx47−/−, Cx30−/−/Cx47+/−, and Cx30+/−/Cx47−/− mice compared to Cx30+/−/Cx47+/− and wild-type controls at P10–P15 in the corpus callosum
| Corpus callosum | Wild type | Cx30+/−/Cx47+/− | Cx30−/−/Cx47+/− | Cx30+/−/Cx47−/− | Cx30−/−/Cx47−/− |
|---|---|---|---|---|---|
| Networks of coupled cells (%) | 62 (n = 21) | 53 (n = 15) | 75 (n = 16) | 47 (n = 15) | 74 (n = 19) |
| Extent of tracer spread (μm) | 99 ± 61 (n = 13) | 111 ± 62 (n = 8) | 113 ± 46 (n = 12) | 156 ± 58 (n = 7) | 125 ± 71 (n = 14) |
| Number of coupled cells per network | 15 ± 13 | 14 ± 10 | 13 ± 8 | 14 ± 8 | 11 ± 9 |
| CNPase+ cells per network (%) | 83 (71–92) | 91 (67–98) | 68 (45–87) | 100 (100–100)* | 100 (100–100)*** |
| eGFP+ cells per network (%) | – | 91 (67–98) | 68 (45–87) | 100 (100–100)# | 100 (100–100)### |
| CNPase−/GFAP− cells per network (%) | 5 (0–13) | 0 (0–0) | 0 (0–0)† | 0 (0–0) | 0 (0–0)†† |
| GFAP+ cells per network (%) | 6 (0–12) | 9 (2–33) | 32 (13–55) | 0 (0–0)‡ | 0 (0–0)‡‡,‡‡‡ |
Networks are shown as percentages of biocytin-injected oligodendrocytes found coupled to at least one adjacent cell. Data regarding the extent of tracer spread and the number of coupled cells are reported as the average ± SD. Quantification of the population of coupled cells (CNPase+, eGFP+, CNPase−/GFAP−, GFAP+) is indicated as median (25th–75th percentiles). n, Number of experiments.
*p < 0.05, Cx30+/−/Cx47−/− versus Cx30+/+/Cx47+/+ and Cx30−/−/Cx47+/− (Mann–Whitney U test; Kruskal–Wallis test, p < 0.001); ****p < 0.001, Cx30−/−/Cx47−/− versus wild type, Cx30+/−/Cx47+/−, and Cx30−/−/Cx47+/− (Mann–Whitney U test, Kruskal–Wallis test, p < 0.001).
#p < 0.05, Cx30+/−/Cx47−/− versus Cx30+/−/Cx47+/− and Cx30−/−/Cx47+/− (Mann–Whitney U test; Kruskal–Wallis test, p < 0.001); ###p < 0.001, Cx30−/−/Cx47−/− versus Cx30+/−/Cx47+/− and Cx30−/−/Cx47+/− (Mann–Whitney U test; Kruskal–Wallis test, p < 0.001).
†p < 0.05, Cx30−/−/Cx47+/− versus Cx30+/+/Cx47+/+ (Mann–Whitney U test; Kruskal–Wallis test, p < 0.001); ††p < 0.05, Cx30−/−/Cx47−/− versus Cx30+/+/Cx47+/+ (Mann–Whitney U test; Kruskal–Wallis test, p < 0.001).
‡p < 0.05, Cx30+/−/Cx47−/− versus Cx30−/−/Cx47+/− (Mann–Whitney U test; Kruskal–Wallis test, p < 0.001); ‡‡p < 0.05, Cx30−/−/Cx47−/− versus Cx30+/+/Cx47+/+ (Mann–Whitney U test; Kruskal–Wallis test, p < 0.001); ‡‡‡p < 0.001, Cx30−/−/Cx47−/− versus Cx30+/−/Cx47+/− and Cx30−/−/Cx47+/− (Mann–Whitney U test; Kruskal–Wallis test, p < 0.001).
In cerebellar white matter of wild-type mice, biocytin as revealed by streptavidin-Cy3 labeling filled a network of cells in 54% of the injections (19 of 35 injected cells, 11 mice), while only a single cell was labeled in the remainder experiments. Within a given network, biocytin spread to 14 (8–36; values here and below indicate the 25th–75th percentiles, respectively) neighboring cells, with a tracer extent of 150 μm (80–226 μm, n = 19; Fig. 2A–C,G–I).
Figure 2.

Comparison of intercellular coupling in the cerebellar white matter and corpus callosum of P10–P15 Cx30−/−/Cx47−/−, Cx30−/−/Cx47+/−, and Cx30+/−/Cx47−/− mice compared with Cx30+/−/Cx47+/− and wild-type controls. A, B, In cerebellar white matter of wild-type mice, oligodendrocytes were identified by their typical morphology as revealed by dialysis with the fluorescent dye Alexa 594 (A) and by their membrane currents recorded in response to a series of voltage steps ranging from −170 to +50 mV (50 ms, 10 mV increments) from a holding potential of −70 mV (B). C, Superpositions of sequential confocal stacks indicating a biocytin/streptavidin-Cy3-labeled network. D, E, In Cx30−/−/Cx47−/− mice, oligodendrocytes were identified by their eGFP fluorescence resulting from Cx47 promoter activity (D) before electrophysiological recordings (E). F, Biocytin spread to neighboring cells as revealed by streptavidin-Cy3 labeling. G–I, Quantification of networks in cerebellar white matter of Cx30−/−/Cx47−/−, Cx30−/−/Cx47+/−, and Cx30+/−/Cx47−/− mice compared with Cx30+/−/Cx47+/− and wild-type controls. G, Percentage of injected cells that were coupled to at least one other cell and thereby formed a network versus injected uncoupled cells. The number of coupled oligodendrocytes in Cx30−/−/Cx47−/− mice did not significantly differ from Cx30+/−/Cx47+/− mice and wild-type controls. *p < 0.05; ***p < 0.001. H, Box plot indicating the median (dark line) and 25th and 75th percentiles (upper and lower hinges, respectively) of the number of coupled cells per network. Circles indicate statistical outliers, and asterisks the extremes. No significant reduction in the number of cells participating in the oligodendrocytic network was observed. I, Extent of tracer spread as defined by the largest distance between two somata within a given network. Only Cx30−/−/Cx47+/− mice displayed a significant lower extent of biocytin spread compared to Cx30−/−/Cx47−/− networks (Table 2). #p < 0.05. J–O, Example of a dye-coupling experiment in the corpus callosum of wild-type (J–L) and Cx30−/−/Cx47−/− mice (M–O). Quantification of the number of oligodendrocytes forming networks (P), the number of cells found coupled in a given network (Q), and the extent of biocytin spread (R) did not reveal any significant difference between Cx30−/−/Cx47−/−, Cx30−/−/Cx47+/−, and Cx30+/−/Cx47−/− mice compared to Cx30+/−/Cx47+/− and wild-type controls (Table 3). Scale bars: 10 μm.
For dye-coupling experiments in Cx30+/−/Cx47+/−, Cx30−/−/Cx47+/−, Cx30+/−/Cx47−/−, and Cx30−/−/Cx47−/− mice, oligodendrocytes were identified by their eGFP expression resulting from Cx47 gene activity (Odermatt et al., 2003) before electrophysiological recordings. In Cx30+/−/Cx47+/− mice, 83% of the biocytin injected oligodendrocytes revealed networks consisting of 13 (8–25) neighboring cells with an extent of tracer spread of 149 μm (81–224 μm; 20 of 24 injected cells, seven mice). No significant differences were observed compared to wild-type mice (Fig. 2D–I).
When we injected biocytin into single oligodendrocytes of Cx30−/−/Cx47−/− mice, we found networks of biocytin-positive cells in 68% of the experiments (25 of 37 injected cells, nine mice). The number of oligodendrocytes forming networks in Cx30−/−/Cx47−/− mice did not significantly differ from wild-type or Cx30+/−/Cx47+/− mice. In Cx30−/−/Cx47−/− animals, we found 15 (7–21) biocytin-positive cells coupled within a given network (n = 25) with an extent of tracer spread of 151 μm (96–203 μm), similar to wild-type and Cx30+/−/Cx47+/− mice (Fig. 2G–I).
Unexpectedly, in Cx30−/−/Cx47+/− cerebellar slices, only 36% of the biocytin-filled oligodendrocytes formed networks (12 of 33 cells, 16 mice), which is significantly lower compared to Cx30+/−/Cx47+/− mice (χ2 test, Fisher's exact test, p < 0.001). The 12 networks detected consisted of eight (2–18) biocytin-positive cells, with an extent of tracer spread of 61 μm (47–127 μm), which was significantly different compared to the biocytin spread in Cx30−/−/Cx47−/− networks (Kruskal–Wallis test, p < 0.05; Mann–Whitney test, p < 0.05; Fig. 2G–I). In Cx30+/−/Cx47−/− mice, biocytin injections revealed only 14% oligodendrocytes forming networks, significantly lower than in Cx30+/−/Cx47+/− mice (χ2 test, Fisher's exact test, p < 0.001) and wild-type animals (χ2 test, Fisher's exact test, p < 0.05). Moreover, Cx30+/−/Cx47−/− mice displayed a significant reduction by 79% in oligodendrocytes forming networks compared to Cx30−/−/Cx47−/− animals (χ2 test, Fisher's exact test, p < 0.001). The three networks observed (of 21 injections, 12 mice) consisted of five (4–6) biocytin-positive cells with an extent of tracer spread of 49 μm (31–79 μm), yielding no significant reduction compared to all other genotypes (Fig. 2G–I).
In the corpus callosum of wild-type mice, 62% of the injected oligodendrocytes formed networks consisting, on average, of 15 ± 13 coupled cells and with a mean extent of tracer spread of 99 ± 61 μm (13 of 21 cells, 13 mice; Fig. 2J–L,P–R). In Cx30+/−/Cx47+/− slices, we observed intercellular coupling in 53% of the experiments (8 of 15 cells, 10 mice). In these networks we found a mean value of 14 ± 10 neighboring cells labeled with biocytin, which spread up to 192 μm (111 ± 62 μm average). No significant differences between wild-type and Cx30+/−/Cx47+/− mice were observed (Fig. 2P–R).
When we injected biocytin into single oligodendrocytes in the corpus callosum of Cx30−/−/Cx47−/− mice, we clearly detected networks of biocytin-labeled cells in 74% of the injected oligodendrocytes (14 of 19 cells, 11 mice; Fig. 2M–O). These networks consisted, on average, of 11 ± 9 coupled cells and they had a mean extent of biocytin spread of 125 ± 71 μm. No significant differences were observed in comparison to wild-type and Cx30+/−/Cx47+/− controls (Fig. 2P–R). Similarly, in the corpus callosum of Cx30−/−/Cx47+/− animals, in 75% of the experiments biocytin spread to neighboring cells (13 ± 8 cells found coupled within a given network, 12 of 16, six mice). In these slices, biocytin spread up to 165 μm (113 ± 46 μm average; Fig. 2P–R). In Cx30+/−/Cx47−/− mice, 47% of the injected oligodendrocytes were found coupled to at least one adjacent cell (7 of 15, six mice). However no significant difference in the number of oligodendrocytes forming networks was observed between these groups. Cx30+/−/Cx47−/− networks consisted, on average, of 14 ± 8 biocytin-labeled cells with a mean extent of tracer spread of 156 ± 58 μm, similar to what was observed in wild-type, Cx30+/−/Cx47+/−, Cx30−/−/Cx47−/−, and Cx30−/−/Cx47+/− corpus callosum (Fig. 2P–R). Together, these results indicate that in cerebellar white matter and corpus callosum, lack of both Cx47 and Cx30 does not alter either the number of oligodendrocytes forming networks or the number of cells coupled to the injected oligodendrocyte. Surprisingly, in cerebellar white matter, lack of Cx30 on a heterozygous Cx47 background significantly decreases the number of oligodendrocytes forming networks, which is even more affected by Cx47 deficiency with heterozygous expression of Cx30.
Cx32 expression is increased in cerebella of 14-d-old Cx30/Cx47 double-deficient mice
Due to the unexpected results of the dye-coupling experiments with cerebella of Cx47-deficient and Cx30-deficient mice compared to Cx30/Cx47 dKO mice, we performed sqRT-PCR to determine relative expression levels of the glial connexins Cx43 and Cx32 in cerebella obtained from 14-d-old animals. Expression levels of Cx30+/−/Cx47+/− mice were set to 1 per connexin mRNA, and β-actin expression served as internal standard. Cx30−/−Cx47+/− (1.14 ± 0.14) as well as Cx30+/−Cx47−/− mice (1.24 ± 0.12) showed no significant difference in relative Cx32 mRNA expression compared to Cx30+/−/Cx47+/− (1 ± 0.14) littermates. In contrast Cx30/Cx47 dKO mice showed a 1.76 ± 0.13-fold significantly increased Cx32 expression level compared to Cx30+/−/Cx47+/− mice (p < 0.01) as well as compared to Cx30−/−Cx47+/− and Cx30+/−Cx47−/− mice (p < 0.05) (Fig. 3A).
Figure 3.

Relative mRNA expression of the oligodendrocytic Cx32 and the astrocytic Cx43 were analyzed via semiquantitative RT-PCR on cerebella obtained from 14-d-old mice. A, Cx30−/−/Cx47−/− mice revealed 1.76-fold elevated Cx32 mRNA expression, which was statistical significant compared to Cx30−/−/Cx47+/−, Cx30+/−/Cx47−/−, and Cx30+/−/Cx47+/− littermates. B, Cx43 expression was not significantly affected in Cx30−/−/Cx47+/−, Cx30+/−/Cx47−/−, and Cx30−/−/Cx47−/− mice compared to Cx30+/−/Cx47+/− littermates. The p values were considered to be significant at *p < 0.05, and highly significant at **p < 0.01. n.s., Not significant (p > 0.05).
No significant differences were found in the relative expression of Cx43 mRNA between all genotypes investigated: Cx30+/−/Cx47+/− (1 ± 0.06), Cx30−/−Cx47+/− (1.02 ± 0.08), Cx30+/−Cx47−/− (1.31 ± 0.13), and Cx30−/−Cx47−/− (1.07 ± 0.04) (Fig. 3B).
Oligodendrocyte-to-astrocyte coupling is abolished in cerebellar white matter and corpus callosum of Cx30/Cx47 double-deficient mice (P10–P15)
To identify oligodendrocytes and astrocytes within the networks, biocytin/streptavidin-Cy3 labeling of coupled cells in the cerebellar white matter and corpus callosum was combined with immunostaining for CNPase and GFAP, i.e., markers for oligodendrocytes and astrocytes, respectively (Fig. 4). For a detailed numeric representation, see Table 2 and 3. In wild-type networks (n = 19) of cerebellar white matter, the majority of biocytin-positive cells expressed CNPase (median value: 100%, 87–100%; mean value: 94%), while the population of GFAP-positive cells found coupled had a median value of 0% (0–13%; Fig. 4A–C) and a mean value of 6%.
Figure 4.
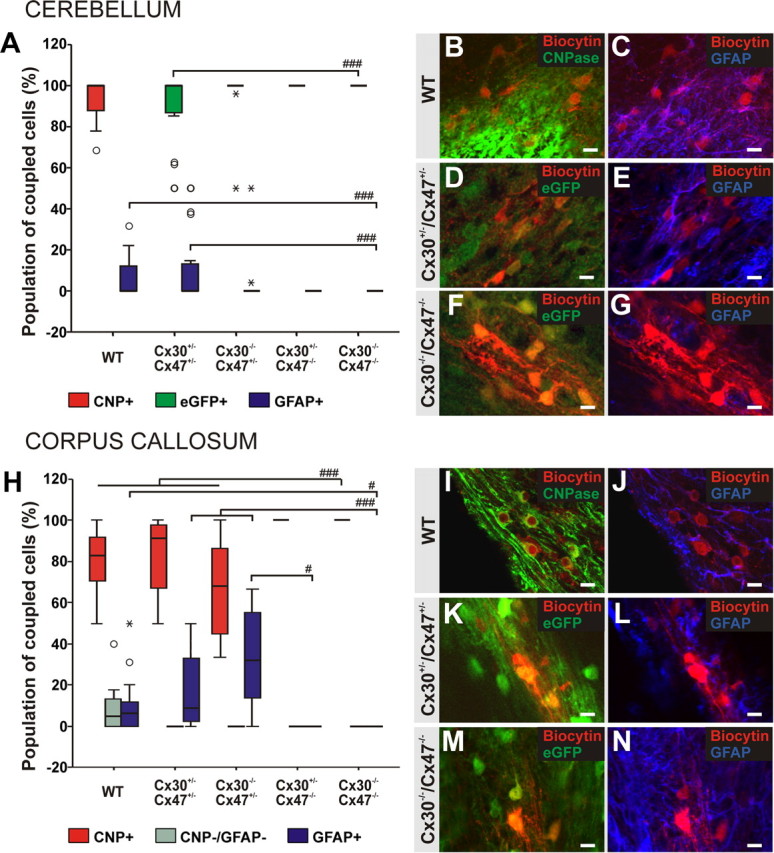
Identification of glial cell types within networks of cerebellar white matter and corpus callosum of P10–P15 Cx30−/−/Cx47−/−, Cx30−/−/Cx47+/−, and Cx30+/−/Cx47−/− mice compared with Cx30+/−/Cx47+/− and wild-type controls. A, Box plot indicating the median (dark line) and 25th and 75th percentiles (upper and lower hinges, respectively) of the population of cells coupled within networks of cerebellar white matter. Circles indicate statistical outliers, and asterisks the extremes. Values of specific glial cell types are reported as percentages of the number of biocytin-positive cells per network. Note that in the cerebellar white matter of Cx30−/−/Cx47−/− mice, all coupled cells were eGFP-positive oligodendrocytes. No biocytin-positive cell expressed the astrocytic marker GFAP, with a significant difference compared to wild-type and Cx30+/−/Cx47+/− mice (Table 2). B, C, Example of cell type identification in cerebellar networks of wild-type animals. Biocytin was detected by streptavidin-Cy3 labeling combined with immunostaining for the oligodendrocytic marker CNPase (B) and for the astrocytic marker GFAP (C). D–G, In Cx30+/−/Cx47+/− and Cx30−/−/Cx47−/− networks, oligodendrocytes were identified by immunostaining for eGFP, which is selectively expressed under control of the Cx47 promoter, to reduce signal-to-noise ratio (D, F). E, A GFAP-positive astrocyte coupled within the network of a Cx30+/−/Cx47+/− mouse. F, G, Example of a network in the cerebellar white matter of Cx30−/−/Cx47−/− mice where all coupled cells were eGFP-positive oligodendrocytes (F). No GFAP-positive astrocytes were found (G). H, Box plot indicates the population of cells coupled within networks of corpus callosum. In Cx30−/−/Cx47−/− mice, all cells filled with biocytin were eGFP-positive oligodendrocytes. No coupled cell expressed the astrocytic marker GFAP, with a significant difference compared to wild-type, Cx30+/−/Cx47+/−, and Cx30−/−/Cx47+/− mice (Table 3). I, J, In the corpus callosum of wild-type mice, coupled oligodendrocytes and astrocytes were identified by immunostaining for CNPase (I) and GFAP (J). K–N, Example of cell type identification within networks of Cx30+/−/Cx47+/− and Cx30−/−/Cx47−/− showing coupled oligodendrocytes selectively expressing eGFP under the Cx47 promoter (K, M). Note the several GFAP-positive astrocytes filled with biocytin recognizable within a network of a Cx30+/−/Cx47+/− mouse (L), while in the network of a Cx30−/−/Cx47−/− animal only eGFP-positive oligodendrocytes are coupled (N). #p < 0.05; ###p < 0.001. Scale bars: 10 μm.
In Cx30+/−Cx47+/−, Cx30−/−/Cx47+/−, Cx30+/−/Cx47−/−, and Cx30−/−/Cx47−/− mice, oligodendrocytes selectively express the reporter protein eGFP under control of the Cx47 promoter. Therefore, we identified the population of coupled cells combining biocytin/streptavidin-Cy3 labeling with immunostaining for eGFP and GFAP in the cerebellar white matter of these mice. Immunolabeling for eGFP was performed to increase the signal-to-noise ratio. In Cx30+/−/Cx47+/− networks, the majority of biocytin-positive cells were eGFP-positive oligodendrocytes (median value, 100%, 86–100%; mean value, 89%; n = 20). GFAP-positive astrocytes colabeled with biocytin/streptavidin-Cy3 were found in 9 of 20 networks (median value, 0%, 0–14%; mean value, 11%). No significant difference in the population of GFAP-positive coupled cells was detected compared to wild-type animals (Fig. 4A,D,E).
In cerebellar white matter of Cx30−/−/Cx47−/− mice, all coupled cells were negative for GFAP and instead positive for eGFP, thus being oligodendrocytes (n = 25). The number of eGFP-positive cells was significantly increased compared to Cx30+/−/Cx47+/− mice (Kruskal–Wallis test, p < 0.01; Mann–Whitney test, p < 0.001). Loss of GFAP-positive astrocytes coupled within a given network of Cx30−/−/Cx47−/− mice was significant compared to wild-type (Kruskal–Wallis test, p < 0.01; Mann–Whitney test, p < 0.001) and Cx30+/−/Cx47+/− animals (Kruskal–Wallis test, p < 0.01; Mann–Whitney test, p < 0.001; Fig. 4A,F,G).
In cerebellar networks of Cx30−/−/Cx47+/− mice (12 networks), the number of coupled, eGFP-positive oligodendrocytes increased to a median value of 100% (100–100%; mean value, 95%). In the cerebellar white matter of these mice, we found a single GFAP-positive astrocyte coupled to an injected oligodendrocyte and to a larger network (as indicated by extreme values in Fig. 4A). However, no significant differences in the population of eGFP-positive oligodendrocytes and GFAP-positive astrocytes were observed compared to Cx30+/−/Cx47+/− mice. In Cx30+/−/Cx47−/− mice, all coupled cells expressed eGFP, and no GFAP-positive cells were found (n = 3). However, oligodendrocyte injections did not reveal significant differences in the proportion of eGFP-positive oligodendrocytes and GFAP-positive cells in Cx30+/−/Cx47−/− compared to Cx30+/−/Cx47+/− mice (Fig. 4A).
To further characterize the population of eGFP-positive cells in cerebellar white matter of Cx30+/−/Cx47+/− and Cx30−/−/Cx47−/− mice, acute slices of animals used for dye-coupling experiments were coimmunostained for the oligodendrocytic marker CNPase and eGFP. No difference was observed in the population of eGFP-positive cells expressing CNPase between Cx30+/−/Cx47+/− (91 ± 3%) and Cx30−/−/Cx47−/− (91 ± 2%) mouse cerebella. Cells were counted on 29 confocal stacks (387.5 × 387.5 μm; data not shown).
In the corpus callosum of wild-type mice, the majority of cells coupled within a given network were CNPase-positive oligodendrocytes (83%, 71–92%; n = 13), and a median value of 6% (0–12%) expressed the astrocytic marker GFAP, while the remaining 5% (0–13%) was negative for both markers (Fig. 4H–J).
To characterize the population of coupled cells in the corpus callosum of Cx30+/−Cx47+/−, Cx30−/−/Cx47+/−, Cx30+/−/Cx47−/−, and Cx30−/−/Cx47−/− mice, we combined biocytin/streptavidin-Cy3 labeling with immunostaining for eGFP, GFAP, and the specific oligodendrocytic marker CNPase. This approach allowed us to directly compare the population of coupled oligodendrocytes between wild-type, Cx30+/−Cx47+/−, Cx30−/−/Cx47+/−, Cx30+/−/Cx47−/−, and Cx30−/−/Cx47−/− networks. In each specific genotype, all eGFP-positive cells filled with biocytin coexpressed CNPase.
In Cx30+/−/Cx47+/− corpus callosum, all coupled cells within a given network expressed either the oligodendrocytic marker CNPase (91%, 67–98%; n = 8) or the astrocytic marker GFAP (9%, 2–33%), yielding no significant difference compared to wild-type animals (Fig. 4H,K,L). The lack of CNPase/GFAP-negative coupled cells was not significantly different compared to wild-type networks.
Similar to what was observed in the cerebellar white matter, identification of the population of coupled cells in Cx30−/−/Cx47−/− corpus callosum revealed that 100% of the biocytin-labeled cells were eGFP-positive oligodendrocytes and additionally expressed CNPase (n = 14). Not a single coupled astrocyte was detected in these networks (Fig. 4H,M,N). The increased proportion of biocytin-positive cells expressing CNPase yielded a significant difference compared to wild-type and Cx30+/−/Cx47+/− controls (Kruskal–Wallis test, p < 0.001; Mann–Whitney test, p < 0.001). Furthermore, loss of GFAP-positive astrocytes participating in a given network was significantly different compared to wild-type (Kruskal–Wallis test, p < 0.001; Mann–Whitney test, p < 0.05) and Cx30+/−/Cx47+/− mice (Kruskal–Wallis test, p < 0.001; Mann–Whitney test, p < 0.001). The lack of CNPase/GFAP-negative cells filled with biocytin yielded a significant difference compared to wild-type animals (Kruskal–Wallis test, p < 0.001; Mann–Whitney test, p < 0.05).
Immunofluorescence analysis of Cx30−/−/Cx47+/− networks showed that in the corpus callosum of these mice, 68% (45–87%; n = 12) of the biocytin-labeled cells were positive for both eGFP and CNPase, while the remaining 32% (13–55%) expressed the astrocytic marker GFAP. No CNPase/GFAP-negative cells were found coupled within a given network with a significant difference compared to wild-type mice (Kruskal–Wallis test, p < 0.001; Mann–Whitney test, p < 0.05). The percentage of eGFP- and CNPase-positive oligodendrocytes coupled within a given network was significantly different compared to Cx30−/−/Cx47−/− animals (Kruskal–Wallis test, p < 0.001; Mann–Whitney test, p < 0.001). Similar to wild-type and Cx30+/−/Cx47+/− corpora callosa, the population of coupled astrocytes was significantly higher compared to Cx30−/−/Cx47−/− networks (Kruskal–Wallis test, p < 0.001; Mann–Whitney test, p < 0.001; Fig. 4H).
As observed in cerebellar white matter, networks in the corpus callosum of Cx30+/−/Cx47−/− mice consisted exclusively of eGFP-positive oligodendrocytes, which also expressed the marker CNPase (n = 7). No biocytin-positive astrocytes were recognized in these networks. The observed increase in CNPase-positive coupled cells differed significantly compared with wild-type and Cx30−/−/Cx47+/− mice (Kruskal–Wallis test, p < 0.001; Mann–Whitney test, p < 0.05). The lack of biocytin-positive astrocytes was significantly different only when compared to Cx30−/−/Cx47+/− mice (Kruskal–Wallis test, p < 0.001; Mann–Whitney test, p < 0.05). In these networks, we did not observe any coupled cell negative for both CNPase or GFAP with no significant difference compared to wild-type mice (Fig. 4H).
Together, these findings indicate that deficiency of either Cx47 or both Cx47 and Cx30 disrupts coupling between oligodendrocytes and astrocytes in the cerebellar white matter and in the corpus callosum of 10- to 15-d-old mice, even though interoligodendrocytic coupling is not affected in Cx30−/−/Cx47−/− mice.
Cx30 expression in white and gray matter tissue
In this study, we focused on the impact of panglial coupling on myelin function and maintenance. Astrocytic Cx30 is expressed mainly in gray matter tissue. Because oligodendrocytes are the myelin-forming cells in the CNS, it was of major interest to clarify whether Cx30 is also found in white matter tissue. Immunofluorescence analyses revealed Cx30-positive puncta in white matter tissue, which were absent in Cx30-deficient mice. Deficiency of Cx47 resulted in an increase in the number of Cx30-positive puncta in the corpus callosum. Cx30-positive signals were found in close proximity to eGFP (Cx47)-positive somata and along myelin sheaths (Fig. 5).
Figure 5.

Immunofluorescence analyses on white and gray matter obtained from 45-d-old male littermates. A–D, Oligodendrocytic eGFP expression in the corpus callosum identified by antibody staining to increase signal-to-noise ratio corresponds to Cx47 promoter activity, since Cx47 coding DNA had been replaced by eGFP cDNA in Cx47-deficient mice (Odermatt et al., 2003). Thus, expression of single eGFP-positive cells is stronger in Cx47−/− relative to Cx47+/− mice. Cx30 deficiency results in a reduction of eGFP-positive cells in the corpus callosum of Cx30−/−/Cx47+/− and Cx30−/−/Cx47−/− mice. E, G, Cx30 immunosignals are predominantly localized in gray matter tissue as illustrated by stained cortex, but punctate immunosignals were also found in white matter tissue. Cx47 deficiency resulted in increased Cx30 immunosignals in white matter tissue of Cx30+/−/Cx47−/− mice compared to Cx30+/−/Cx47+/− animals. F, H, Staining with Cx30 antibodies resulted in weak background signals in Cx30-deficient mice. I–L, Coimmunofluorescence analyses illustrate close proximity of Cx30 and eGFP-positive signals in the corpus callosum. Processes of Cx30-positive cells spread out into the white matter. Scale bar: (in A) A–L, 50 μm.
Numbers of Olig2-positive cells were reduced in 14-d-old Cx30/Cx47 double-deficient mice
Vibratome slices (30 μm thick) obtained from P14 and P28 mice were stained for Olig2. The number of Olig2-positive cells per 0.1 mm2 of white matter tissue was significantly decreased by 27% in cerebella obtained from P14 Cx30−/−/Cx47−/− (263 ± 7) and Cx30+/−/Cx47−/− (264 ± 6) mice compared to Cx30−/−/Cx47+/− (292 ± 7) and Cx30+/−/Cx47+/− (318 ± 8) littermates (Fig. 6A). In the corpus callosum of P14 animals, only Cx30−/−/Cx47−/− mice showed a significant reduction by 11% in the number of Olig2-positive cells compared to Cx30+/−/Cx47+/− mice (140 ± 6 vs 157 ± 4; p = 0.039). These values were not significant compared to Cx30−/−/Cx47+/− (164 ± 7) and Cx30+/−/Cx47−/− (162 ± 10) littermates (Fig. 6C).
Figure 6.

Quantitative analysis of the number of Olig2-positive oligodendrocytes and oligodendrocyte precursors during postnatal development. Counts of Olig2-stained nuclei were evaluated with regard to the area of the cerebellar white matter and the corpus callosum in 30 μm vibratome slices. A, Cx30−/−/Cx47−/− and Cx30+/−/Cx47−/− mice showed significantly reduced numbers of Olig2-positive (Olig2+) oligodendrocytes and their precursors at P14. B, At a later developmental stage (P28), there was no decrease of Olig2-positive cells detectable anymore in the white matter of Cx30−/−/Cx47−/− cerebella. Even more Cx30+/−/Cx47−/− mice showed significantly increased numbers of Olig2-positive cells in cerebellar white matter compared to Cx30+/−/Cx47+/− littermates. C, D, While Cx30−/−/Cx47−/− mice showed significantly reduced numbers of Olig2 cells at developmental stage P14, there was no significant difference regarding numbers of Olig2 cells between Cx30−/−/Cx47−/− and Cx30+/−/Cx47+/− mice 28 d after birth. Neither P14 nor P28 mice deficient for Cx30 or Cx47 (Cx30−/−/Cx47+/− and Cx30+/−/Cx47−/−) showed significantly changed numbers of Olig2-positive cells in the corpus callosum compared to Cx30+/−/Cx47+/− littermates. Error bars represent mean ± SEM. *p < 0.05; ***p < 0.001 (one-way ANOVA).
Twenty-eight-day-old Cx30−/−/Cx47−/− mice did not show significantly altered counts of Olig2-positive cells in cerebellar white matter (152 ± 8) as well as in the corpus callosum (189 ± 5) compared with Cx30−/−/Cx47+/− (cerebellar white matter, 153 ± 12; corpus callosum, 213 ± 10), Cx30+/−/Cx47−/− (cerebellar white matter, 167 ± 4; corpus callosum, 208 ± 7), and Cx30+/−/Cx47+/− littermates (cerebellar white matter, 140 ± 7; corpus callosum, 203 ± 7; Fig. 6B,D). In contrast P28 Cx30+/−/Cx47−/− revealed a significant increase by 19% in number of Olig2-positive cells in cerebellar white matter compared to Cx30+/−/Cx47+/− mice.
Young Cx30/Cx47 double-deficient mice showed vacuole formation in white matter tracts, astrogliosis, and microglia activation
P14 and P28 mice of all four genotypes have further been analyzed regarding MBP, GFAP, and microglial Iba1 expression in the CNS white matter (Fig. 7). P14 mice showed apparent vacuole formation within cerebellar white matter tracts (Fig. 7B,F,J), which was sparser but still evident in the corpus callosum (Fig. 7N,R,V). Apart from vacuole formation, only minor differences were found regarding expression of MBP, Iba1, and GFAP between P14 Cx30−/−/Cx47−/− and Cx30+/−/Cx47+/− mice. Microglia in Cx30−/−/Cx47−/− mice revealed slightly elevated levels of Iba1 expression, but ameboid-shaped microglia could also be found in P14 Cx30+/−/Cx47+/− littermates (Fig. 7E,F).
Figure 7.

A–X, Immunohistochemistry on vibratome sections obtained from 14- and 28-d-old mice revealed vacuole formation at early stages of postnatal myelin development in Cx30/Cx47 double-deficient mice. Apart from the conspicuous vacuole formation in CNS white matter (WM) of Cx30−/−/Cx47+/− mice, stainings on slices obtained from P14 animals revealed no obvious differences in MBP (A, B, M, N) or GFAP (I, J, U, V) expression. A minor increase in Iba1 expression was detected with microglia in Cx30−/−/Cx47−/− compared to Cx30+/−/Cx47+/− mice in cerebellar white matter, but 14-d-old double-heterozygous mice showed ameboid-shaped microglia with elevated Iba1 expression as well (E, F). These differences were even less conspicuous in the corpus callosum (CC) of 14-d-old mice (Q, R). C, D, O, P, At later stages of myelin development, differences in MBP expression became obvious in cerebellar white matter, the corpus callosum, and the cingulum of 28-d-old Cx30−/−/Cx47−/− mice compared to Cx30+/−/Cx47+/− mice, with a reduction of MBP fibers pervading the inner granule cell layer (IGL) and cortex (D, P). H, Activated microglia showed a typical increase of Iba1 expression in cerebella of Cx30−/−/Cx47−/− mice. L, The increase of GFAP-positive cell density indicates mild astrogliosis in the cerebellar white matter of Cx30−/−/Cx47−/− mice. S, T, W, X, There were no differences observed regarding GFAP or Iba1 expression in cingulum and corpus callosum of 28-d-old Cx30−/−/Cx47−/− and Cx30+/−/Cx47+/− mice. ML, Molecular layer. Scale bar: (in A) A–X, 100 μm.
Vibratome sections obtained from 28-d-old Cx30−/−/Cx47−/− mice revealed conspicuous vacuoles in cerebellar white matter as well as in corpora callosa (Fig. 7D,H,L,P,T,X). Compared to Cx30+/−/Cx47+/− (Fig. 7C,D,O,P) as well as Cx30−/−/Cx47+/− and Cx30+/−/Cx47 littermates (data not shown), double-deficient mice showed a disturbed MBP expression pattern and a reduction of MBP-positive myelin fibers. This was accompanied by mild astrogliosis (Fig. 7L) and activation of microglia, indicated by elevated expression levels of microglial Iba1 in cerebellar white matter of Cx30/Cx47 double-deficient mice (Fig. 7H). We did not find obvious differences regarding GFAP and Iba1 expression in corpora callosa of 28-d-old Cx30−/−/Cx47−/− and Cx30+/−/Cx47+/− mice (Fig. 7S,T,W,X)
Three-week-old Cx30/Cx47 double-deficient mice revealed thinner myelin sheaths
We then tested for alterations in the myelin ultrastructure of Cx30−/−/Cx47−/− mice at P21, before evident ataxia symptoms. At the ultrastructural level, we detected vacuolization in both the cerebellar white matter and corpus callosum of Cx30/Cx47 double-deficient mice. Occasionally, axons were separated from their myelin sheath by a slightly enlarged extracellular space, and loose myelin sheaths were also observed (data not shown).
In cerebellar white matter, P21 Cx30−/−/Cx47−/− mice exhibited a g ratio of 0.86 (0.83–0.88, values indicate the 25th and 75th percentiles, respectively; n = 400), significantly higher than Cx30/Cx47 double-heterozygous mice (0.85, 0.83–0.87; n = 400; Mann–Whitney U test, p < 0.05). Similarly, in the corpus callosum, Cx30−/−/Cx47−/− animals displayed an increased g ratio (0.85 ± 0.04; n = 400) compared to Cx30+/−/Cx47+/− controls of the same age (0.84 ± 0.04; n = 400; Student's t test, p < 0.001; Fig. 8). Thus, this indicates that at P21, Cx30−/−/Cx47−/− mice are characterized by thinner myelin compared to Cx30+/−/Cx47+/− mice.
Figure 8.

Evaluation of electron micrographs revealed thinner myelin in young Cx30−/−/Cx47−/− mice. A, B, Graphs indicate g ratio plotted versus axon diameter. In both corpus callosum (A) and cerebellar white matter (B), 21-d-old Cx30−/−/Cx47−/− mice display a significantly higher g ratio compared to Cx30+/−/Cx47+/− mice (Mann–Whitney U test, p < 0.001 and p < 0.05, respectively). This indicates a significantly reduced thickness of myelin sheaths in both CNS white matter areas of young Cx30−/−/Cx47−/− mice compared to Cx30/Cx47 double-heterozygous littermates.
Together, these results indicate that at P21 Cx30/Cx47 double-deficient mice display signs of hypomyelination and altered myelin structure in cerebellum and corpus callosum.
Myelin abnormalities in adult Cx30/Cx47 double-deficient mice
Brain slices, obtained from adult Cx30−/−/Cx47−/− mice with strong and mild motor impairments were analyzed starting on P45 by immunohistochemical analysis or Black-Gold II myelin staining and compared to brain slices obtained from Cx30−/−/Cx47+/−, Cx30+/−/Cx47−/−, and Cx30+/−/Cx47+/− littermates. Cx30−/−/Cx47+/− and Cx30+/−/Cx47−/− littermates served as controls for single connexin deficiency. Although the severity of the ataxic phenotype was highly variable, apparent vacuolization was detectable by MBP and Black-Gold II myelin staining in white matter tissue of all adult Cx30−/−/Cx47−/− mice investigated. Furthermore, the number of myelinated fibers pervading the cortex and the cerebellar granular layer was decreased in Cx30−/−/Cx47−/− mice (Figs. 9D,F, 10H, 11H). Vacuolation or decrease of myelinated fibers was never found in Cx30+/−/Cx47+/−, Cx30−/−/Cx47+/−, and Cx30+/−/Cx47−/− control littermates at the light-microscopic level (Figs. 9–11).
Figure 9.
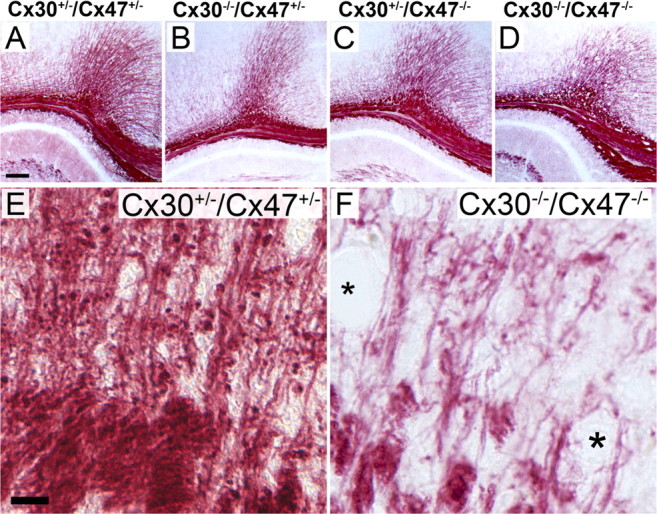
Back-Gold II staining of myelin in slices obtained from 55-d-old mice. A, B, Staining of myelin in corpus callosum of Cx30+/−/Cx47+/− and Cx30−/−/Cx47+/− mice revealed no gross abnormalities. C, At the light-microscopic level, the expected cyst formation in myelin of Cx47-deficient mice (Cx30+/−/Cx47−/−) was not detectable, but mice also deficient in Cx30 (Cx30−/−/Cx47−/−) showed strong vacuole formation in visually all white matter tracts. E, F, Higher magnification of corresponding cingular areas illustrate a decrease in number of myelin fibers in Cx30/Cx47 double-deficient mice. Asterisks indicate vacuoles within or in close proximity of myelin fibers of Cx30−/−/Cx47−/− mice. Scale bars: (in A) A–D, 50 μm; (in E) E, F, 20 μm.
Figure 10.

Cx30 and Cx47 double-deficient mice suffering from spontaneous seizures and strong motor impairments show severe focal lesions within white matter tracts. A–D, Low-magnification images and insets showing higher magnifications of brain slices stained for eGFP-positive cells. A–C, eGFP-positive cells correspond to Cx47-expressing oligodendrocytes and were predominantly localized in the corpus callosum. Scattered eGFP-positive cells were found in the hippocampus and cortex. eGFP-positive processes of oligodendrocytes in slices obtained from Cx30−/−/Cx47−/− mice illustrate increased Cx47 promoter activity of single cells compared to control littermates (insets). D, The Cx30−/−/Cx47−/− mouse taken for investigations had shown severe motor impairment and seizures. A conspicuous loss of eGFP-positive cells was evident within parts of corpus callosum and cortex. E–H, Staining for MBP revealed a loss of white matter at the defined focal area (inset), with strong MBP signals within this region possibly indicating myelin debris (H). Disturbances of MBP myelin stainings were not detected in any of the control littermates (E–G). I–L, GFAP staining of astrocytes was normal in Cx30+/−/Cx47+/−, Cx30−/−/Cx47+/−, and Cx30+/−/Cx47−/− mice, with only few signals in the neocortex proximal to blood vessels. In contrast, Cx30−/−/Cx47−/− mice displayed robust GFAP staining indicating astrogliosis in several parts of the brain including the neocortex, suggesting glial scar formation in severely affected areas. Insets show higher magnification of cortices. M–P, Iba1 staining of the corresponding brain regions revealed equal distribution of microglia in control mice, while stronger staining for Iba1 and accumulation of Iba1-positive cells was found in areas of Cx30−/−/Cx47−/− mouse brain that displayed astrogliosis or lesion characteristics. Some of the cells highly positive for Iba1 displayed an ameboid shape illustrating that these cells were activated microglia (insets). Scale bars: A, E, I, M, 500 μm; insets, A, I, 200 μm; E, 50 μm; M, 25 μm.
Figure 11.

Immunohistochemical analyses on cerebellar slices of 45-d-old mice. A–D, According to the reporter DNA expression from two alleles, in cerebella of Cx30+/−/Cx47−/− and Cx30−/−/Cx47−/− mice, signals for eGFP are stronger compared to those in Cx30+/−/Cx47+/− and Cx30−/−/Cx47+/− mice, resulting in a higher background-to-signal ratio. In double-KO mice, the signals are further increased, which indicates higher activity of the Cx47 promoter in oligodendrocytes of double-deficient mice. In contrast, loss of eGFP-positive cells is evident in these mice compared to control littermates, especially in the granule cell layer (insets). E–H, MBP stainings revealed strong signals in all cerebella observed. Cx30−/−/Cx47−/− mice showed even increased MBP signals, indicated by the higher background-to-signal ratio of the staining. However, the immunosignals appeared condensed in the white matter of cerebellar lobes, and sponge like in the center of the cerebellum. Compared to Cx30+/−/Cx47+/− mice, Cx30+/−/Cx47−/− animals showed a mild reduction in size and number of myelin fibers pervading the granule cell layer in the cerebellum that was not detected in Cx30−/−/Cx47+/− mice (insets). A clear reduction in size and density of these myelin fibers was observed in cerebella obtained from Cx30−/−/Cx47−/− mice. I–L, GFAP-positive astrocytes were found in cerebellar slices obtained from all four genotypes with the typical parallel processes of GFAP-positive Bergmann glia fibers in the molecular layer. L, A conspicuous increase in GFAP signal intensity indicating astrogliosis was observed in the cerebellar white matter of Cx30−/−/Cx47−/− mice. Insets show higher magnifications of cerebellar white matter. M–P, Immunostainings revealed increased Iba1 expression of microglia in cerebella of Cx30−/−/Cx47−/− mice. In the white matter of Cx30+/−/Cx47−/− mice, some microglia also showed increased Iba1 expression, which was not found in cerebella obtained from Cx30+/−/Cx47+/− and Cx30−/−/Cx47+/− mice. Insets show high magnification of white matter tracts. Note that increased Iba1 expression is accompanied by morphological changes of these cells. Scale bars: A, E, I, M, 500 μm; insets, A, M, 50 μm; E, I, 200 μm.
Severely affected Cx30−/−/Cx47−/− mice show focal tissue degradation associated with astrocyte and microglia activation
In addition to myelin vacuolization, Cx30−/−/Cx47−/− mice with obvious motor impairments showed severe focal damage of tissue, in particular at white matter regions (Fig. 10D,H,L,P). Staining against the Cx47 reporter protein eGFP revealed a loss of oligodendrocytes in all brain regions, especially to a notably higher extent within lesions and adjacent tissue. The high background-to-signal ratio of eGFP stainings in Cx30−/−/Cx47−/− mice illustrates an increase of Cx47 promoter activity in oligodendrocytes compared to eGFP-expressing oligodendrocytes in Cx30+/−/Cx47−/− control mice (Fig. 10C,D, insets). MBP staining in Cx30−/−/Cx47−/− mice with obvious motor impairments revealed loss of MBP signals in the periphery and increased MBP staining in the center of focal lesions, which is likely caused by myelin debris (Fig. 10H). An increase in GFAP staining revealed astrogliosis in the cortex proximal to myelin fibers and more severely within white matter lesions (Fig. 10L). Furthermore, Iba1 expression was remarkably increased in microglia/macrophages in close vicinity to the lesions (Fig. 10P, inset). Within the lesion, Iba1 staining appeared laminary, likely reflecting necrotic tissue degradation (Fig. 10P). None of these phenotypic abnormalities, i.e., oligodendrocyte and myelin loss, astrogliosis, or increased Iba1 expression was found in Cx30+/−/Cx47+/−, Cx30−/−/Cx47+/−, or Cx30+/−/Cx47−/− control littermates (Fig. 10A–C,E–G,I–K,M–O).
Forty-five-day-old Cx30−/−/Cx47−/− mice show myelin malformation in all white matter tracts investigated
Analysis of cerebellar tissue revealed a decrease of eGFP-positive cells in the granule cell layer of Cx30−/−/Cx47−/− mice compared to littermate controls (Fig. 11A–D).
Staining against MBP showed irregular myelin organization in white matter of dKO mice, with inconsistent increase or decrease of MBP signals among Cx30−/−/Cx47−/− mice investigated compared with Cx30+/−/Cx47+/− littermates (Fig. 11). Increased GFAP immunolabeling indicating astrogliosis was found in virtually all white matter tracts of Cx30−/−/Cx47−/− mice, accompanied by increased Iba1 expression in microglia/macrophages (Figs. 10L,P, 11L,P).
Behavioral analysis of surviving adult Cx30/Cx47 double-deficient mice
Male mice (6–7 months old) that did not show obvious ataxia or seizures were further analyzed regarding behavioral alterations.
Open-field exploration and behavioral habituation
Animals of all four groups showed reductions in locomotor and rearing activity across the three trials in the open field (main effect of trials, locomotion, F(2,62) = 29.07, p < 0.000001; rearings, F(2,62) = 28.82, p < 0.000001, repeated-measures ANOVA; Figure 12A,B). No significant main effects of genotype or genotype by trial interaction for the locomotion or rearings parameters were detected (p values > 0.05), indicating unaffected habituation in the open field.
Preplanned focused comparisons revealed similar levels of locomotion (p > 0.05) but significantly reduced rearing activity in the homozygote Cx30−/−/Cx47−/− mice compared to heterozygous Cx30+/−/Cx47+/− controls (p = 0.028, LSD test). The reduced rearing activity of the Cx30−/−/Cx47−/− mice is not caused by knock-out of either Cx30 or Cx47 alone, since Cx30+/−/Cx47−/− and Cx30−/−/Cx47+/− mice had no significant impact on rearing activity compared to the Cx30+/−/Cx47+/− mice (p values >0.05). Further comparisons between double Cx30−/−/Cx47−/− and the single knock-out groups revealed significant differences relative to Cx30+/−/Cx47−/− (p = 0.047) but not Cx30−/−/Cx47+/− mice (p > 0.05). These results suggest that rearing activity is only decreased with Cx30 and Cx47 double-deficient mice.
Novelty-induced continuous spontaneous spatial alternation
In the Y maze, the four groups did not differ significantly in terms of total arm entries accumulated over the 5 min test or regarding the total number of triples exerted across the first 20 arm entries made (Fig. 12C–E). All four groups showed significant continuous spontaneous spatial alternation performance (Cx30−/−/Cx47−/−, t(10) = 10.49, p = 0.000001; Cx30−/−/Cx47+/−, t(6) = 4.08, p = 0.007; Cx30+/−/Cx47−/−, t(8) = 4.71, p = 0.002; Cx30+/−/Cx47+/− controls, t(9) = 5.35, p = .0004, single-group t test). Preplanned focused comparisons revealed a similar number of triplets (p > 0.05, LSD test), but significantly reduced total number of arm entries in the Cx30−/−/Cx47−/− mice compared to Cx30+/−/Cx47+/− controls (p = 0.011). As for the rearing parameter in the open field, the reductions in arm entries of Cx30−/−/Cx47−/− mice are unlikely to be due to the homozygous knock-out of either Cx30 or Cx47 alone, since Cx30+/−/Cx47−/− and Cx30−/−/Cx47+/− mice per se had no significant effect on arm entries (p values >0.05). These data suggest that Cx30−/−/Cx47−/− mice show reduced motor activity in the Y maze but nevertheless intact spatial short-term working memory.
One-trial object recognition
The total time spent exploring the two objects during the test and the sample trials (p values >0.05, one-way ANOVA) were not significantly different between groups (Fig. 12F–H). There was no significant difference between the four groups in the novel object preference ratios (p > 0.05, one-way ANOVA). The preplanned focused comparison of the novel object preference ratios between the Cx30−/−/Cx47−/− mice and the Cx30+/−/Cx47+/− controls did not reveal a significant difference (p > 0.05, LSD test). Only the Cx30+/−/Cx47+/− control mice (t(8) = 2.60, p = 0.031, single-group t test; Fig. 12H) and the Cx30+/−/Cx47−/− mice (t(8) = 2.361, p = 0.046) showed one-trial object recognition above the chance level assessed 60 min after the sample trial. The novel object preference ratios of both the Cx30−/−/Cx47−/− and the Cx30−/−/Cx47+/− mice were not significantly different from chance level (p values >0.05).
Motor coordination learning and long-term motor memory
In the rotarod, the mice of the four groups significantly improved their motor coordination performance across the nine acquisition trials (main effect of trials, F(8, 256) = 25.62, p < 0.000001, repeated-measures ANOVA; Fig. 12I). There was a significant main effect of genotype (F(3,32) = 2.92, p = 0.0492) but no significant genotype by trials interaction (p > 0.05).
Preplanned focused comparisons revealed significantly worse motor coordination performance of Cx30−/−/Cx47−/− mice compared to Cx30+/−/Cx47+/− controls (p = 0.019, LSD test). There were no significant differences between the Cx30+/−/Cx47+/− controls and the other two groups (p > 0.05), suggesting that the single knock-outs per se had no significant effect on rotarod performance during the acquisition stage (p values >0.05).
Next, we asked whether the groups might differ in terms of motor long-term memory after a retention interval of 7 d. There was a significant main effect of trials (F(2, 64) = 5.46, p = 0.006, repeated-measures ANOVA) and genotype (F(3,32) = 3.83, p = 0.019), but no significant genotype by trial interaction (p > 0.05). Preplanned focused comparisons revealed significantly worse motor coordination performance with Cx30−/−/Cx47−/− (p = 0.005, LSD test) and Cx30−/−/Cx47+/− mice (p = 0.009) compared to double-heterozygote Cx30+/−/Cx47+/− controls. There was only a trend for a statistical difference in long-term retention performance between the Cx30+/−/Cx47−/− mice and the Cx30+/−/Cx47+/− controls (p = 0.069). Given that the Cx30−/−/Cx47−/− mice already showed impaired motor coordination learning compared to the Cx30+/−/Cx47+/− controls, the impairment seen in Cx30−/−/Cx47−/− mice after a retention interval of 1 week cannot be interpreted in terms of a long-term motor memory deficit, but rather suggests that different baseline positions have generated this effect.
Adult surviving Cx30/Cx47 double-deficient mice exhibit severe vacuolization and thin myelin sheaths in CNS white matter
To determine structural abnormalities in myelin tracts of adult Cx30/Cx47 double-deficient mice lacking severe motor impairment and seizures, we examined CNS white matter areas by light and electron microscopy at P80–P90. Semithin sections of Cx30−/−/Cx47−/− mice revealed extensive pathology of the white matter tracts analyzed characterized by pronounced vacuolization and thin myelin sheaths in both cerebellar white matter and corpus callosum (Fig. 13).
Figure 13.

White matter pathology in cerebellum and corpus callosum of P80–P90 Cx30−/−/Cx47−/− mice. A, B, Toluidine blue-stained 2 μm epoxy sections of tissues revealed severe vacuolization of cerebellar white matter in Cx30−/−/Cx47−/− mice compared to Cx30+/−/Cx47+/− controls. C, D, Ultrathin sections of cerebellar white matter revealed vacuoles located at the outer layer of myelin in Cx30−/−/Cx47−/− mice (asterisks) that were not observed in Cx30+/−/Cx47+/− animals. E, An oligodendrocyte identified by nuclei with clumped heterochromatin and electron-dense cytoplasm in the corpus callosum of Cx30+/−/Cx47+/− animals. F, Electron micrograph shows vacuoles (asterisks) accompanied by unfolded myelin in the corpus callosum of Cx30−/−/Cx47−/− mice. G, H, Graphs indicate g ratio plotted versus axon diameter. In both corpus callosum (G) and cerebellar white matter (H), Cx30−/−/Cx47−/− mice display a significantly higher g ratio compared to Cx30+/−/Cx47+/− mice (Mann–Whitney U test, p < 0.001). This indicates a significantly reduced thickness of myelin sheaths in both CNS white matter areas of adult Cx30−/−/Cx47−/− mice compared to Cx30/Cx47 double-heterozygous littermates. Scale bars: A, B, 100 μm; C–F, 1 μm.
Ultrastructural analysis revealed that a large number of vacuoles were located at the outer layer of myelin. We also observed axons still myelinated but separated from their remaining myelin sheaths by a remarkably enlarged extracellular space (Fig. 14). Sporadically, myelin structure abnormalities were found accompanied by loose myelin sheaths, indicating failure in myelin compaction.
Figure 14.

Electron micrographs of white matter pathology in corpus callosum of P80–P90 Cx30−/−/Cx47−/− mice. A, C, Ultrathin sections depicting oligodendrocyte vacuolation within white matter of corpus callosum. Oligodendrocytes are identified by their nuclei with clumped heterochromatin and electron-dense cytoplasm. A, An oligodendrocyte containing numerous membrane-bound vacuoles within its cytoplasm. B, Electron micrograph shows vacuolated nerve fibers (black arrows) and unfolded myelin. D, An axon still myelinated (white arrowheads) separated from its remaining myelin sheaths by a remarkably enlarged extracellular space (asterisk). Scale bars: 1 μm.
Quantification of myelin sheath thickness and axon diameter was used to calculate the g ratio, defined as ratio between axon diameter and outer diameter of the myelinated fiber. In the cerebellar white matter, Cx30/Cx47 double-deficient mice displayed a significantly higher g ratio (0.91, 0.89–0.93; n = 400) compared with Cx30/Cx47 double-heterozygous mice (0.82, 0.79–0.85; n = 400; Mann–Whitney U test, p < 0.001). In the corpus callosum, Cx30/Cx47 double-deficient animals also exhibited significantly thinner myelin sheaths compared to double-heterozygous mice as indicated by the median value of the g ratio (0.86, 0.83–0.89 vs 0.81, 0.78–0.84, respectively; Mann–Whitney U test, p < 0.001). Figure 13 illustrates g ratio values plotted versus axon diameter in CNS white matter areas of Cx30/Cx47 double-deficient mice and double-heterozygous animals. These results indicate that in both CNS white matter areas analyzed, surviving Cx30/Cx47 double-deficient mice have a significantly reduced myelin sheath thickness compared to Cx30/Cx47 double-heterozygous animals. For a summary of results, see Table 4.
Table 4.
Summarized functional, histological and behavioral results of this study
| Genotype vs Cx30+/−/Cx47+/− |
|||
|---|---|---|---|
| Cx30−/− /Cx47+/− | Cx30+/− /Cx47−/− | Cx30−/−/Cx47−/− | |
| Functional experiments P10–P15 | |||
| Cerebellum | |||
| Networks vs uncoupled oligodendrocyte (injected oligodendrocyte) | Decreased | Decreased | − |
| Amount of eGFP+ oligodendrocytes coupled | − | − | Increased to 100% |
| Amount of GFAP+ astrocytes coupled | − | − | Decreased to none |
| Corpus callosum | |||
| Amount of CNP + oligodendrocytes coupled | − | − | Increased to 100% |
| Amount of GFAP + astrocytes coupled | − | − | Decreased to none |
| Gene expression (P14) | |||
| Cx32 (cerebellum) | − | − | Increased |
| Histological experiments | |||
| Number of Olig2 + cells | |||
| Cerebellum (P14) | − | Decreased | Decreased |
| Cerebellum (P28) | − | Increased | − |
| Corpus Callosum (P14) | − | − | Decreased |
| Vacuole formation in cerebellar myelin (P14) | − | Few | Frequent |
| Vacuole formation in corpus callosum (P14) | − | − | Few |
| Vacuole formation in cerebellar myelin and corpus callosum (P21, P28, adult mice) | − | − | Frequent |
| Myelin fibers (P28, adult mice) | − | − | Decreased in number |
| Myelin sheaths (P21, adult mice) | − | − | Thinner |
| Activated microglia (P28) | − | − | Cerebellum |
| Astrogliosis (P28) | − | − | Cerebellum |
| Activated microglia (adult mice) | − | − | CNS white matter tracts |
| Astrogliosis (adult mice) | − | − | CNS white matter tracts |
| Focal lesion (adult mice) | − | − | Occasionally in white matter tracts |
| Behavioral experiments | |||
| Open-field | |||
| Rearings | − | − | Decreased |
| Spatial alternation | |||
| Entries | − | − | Decreased |
| Novel object recognition | |||
| Ratios | Impaired | − | Impaired |
| Rotarod | |||
| Acquisition | − | − | impaired |
| Retention | Impaired | − | Impaired |
Dash indicates no significant difference.
Discussion
This study provides the first direct evidence that deletion of Cx47 and Cx30 results in loss of functional oligodendrocyte to astrocyte gap junctional coupling as well as in myelin pathology in young and adult mice. We have shown that A/O coupling mediated by gap junction channels containing Cx47 and Cx30, respectively, is essential for proper myelin function and maintenance in the CNS.
Several studies have demonstrated previously the importance of glial connexins for myelin function, development, and maintenance. Mutations of the GJC2 gene encoding human Cx47 cause the hypomyelinating leucodystrophy Pelizaeus–Merzbacher-like disease, whereas mutations in the GJB1 gene encoding Cx32 result in the demyelinating neuropathy X-linked Charcot-Marie-Tooth disease, which can be associated with CNS abnormalities (Uhlenberg et al., 2004; Kleopa and Scherer, 2006).
Previous reports suggested functional redundancy of Cx32 and Cx47 gap junction channels, since double deficiency of both connexins resulted in severe myelin alterations and death, while loss of only one of these connexins led to only mild phenotypic alterations in mice (Menichella et al., 2003; Odermatt et al., 2003). However, immunogold electron-microscopic and immunofluorescence analyses suggested distinct functional roles for Cx32 and Cx47, since both connexins showed different cellular localizations. Whereas Cx47 was mainly located at cell somata, Cx32 was found within myelin sheaths forming autologous gap junction channels and, in addition, at outer myelin sheaths (Kamasawa et al., 2005).
Here we show that loss of Cx47 combined with loss of astrocytic Cx30 cannot be compensated by oligodendrocytic Cx32 and astrocytic Cx43 for maintaining astrocyte-to-oligodendrocyte coupling. Thus, although there may be a partial redundancy of Cx47 and Cx32 function, our data corroborate that both channels accomplish distinct functions as well within panglial networks in vivo.
To determine whether the observed phenotypic abnormalities of double-deficient mice can be attributed to the distinct deletion of Cx30 or Cx47, we used Cx30−/−/Cx47+/− and Cx30+/−/Cx47−/− mice as controls in addition to heterozygous Cx30+/−/Cx47+/− littermates.
In young Cx30−/−/Cx47+/− and Cx30+/−/Cx47−/− mice, deletion of Cx30 or Cx47 already resulted in a decrease of oligodendrocytes forming networks, but strong phenotypic alterations were not seen in adult single KO littermates, i.e., Cx30−/−/Cx47+/− and Cx30+/−/Cx47−/− mice. The decreased number of Olig2-positive cells in cerebella of Cx30+/−/Cx47−/− mice was not accompanied by the severe vacuole formation observed with Cx30−/−/Cx47−/− mice, and, as described previously, myelin pathology of young mice with loss of Cx47 function was compensated in adult mice (Tress et al., 2011). Unexpectedly, a decrease of interoligodendrocytic coupling or number of oligodendrocytes forming networks was not found in dKO littermates, which suggests compensatory effects, possibly caused by the increased Cx32 expression in these mice. Furthermore, the significant increase in the extent of tracer spread observed with Cx30−/−/Cx47−/− compared to Cx30−/−/Cx47+/− mice likely results from elevated expression levels of Cx32 combined with the subcellular localization of the protein at oligodendrocyte processes (Kamasawa et al., 2005). More importantly, deletion of both Cx30 and Cx47 resulted in loss of oligodendrocyte to astrocyte coupling in white matter tissue of 10- to 15-d-old mice accompanied by vacuole formation, but obvious myelin lesions and death commenced only later in development, i.e., at ∼P42 in double-deficient mice. These data suggest that although necessary for proper myelin development, the formation of panglial networks becomes even more important at later developmental stages with regard to myelin maintenance and function. Accordingly, vacuolation and early mortality started between 5 and 16 weeks of age, respectively, with Cx32/Cx43 dKO mice (Magnotti et al., 2011b). Since Cx30/Cx32 and Cx43/Cx47 channels were functional in cell culture experiments, Cx32/Cx43 dKO mice are the counterparts, regarding loss of A/O coupling, to the Cx30/Cx47 dKO mice investigated in this study. In contrast to Cx32/Cx43 dKO mice, vacuole formation was evident 2 weeks after birth with Cx30/Cx47 dKO mice, but only ∼40% of these animals died between 6 and 13 weeks postnatally, indicating that there must be still some functional differences with the connexins remaining for A/A (i.e., Cx43 or Cx30) and O/O (i.e., Cx47 or Cx32) coupling.
The observation that not all Cx30−/−/Cx47−/− mice died in the critical time period between P42 and P90 suggests that loss of Cx30 and Cx47 function is a precondition but not the only cause for death of these mice. Differences of individual habituation, induced upon stress or activity rather than genetic effects may cause differences in death and survival times, since mild and strong phenotypic alterations including death were found among littermates of the Cx30−/−/Cx47−/− genotype. The role of panglial networks for ion homeostasis, especially concerning K+ siphoning upon neuronal activity, was discussed previously (Menichella et al., 2006; Rash, 2010). Osmotic dysregulation or focal hypoxic conditions may cause the lesions found in severely affected Cx30−/−/Cx47−/− mice, and thus are likely the cause of death. Astrocytic Cx43 was described to contribute to the propagation of stress signals from cell to cell after ischemic brain injury, and Cx30 was found to be highly regulated in the hippocampus after hypoxic conditions in young mice, while Cx43 expression remained unchanged (Frantseva et al., 2002; Zeinieh et al., 2010). Additional studies on regulation of gap junction channels under hypoxic conditions revealed dephosphorylation of Cx43 and loss of intercellular coupling in cultured astrocytes (Li and Nagy, 2000). In Cx30/Cx47-deficient mice, the fine regulation of Cx30 channels after hypoxia is not operative, and a potential closure of Cx43 channels between astrocytes under these conditions might result in increased lesion size in Cx30−/−/Cx47−/− mice. Furthermore, rapid correction of hyponatremia (sodium deficit) results in osmotic demyelinative lesions in humans, preferentially in the central pons. Osmotically induced demyelination is accompanied by microglia activation, which has detrimental effects on lesion size and results in severe colliquative necrosis (Norenberg et al., 1982; Takefuji et al., 2007). It seems probable that impaired homeostasis due to loss of both Cx30 and Cx47 causes white matter lesions and that microglia activation has secondary detrimental effects on the affected tissue.
Apart from the variable occurrence of focal lesions, all double-KO mice showed cyst formation, loss of oligodendrocytes, and astrogliosis in white matter tracts, possibly caused by insufficient K+ siphoning and improper ion homeostasis. Behavioral analyses on surviving adult mice indicate that double deficiency of both Cx30 and Cx47 reduces general motor activity in terms of rearings in an open field and arm entries in a Y maze, and affects motor coordination performance as evidenced by impairments in the acquisition of the rotarod task. There were no significant differences between the Cx30+/−/Cx47+/− controls and any of the single knock-out littermates, suggesting that the combined knock-out of both Cx30 and Cx47 compromises the normal function of motor systems so that it cannot be compensated by other connexins such as Cx32 and Cx43. Another finding of the present study is that spatial working memory is intact in the double- as well as single-knock-out control mice, while one-trial object recognition after a retention interval of 1 h might be impaired in Cx30−/−/Cx47−/− and Cx30−/−/Cx47+/− mice, possibly due to the loss of Cx30. There were no significant differences between the four genotypes tested regarding the total time spent exploring the two objects during the sample and test trials, suggesting that noncognitive motivational, motor, or sensory deficits have not significantly interfered with the performance in the task. Nevertheless, one has to consider that the impaired performance of these mice could be due to less obvious motivational, motor, or sensory problems (Crawley, 2008). For the future it might be interesting to study whether the Cx30−/−/Cx47−/− and Cx30−/−/Cx47+/− mice are impaired in the one-trial inhibitory avoidance task. This test is known to be less sensitive to motor impairments and has been used to demonstrate preserved learning and memory functions in a mouse model of Parkinson disease (De Leonibus et al., 2007).
In contrast to Cx30−/−/Cx47−/− mice, astrocytic Cx30/Cx43 double-KO mice show only mild myelin disturbances (Lutz et al., 2009). Furthermore, Cx30/Cx43 dKO mice exhibit attenuated astrocytic to oligodendrocytic coupling and are deprived of interastrocytic coupling in the hippocampus (Wallraff et al., 2006; Maglione et al., 2010). Interestingly, loss of both astrocytic connexins did not lead to loss of A/O coupling in the white matter of Cx30/Cx43 double-deficient mice, possibly due to incomplete GFAP-Cre mediated deletion of Cx43 (Requardt et al., 2009). However, GFAP-Cre-mediated deletion of Cx43 in Cx32/Cx43 dKO resulted in myelin vacuolation and early death, but Cx47/Cx43 dKO mice did not show apparent phenotypic abnormalities (Magnotti et al., 2011b). Thus, loss of A/O coupling in combination with loss of either Cx47- or Cx32-mediated interoligodendrocytic coupling is the cause for severe myelin vacuolation in Cx30/Cx47 dKO as well as in Cx32/Cx43 dKO mice.
Together, our data show that functional astrocyte-to-oligodendrocyte coupling can be abrogated by deletion of oligodendrocytic Cx47 and astrocytic Cx30. Furthermore, astrocyte-to-oligodendrocyte coupling is required for proper myelin development, function, and maintenance, and cannot be compensated by oligodendrocytic network formation by Cx32 gap junction channels. Thus, Cx30 and Cx47 double-deficient mice can help us to gain further insights into the functional differences of glial connexins.
Footnotes
This work was supported by German Research Foundation (DFG) Grant SFB 665 (H.K.). In addition, work in the Bonn laboratory was supported by DFG Grants Wi270/32-1 and SFB 645,B1 (K.W.). T.P. was supported by SFFR (State Fund of Fundamental Research, Ukraine) Grant F46.2/001. M.T. was supported by DFG Grants SFB/TR3, N01, C9 and SPP1172 TH 1350/1-1, and European Community Grant FP7-202167 NeuroGLIA. Work in the Düsseldorf laboratory was supported by DFG Grant DE1149/4-1 (E.D.). We thank Petra Kussmann, Melanie Jokwitz, and Christine Siegmund for their excellent technical assistance in the Bonn laboratory. In addition, we thank Karin Heufelder for the excellent work in genotyping all mice used in the Berlin laboratory.
The authors declare no competing financial interests.
References
- Ahn M, Lee J, Gustafsson A, Enriquez A, Lancaster E, Sul JY, Haydon PG, Paul DL, Huang Y, Abrams CK, Scherer SS. Cx29 and Cx32, two connexins expressed by myelinating glia, do not interact and are functionally distinct. J Neurosci Res. 2008;86:992–1006. doi: 10.1002/jnr.21561. [DOI] [PMC free article] [PubMed] [Google Scholar]
- Altevogt BM, Paul DL. Four classes of intercellular channels between glial cells in the CNS. J Neurosci. 2004;24:4313–4323. doi: 10.1523/JNEUROSCI.3303-03.2004. [DOI] [PMC free article] [PubMed] [Google Scholar]
- Crawley JN. Behavioral phenotyping strategies for mutant mice. Neuron. 2008;57:809–818. doi: 10.1016/j.neuron.2008.03.001. [DOI] [PubMed] [Google Scholar]
- De Leonibus E, Pascucci T, Lopez S, Oliverio A, Amalric M, Mele A. Spatial deficits in a mouse model of Parkinson disease. Psychopharmacology (Berl) 2007;194:517–525. doi: 10.1007/s00213-007-0862-4. [DOI] [PubMed] [Google Scholar]
- Frantseva MV, Kokarovtseva L, Naus CG, Carlen PL, MacFabe D, Perez Velazquez JL. Specific gap junctions enhance the neuronal vulnerability to brain traumatic injury. J Neurosci. 2002;22:644–653. doi: 10.1523/JNEUROSCI.22-03-00644.2002. [DOI] [PMC free article] [PubMed] [Google Scholar]
- Giaume C, Theis M. Pharmacological and genetic approaches to study connexin-mediated channels in glial cells of the central nervous system. Brain Res Rev. 2010;63:160–176. doi: 10.1016/j.brainresrev.2009.11.005. [DOI] [PubMed] [Google Scholar]
- Haas S, Brockhaus J, Verkhratsky A, Kettenmann H. ATP-induced membrane currents in ameboid microglia acutely isolated from mouse brain slices. Neuroscience. 1996;75:257–261. doi: 10.1016/0306-4522(96)00270-9. [DOI] [PubMed] [Google Scholar]
- Kamasawa N, Sik A, Morita M, Yasumura T, Davidson KG, Nagy JI, Rash JE. Connexin-47 and connexin-32 in gap junctions of oligodendrocyte somata, myelin sheaths, paranodal loops and Schmidt-Lanterman incisures: implications for ionic homeostasis and potassium siphoning. Neuroscience. 2005;136:65–86. doi: 10.1016/j.neuroscience.2005.08.027. [DOI] [PMC free article] [PubMed] [Google Scholar]
- Kleopa KA, Scherer SS. Molecular genetics of X-linked Charcot-Marie-Tooth disease. Neuromolecular Med. 2006;8:107–122. doi: 10.1385/nmm:8:1-2:107. [DOI] [PubMed] [Google Scholar]
- Kleopa KA, Orthmann JL, Enriquez A, Paul DL, Scherer SS. Unique distributions of the gap junction proteins connexin29, connexin32, and connexin47 in oligodendrocytes. Glia. 2004;47:346–357. doi: 10.1002/glia.20043. [DOI] [PubMed] [Google Scholar]
- Li WE, Nagy JI. Connexin43 phosphorylation state and intercellular communication in cultured astrocytes following hypoxia and protein phosphatase inhibition. Eur J Neurosci. 2000;12:2644–2650. doi: 10.1046/j.1460-9568.2000.00162.x. [DOI] [PubMed] [Google Scholar]
- Lutz SE, Zhao Y, Gulinello M, Lee SC, Raine CS, Brosnan CF. Deletion of astrocyte connexins 43 and 30 leads to a dysmyelinating phenotype and hippocampal CA1 vacuolation. J Neurosci. 2009;29:7743–7752. doi: 10.1523/JNEUROSCI.0341-09.2009. [DOI] [PMC free article] [PubMed] [Google Scholar]
- Maglione M, Tress O, Haas B, Karram K, Trotter J, Willecke K, Kettenmann H. Oligodendrocytes in mouse corpus callosum are coupled via gap junction channels formed by connexin47 and connexin32. Glia. 2010;58:1104–1117. doi: 10.1002/glia.20991. [DOI] [PubMed] [Google Scholar]
- Magnotti LM, Goodenough DA, Paul DL. Functional heterotypic interactions between astrocyte and oligodendrocyte connexins. Glia. 2011a;59:26–34. doi: 10.1002/glia.21073. [DOI] [PMC free article] [PubMed] [Google Scholar]
- Magnotti LM, Goodenough DA, Paul DL. Deletion of oligodendrocyte Cx32 and astrocyte Cx43 causes white matter vacuolation, astrocyte loss and early mortality. Glia. 2011b;59:1064–1074. doi: 10.1002/glia.21179. [DOI] [PMC free article] [PubMed] [Google Scholar]
- Menichella DM, Goodenough DA, Sirkowski E, Scherer SS, Paul DL. Connexins are critical for normal myelination in the CNS. J Neurosci. 2003;23:5963–5973. doi: 10.1523/JNEUROSCI.23-13-05963.2003. [DOI] [PMC free article] [PubMed] [Google Scholar]
- Menichella DM, Majdan M, Awatramani R, Goodenough DA, Sirkowski E, Scherer SS, Paul DL. Genetic and physiological evidence that oligodendrocyte gap junctions contribute to spatial buffering of potassium released during neuronal activity. J Neurosci. 2006;26:10984–10991. doi: 10.1523/JNEUROSCI.0304-06.2006. [DOI] [PMC free article] [PubMed] [Google Scholar]
- Nagy JI, Li X, Rempel J, Stelmack G, Patel D, Staines WA, Yasumura T, Rash JE. Connexin26 in adult rodent central nervous system: demonstration at astrocytic gap junctions and colocalization with connexin30 and connexin43. J Comp Neurol. 2001;441:302–323. doi: 10.1002/cne.1414. [DOI] [PubMed] [Google Scholar]
- Nagy JI, Ionescu AV, Lynn BD, Rash JE. Coupling of astrocyte connexins Cx26, Cx30, Cx43 to oligodendrocyte Cx29, Cx32, Cx47: implications from normal and connexin32 knockout mice. Glia. 2003;44:205–218. doi: 10.1002/glia.10278. [DOI] [PMC free article] [PubMed] [Google Scholar]
- Nagy JI, Lynn BD, Tress O, Willecke K, Rash JE. Connexin26 expression in brain parenchymal cells demonstrated by targeted connexin ablation in transgenic mice. Eur J Neurosci. 2011;34:263–271. doi: 10.1111/j.1460-9568.2011.07741.x. [DOI] [PMC free article] [PubMed] [Google Scholar]
- Norenberg MD, Leslie KO, Robertson AS. Association between rise in serum sodium and central pontine myelinolysis. Ann Neurol. 1982;11:128–135. doi: 10.1002/ana.410110204. [DOI] [PubMed] [Google Scholar]
- Odermatt B, Wellershaus K, Wallraff A, Seifert G, Degen J, Euwens C, Fuss B, Büssow H, Schilling K, Steinhäuser C, Willecke K. Connexin 47 (Cx47)-deficient mice with enhanced green fluorescent protein reporter gene reveal predominant oligodendrocytic expression of Cx47 and display vacuolized myelin in the CNS. J Neurosci. 2003;23:4549–4559. doi: 10.1523/JNEUROSCI.23-11-04549.2003. [DOI] [PMC free article] [PubMed] [Google Scholar]
- Orthmann-Murphy JL, Freidin M, Fischer E, Scherer SS, Abrams CK. Two distinct heterotypic channels mediate gap junction coupling between astrocyte and oligodendrocyte connexins. J Neurosci. 2007;27:13949–13957. doi: 10.1523/JNEUROSCI.3395-07.2007. [DOI] [PMC free article] [PubMed] [Google Scholar]
- Rash JE. Molecular disruptions of the panglial syncytium block potassium siphoning and axonal saltatory conduction: pertinence to neuromyelitis optica and other demyelinating diseases of the central nervous system. Neuroscience. 2010;168:982–1008. doi: 10.1016/j.neuroscience.2009.10.028. [DOI] [PMC free article] [PubMed] [Google Scholar]
- Rash JE, Davidson KG, Kamasawa N, Yasumura T, Kamasawa M, Zhang C, Michaels R, Restrepo D, Ottersen OP, Olson CO, Nagy JI. Ultrastructural localization of connexins (Cx36, Cx43, Cx45), glutamate receptors and aquaporin-4 in rodent olfactory mucosa, olfactory nerve and olfactory bulb. J Neurocytol. 2005;34:307–341. doi: 10.1007/s11068-005-8360-2. [DOI] [PMC free article] [PubMed] [Google Scholar]
- Requardt RP, Kaczmarczyk L, Dublin P, Wallraff-Beck A, Mikeska T, Degen J, Waha A, Steinhäuser C, Willecke K, Theis M. Quality control of astrocyte-directed Cre transgenic mice: the benefits of a direct link between loss of gene expression and reporter activation. Glia. 2009;57:680–692. doi: 10.1002/glia.20796. [DOI] [PubMed] [Google Scholar]
- Sadile AG, Pellicano MP, Sagvolden T, Sergeant JA. NMDA and non-NMDA sensitive [L-3H]glutamate receptor binding in the brain of the Naples high- and low-excitability rats: an autoradiographic study. Behav Brain Res. 1996;78:163–174. doi: 10.1016/0166-4328(95)00244-8. [DOI] [PubMed] [Google Scholar]
- Sargiannidou I, Vavlitou N, Aristodemou S, Hadjisavvas A, Kyriacou K, Scherer SS, Kleopa KA. Connexin32 mutations cause loss of function in Schwann cells and oligodendrocytes leading to PNS and CNS myelination defects. J Neurosci. 2009;29:4736–4749. doi: 10.1523/JNEUROSCI.0325-09.2009. [DOI] [PMC free article] [PubMed] [Google Scholar]
- Schmued L, Bowyer J, Cozart M, Heard D, Binienda Z, Paule M. Introducing Black-Gold II, a highly soluble gold phosphate complex with several unique advantages for the histochemical localization of myelin. Brain Res. 2008;1229:210–217. doi: 10.1016/j.brainres.2008.06.129. [DOI] [PubMed] [Google Scholar]
- Takefuji S, Murase T, Sugimura Y, Takagishi Y, Hayasaka S, Oiso Y, Murata Y. Role of microglia in the pathogenesis of osmotic-induced demyelination. Exp Neurol. 2007;204:88–94. doi: 10.1016/j.expneurol.2006.09.025. [DOI] [PubMed] [Google Scholar]
- Teubner B, Michel V, Pesch J, Lautermann J, Cohen-Salmon M, Söhl G, Jahnke K, Winterhager E, Herberhold C, Hardelin JP, Petit C, Willecke K. Connexin30 (Gjb6)-deficiency causes severe hearing impairment and lack of endocochlear potential. Hum Mol Genet. 2003;12:13–21. doi: 10.1093/hmg/ddg001. [DOI] [PubMed] [Google Scholar]
- Tress O, Maglione M, Zlomuzica A, May D, Dicke N, Degen J, Dere E, Kettenmann H, Hartmann D, Willecke K. Pathologic and phenotypic alterations in a mouse expressing a connexin47 missense mutation that causes pelizaeus-merzbacher-like disease in humans. PLoS Genet. 2011;7:e1002146. doi: 10.1371/journal.pgen.1002146. [DOI] [PMC free article] [PubMed] [Google Scholar]
- Uhlenberg B, Schuelke M, Rüschendorf F, Ruf N, Kaindl AM, Henneke M, Thiele H, Stoltenburg-Didinger G, Aksu F, Topaloğlu H, Nürnberg P, Hübner C, Weschke B, Gärtner J. Mutations in the gene encoding gap junction protein alpha 12 (connexin 46.6) cause Pelizaeus-Merzbacher-like disease. Am J Hum Genet. 2004;75:251–260. doi: 10.1086/422763. [DOI] [PMC free article] [PubMed] [Google Scholar]
- Wallraff A, Köhling R, Heinemann U, Theis M, Willecke K, Steinhäuser C. The impact of astrocytic gap junctional coupling on potassium buffering in the hippocampus. J Neurosci. 2006;26:5438–5447. doi: 10.1523/JNEUROSCI.0037-06.2006. [DOI] [PMC free article] [PubMed] [Google Scholar]
- Wasseff SK, Scherer SS. Cx32 and Cx47 mediate oligodendrocyte:astrocyte and oligodendrocyte:oligodendrocyte gap junction coupling. Neurobiol Dis. 2011;42:506–513. doi: 10.1016/j.nbd.2011.03.003. [DOI] [PMC free article] [PubMed] [Google Scholar]
- Zeinieh MP, Talhouk RS, El-Sabban ME, Mikati MA. Differential expression of hippocampal connexins after acute hypoxia in the developing brain. Brain Dev. 2010;32:810–817. doi: 10.1016/j.braindev.2009.11.003. [DOI] [PubMed] [Google Scholar]