

Abstract
Studying cognitive processes underlying synesthesia, a condition in which stimulation of one sensory modality automatically leads to abnormal additional sensory perception, allows insights into the neural mechanisms of normal and abnormal cross-modal sensory processing.
Consistent with the notion that synesthesia results from hyperconnectivity, functional connectivity analysis (adopting independent component analysis and seed-based correlation analysis) of resting-state functional magnetic resonance imaging data of 12 grapheme–color synesthetes and 12 nonsynesthetic control subjects revealed, in addition to increased intranetwork connectivity, both a global and a specific (medial and lateral visual networks to a right frontoparietal network) increase of intrinsic internetwork connectivity in grapheme–color synesthesia. Moreover, this increased intrinsic network connectivity reflected the strength of synesthetic experiences. These findings constitute the first direct evidence of increased functional network connectivity in synesthesia.
In addition to this significant contribution to the understanding of the neural mechanisms of synesthesia, our results have important general implications. In combination with data derived from clinical populations, our data strongly suggest that altered differences in intrinsic network connectivity are directly related to the phenomenology of human experiences.
Introduction
Numbers or letters evoke additional color perceptions in grapheme–color synesthesia, one of the most common forms of synesthesia. Although to date the underlying neural mechanisms remain elusive, it has often been hypothesized that the concomitant perception of a sensation not inherent to the stimulus is caused by an increased connectivity (or hyperconnectivity) between the relevant brain regions (Hubbard and Ramachandran, 2005). During synesthetic experience, neural activity increases in occipital and temporal brain regions involved in grapheme and color processing, but also in parietal and frontal areas involved in binding processes (Weiss et al., 2001, 2005; Nunn et al., 2002; Hubbard and Ramachandran, 2005; Hubbard et al., 2005). In addition to these findings from functional activation studies, morphometric data revealed structural changes in similar brain regions (Rouw and Scholte, 2007, 2010; Jäncke et al., 2009; Weiss and Fink, 2009; Hänggi et al., 2011). These morphometric changes suggest altered connectivity in brain networks of primary sensory and higher cognitive integration areas already in the resting state, i.e., when no synesthesia-inducing stimulus is present. However, the hypothesized hyperconnectivity in synesthesia has so far been mainly explored at the structural level. For example, a recent diffusion tensor imaging study revealed regionally increased structural connectivity in inferior temporal, parietal, and frontal cortices of grapheme–color synesthetes (Rouw and Scholte, 2007).
In this study, we tested whether similar differences also occur in the functional network architecture of the resting synesthetic brain. We therefore investigated intrinsic functional connectivity (FC) of brain networks with resting-state functional magnetic resonance imaging (rs-fMRI). Spontaneous low-frequency fluctuations of the blood-oxygen level-dependent (BOLD) signal can be temporally correlated across functionally related brain areas (Biswal et al., 1995; Fox and Raichle, 2007) and may thereby form intrinsic connectivity networks (ICN). ICNs consistently occur in healthy subjects and show strong correspondence to structural networks (Damoiseaux et al., 2006; Honey et al., 2007). However, deviations from this consistent architecture of intrinsic connectivity networks also occur. Neuropsychiatric patients with altered experiences or impaired cognitive functions, like in schizophrenia or Alzheimer's disease, show characteristic changes of intrinsic FC in several ICNs (Greicius et al., 2004; Jafri et al., 2008; Vercammen et al., 2010; Gour et al., 2011). In analogy, the additional (abnormal) experiences of synesthetes may be reflected in an altered intrinsic FC. Thus, we hypothesized that (1) grapheme–color synesthetes show specific patterns of functional hyperconnectivity at rest and (2) this hyperconnectivity correlates with the consistency of synesthetic experiences. To test these hypotheses, we investigated the intrinsic FC of synesthesia-related brain networks of coherent ongoing neuronal activity with independent component analysis (ICA) (Fox and Raichle, 2007; Biswal et al., 2010; Schölvinck et al., 2010) and with an additional seed-based FC approach for the cytoarchitectonically defined color area V4.
Materials and Methods
Subjects.
In the current study, 12 grapheme–color synesthetes and 12 control subjects without a history of neurological or psychiatric disease were investigated. The two groups were matched for gender (10 female in each group), age [synesthetes: 32.6 ± 9.9 years (mean ± SD); controls: 30.6 ± 5.7 years; t(22) = 0.611, p = 0.55], handedness as assessed by the Oldfield handedness inventory (Oldfield, 1971) (3 subjects with left-hand and 9 subjects with right-hand preference in each group; laterality quotient: synesthetes: 38.7 ± 77.6; controls: 41.3 ± 74; t(22) = −0.084, p = 0.93), and IQ as assessed by the Mehrfachwahl-Wortschatz Intelligence Test type B (Lehrl et al., 1995) (synesthetes: 117.6 ± 10.3; controls: 113.9 ± 11.1; t(20) = 0.817, p = 0.42).
Authenticity of synesthesia was verified by applying a test of consistency (Baron-Cohen et al., 1993) in which synesthetic color experiences for 129 items were retested without warning after at least 6 months (15.2 ± 12.4 months) in all synesthetes (Weiss et al., 2005). This test confirmed the high consistency of the synesthetic color experiences in the 12 grapheme–color synesthetes (rate of consistent responses: 84.8 ± 14.5%). All but one grapheme–color synesthete reported also having phoneme–color synesthesia, i.e., sounds of single phonemes also trigger synesthetic color experiences. The local ethics committee of the Medical Faculty of the Rheinisch-Westfaelische Technische Hochschule) Aachen University approved the study and all subjects gave written informed consent.
fMRI data acquisition.
Subjects were instructed to keep their eyes closed but remain alert and awake during the resting-state measurements in the scanner. Resting-state data were acquired on a 3-tesla MRI System (Trio; Siemens) using a standard echo-planar imaging (EPI) sequence to obtain standard T2*-weighted EPI images with BOLD contrast (field of view, 200 mm; matrix size, 64 × 64; voxel size, 3.1 × 3.1 × 3.0 mm3). A total of 280 functional volumes of 36 3-mm-thick axial slices were collected sequentially with a 0.3 mm gap for each subject within a single scanning session (repetition time, 2.2 s; echo time, 30 ms; total duration, ∼10 min). The first six EPI volumes were discarded to allow for T1 equilibration effects. Standard preprocessing procedures were applied to the remaining 274 EPI images using Statistical Parametric Mapping software (SPM5; Wellcome Department of Imaging Neuroscience, London, UK; http://www.fil.ion.ucl.ac.uk/spm/software/spm5/).
Independent component analysis.
ICA is a method that can be used to decompose fMRI data into spatially independent components, each comprising a spatial map of functionally connected brain regions and an associated time course. In the current study, ICA was used to identify synesthesia-relevant ICNs and to assess differential functional intranetwork and internetwork connectivity in grapheme–color synesthetes and control subjects.
Before the volumes were entered into the ICA, we applied a voxelwise z-transformation (ŷijk(t)) on the time course data yijk(t) by subtracting the mean <yijk> and dividing by the standard deviation σijk: ŷijk(t) = (yijk(t) − <yijk>)/σijk (t is time; indices i, j, k represent the three directions in space). The sensitivity of the multivariate ICA algorithm for correlation of variance between voxels, i.e., functional connectivity, was thereby rendered independent of the original BOLD signal magnitude across subjects (Sorg et al., 2007).
To obtain the most robust and comparable set of independent components from the resting-state fMRI dataset, we performed a spatial group ICA on the combined, concatenated dataset of synesthetes and controls (n = 24) using GIFT software (http://icatb.sourceforge.net/, version 2.0 d) and iteratively ran 30 ICAs using the ICASSO procedure (Himberg et al., 2004). We calculated 25 independent components according to the minimum description length criteria that can be implemented in GIFT (Calhoun et al., 2001). The analysis was performed in three steps (Calhoun et al., 2001): data reduction with principal component analysis (PCA), ICA using the Infomax algorithm on the concatenated dataset of all subjects (including both synesthetes and controls), and finally back-reconstruction of the group independent components into the single-subject space using GICA3 (Erhardt et al., 2011). Each independent component was composed of a spatially independent brain map and an associated time course of ongoing fMRI fluctuations during rest. We selected functionally relevant ICNs from the whole set of independent components by applying a multiple spatial regression analysis against brain templates comprising synesthesia-related brain regions that were created with the anatomy toolbox (Eickhoff et al., 2005). The brain regions assumed to be critically involved in synesthetic experiences were derived from previous functional and structural imaging studies (Nunn et al., 2002; Hubbard et al., 2005; Weiss et al., 2005; Rouw and Scholte, 2007; Weiss and Fink, 2009; Rouw and Scholte, 2010) and covered the visual, auditory, and intraparietal cortices. The anatomy toolbox by Eickhoff and colleagues (2005) was used to build spatial masks covering these three brain regions. The visual mask included area 17, area 18, hOC3v (V3v), hOC4 (V4), and hOC5 (V5); the auditory mask included areas TE 1.0, TE 1.1, and TE 1.2; and the intraparietal mask comprised the areas hIP1, hIP2, and hIP3. A threshold of beta > 1 for at least one of the three spatial variables was determined to select synesthesia-relevant ICNs. In addition, a separate group ICA was applied to each of the two groups using identical parameters as in the combined (controls and synesthetes) approach. This procedure validated the presence of all synesthesia-relevant ICNs in both the synesthetes and the control subjects in independent analyses.
To analyze group differences of within-network connectivity, we entered spatial maps of individual ICNs of the combined group ICA into an ANOVA with the factors subject, group, component, and a group × component interaction using SPM5. Contrasts were masked by conjunction maps of the one-sample t test (FWE corrected, p < 0.05; Fig. 1, left) of the respective network and thresholded at p < 0.05, FWE corrected at the voxel level. Finally, each individual subject's FC between the synesthesia-relevant ICNs was derived by calculating pairwise zero-lag correlation coefficients between the BOLD signal time courses of the synesthesia-relevant ICNs. We performed this functional network connectivity (FNC) analysis using the FNC Matlab toolbox (version 2.3) (Jafri et al., 2008).
Figure 1.

Illustration of the seven synesthesia-relevant ICNs revealed by the combined and separate group ICAs. Seven synesthesia-relevant ICNs were identified by ICA and spatial regression analysis (for further details, see Materials and Methods). Results of the one-sample t tests on the individual subjects ICN patterns are visualized on axial, sagittal, or coronal sections of the standard brain template provided by SPM5. Due to differences in statistical power, a threshold of p < 0.05, FWE corrected, was applied for the combined group ICA, while the within-group ICA results for both groups are shown for a height threshold of p < 0.05, FDR corrected, and an extent threshold of 50 voxels.
Seed-based correlation analysis for the cytoarchitectonically defined color area V4.
To complement the ICA results by an independent approach, we performed a seed-based correlation analysis by calculating the FC from cytoarchitectonically defined color area V4 to all other voxels of the brain. The bilateral V4 seed regions were created using the Anatomy Toolbox (Eickhoff et al., 2005). The REST toolkit (Song et al., 2011) was used for removing the linear trend of time courses from the data, temporal bandpass filtering of the data (0.01–0.1 Hz), and calculating the individual FC maps. Finally, a Fisher's z transformation was used to normalize the individual correlation maps to z maps. Then, for each group, the Fisher's z maps were entered into a separate one-sample t test (using SPM5) to identify regions showing significant FC with color area V4. A height threshold of p < 0.05 (FWE corrected) and an extent threshold of 50 voxels were applied to the one-sample t tests. Moreover, z maps were entered into a two-sample t test to detect significant group differences between synesthetes and controls. The two-sample t test was masked by the conjunction map of the one-sample t tests (FWE corrected; height threshold, p < 0.05; extent threshold, 50 voxels) of synesthetes and control subjects. Again, a height threshold of p < 0.05 (FWE corrected) was applied.
Results
Independent component analysis
We identified seven synesthesia-relevant ICNs in a multiple spatial regression analysis using three spatial priors (visual cortex, auditory cortex, and intraparietal cortex): medial and lateral visual network, auditory network, left and right frontoparietal network, and medial and lateral parietal network (Fig. 1; Tables 1, 2). These ICNs strongly resemble previously described ICNs involved in sensory and cognitive processing (Smith et al., 2009). Figure 1 illustrates that all synesthesia-relevant ICNs from the combined group analysis were also detected by separate ICAs of each group. In addition to this qualitative assessment, we also quantified group differences of within-network connectivity in an ANOVA between grapheme–color synesthetes and control subjects. This ANOVA revealed regions with significantly stronger functional connectivity for synesthetes compared with controls for all networks of interest, while only the left and right frontoparietal networks also included regions showing stronger functional connectivity in the control subjects (Table 3). Note that the within-network differences between groups were limited to rather small clusters.
Table 1.
Results of the multiple spatial regression analysis conducted to identify synesthesia-relevant ICNs to be included in the FNC analysis
| ICN number | Label of ICNs | Betas |
Multiple regression value | ||
|---|---|---|---|---|---|
| Auditory mask | Intraparietal mask | Visual mask | |||
| 1 | Medial visual network | −0.12433 | −0.00555 | 1.81960 | 0.30953 |
| 18 | Auditory network | 3.53987 | 0.01085 | −0.18998 | 0.13207 |
| 12 | Lateral visual network | −0.11789 | −0.01240 | 1.02344 | 0.09962 |
| 16 | Left frontoparietal network | −0.06476 | 1.70691 | −0.05126 | 0.05326 |
| 25 | Lateral parietal network | −0.01792 | 1.06765 | −0.02037 | 0.02193 |
| 19 | Medial parietal network | −0.02189 | 1.07975 | 0.08141 | 0.02109 |
| 21 | Right frontoparietal network | −0.03788 | 1.01988 | −0.03213 | 0.01828 |
| 3 | 0.01709 | 0.03890 | −0.24333 | 0.00560 | |
| — | — | — | — | — | |
| — | — | — | — | — | |
| — | — | — | — | — | |
| 11 | −0.00122 | −0.02028 | −0.01598 | 0.00003 | |
Only components with a beta >1 (bold) on at least one of the three spatial variables were subjected to the FNC analysis to ensure that only ICNs that covered at least one of the synesthesia-relevant brain regions (visual cortex, auditory cortex, and intraparietal cortex) were included. This threshold is represented in the table by the line. Note that already the betas of the next ICN in the table (arbitrarily numbered “3”) are far from the critical value 1, indicating that this and all the other ICNs (with even lower betas) do not contain significant parts of the synesthesia-relevant brain regions.
Table 2.
Brain regions belonging to the seven synesthesia-relevant ICNs
| Region | Hemisphere | Cluster size (voxels) | t value | MNI coordinates |
||
|---|---|---|---|---|---|---|
| x | y | z | ||||
| Medial visual network | ||||||
| Calcarine gyrus | R | 2217* | 23.5 | 12 | −69 | 6 |
| Calcarine gyrus | L | 21.7 | −3 | −72 | 9 | |
| Thalamus | R | 261* | 12.6 | 12 | −21 | 12 |
| Thalamus | L | 10.7 | −6 | −15 | 9 | |
| Superior medial gyrus | M | 180 | 11.4 | 0 | 36 | 45 |
| Lateral visual network | ||||||
| Fusiform gyrus | R | 2677* | 24.1 | 27 | −69 | −9 |
| Fusiform gyrus | L | 19.6 | −21 | −78 | −9 | |
| Insula | R | 61 | 9.2 | 42 | 9 | 6 |
| Auditory network | ||||||
| Superior temporal gyrus; TE 1.2 | R | 1697 | 19.0 | 54 | −3 | 0 |
| Superior temporal gyrus; TE 1.2 | L | 1521 | 17.6 | −54 | −9 | 0 |
| Middle cingulate cortex | L | 78 | 10.2 | −9 | 3 | 39 |
| Left frontoparietal network | ||||||
| Inferior frontal gyrus | L | 1591 | 20.4 | −48 | 30 | 18 |
| Inferior parietal lobule | L | 721 | 18.4 | −51 | −39 | 45 |
| Insula | L | 69 | 17.0 | −33 | 18 | 0 |
| Posterior cingulate cortex | L | 67 | 11.9 | −3 | −36 | 33 |
| Inferior temporal gyrus | L | 67 | 9.5 | −51 | −54 | −9 |
| Thalamus | L | 65 | 10.2 | −6 | −15 | 9 |
| Middle frontal gyrus | R | 50 | 8.6 | 48 | 36 | 21 |
| Precuneus | L | 40 | 9.1 | −6 | −51 | 15 |
| Right frontoparietal network | ||||||
| Inferior frontal gyrus | R | 1909 | 14.5 | 45 | 33 | 27 |
| Inferior parietal lobule | R | 756 | 18.6 | 51 | −54 | 39 |
| Precuneus | R | 151 | 12.4 | 6 | −42 | 45 |
| Superior parietal lobule | R | 48 | 7.5 | 15 | −72 | 54 |
| Middle temporal gyrus | R | 33 | 9.7 | 63 | −27 | −9 |
| Insula | R | 30 | 6.6 | 39 | 21 | −3 |
| Thalamus | R | 29 | 9.3 | 9 | −24 | 12 |
| Inferior parietal lobule | L | 17 | 7.6 | −42 | −51 | 42 |
| Lateral parietal network | ||||||
| Supramarginal gyrus | L | 2615* | 19.1 | −54 | −27 | 33 |
| Supramarginal gyrus | R | 13.6 | 57 | −30 | 33 | |
| Middle cingulate cortex | L | 122 | 12.0 | −6 | 0 | 42 |
| Insula | R | 108 | 10.1 | 42 | −3 | 6 |
| Insula | L | 100 | 9.3 | −42 | −3 | 9 |
| Inferior temporal gyrus | L | 30 | 10.6 | −54 | −63 | −12 |
| Inferior temporal gyrus | R | 25 | 10.0 | 54 | −54 | −6 |
| Inferior frontal gyrus | L | 27 | 9.2 | −54 | 9 | 24 |
| Inferior frontal gyrus | R | 14** | 8.0 | 54 | 9 | 24 |
| Medial parietal network | ||||||
| Cuneus | R | 2445* | 20.8 | 15 | −69 | 33 |
| Cuneus | L | 15.5 | −15 | −69 | 36 | |
| Posterior cingulate cortex | R | 210* | 8.3 | 6 | −42 | 24 |
| Posterior cingulate cortex | L | 8.0 | −6 | −45 | 18 | |
| Midbrain | M | 22 | 8.4 | 0 | −27 | −9 |
One-sample t test, p < 0.05, FWE corrected. Note that only clusters including at least 15 voxels are listed. Anatomical locations and terms were derived from the Anatomy toolbox (Eickhoff et al., 2005).
*These voxels belong to a contiguous bilateral cluster.
**Although this cluster just missed the predefined threshold of 15 voxels, it was included in the table as it reflects the bilateral organization of the lateral parietal ICN.
Table 3.
Within-network differences between synesthetes and controls
| Hemisphere | Cluster size (voxels) | Max. t value | MNI coordinates |
|||
|---|---|---|---|---|---|---|
| x | y | z | ||||
| Synesthetes > controls | ||||||
| Lateral visual network | R | 5 | 4.46 | 15 | −60 | −3 |
| Auditory network | L | 3 | 5.47 | −57 | −9 | 3 |
| L | 2 | 4.62 | −39 | −27 | 18 | |
| Left frontoparietal network | L | 37 | 7.5 | −6 | 21 | 45 |
| L | 5 | 5.38 | −33 | 0 | 60 | |
| L | 3 | 4.39 | −39 | 33 | 15 | |
| Right frontoparietal network | R | 17 | 6.4 | 42 | 12 | 39 |
| R | 13 | 5.25 | 24 | 6 | 54 | |
| Medial parietal network | R | 2 | 4.61 | 18 | −57 | 33 |
| Lateral parietal network | L | 12 | 5.82 | −33 | −36 | 42 |
| L | 2 | 5.02 | −33 | −39 | 48 | |
| Controls > synesthetes | ||||||
| Left frontoparietal network | L | 6 | 4.91 | −39 | 6 | 48 |
| Right frontoparietal network | R | 37 | 8.06 | 39 | −42 | 36 |
| R | 2 | 4.66 | 6 | 39 | 45 | |
Please note that single voxels are not listed in the table. Also note that there was a higher significant FC in the medial visual network in synesthetes compared to controls, although limited to two single voxels. All reported results are significant at p < 0.05 (FWE corrected).
We nest investigated group differences of network connectivity between the seven synesthesia-relevant ICNs. This FNC analysis revealed clear differences in the intrinsic network architecture between grapheme–color synesthetes and control subjects. For the control group, only five significant connections emerged (as indexed by significant correlations between the time courses of the seven ICNs, one-sample t tests, two-sided, p < 0.05, FDR corrected; Fig. 2A). In stark contrast, 15 significant connections between the seven ICNs were present in the synesthetes (one-sample t tests, two-sided, p < 0.05, FDR corrected; Fig. 2B). Note that all significant connections observed in controls were also present in the synesthetes (Fig. 2A,B, black lines). Thus, the global functional network architecture in synesthesia consisted of the intrinsic nonsynesthetic network connectivity plus additional intrinsic connections (Fig. 2B, double lines). Specifically, the integration of the two visual ICNs into the network architecture was clearly different between controls and synesthetes: while the visual networks were only interconnected (and not connected to any other ICN) in controls, these two networks were highly interconnected with the other ICNs in the grapheme–color synesthetes.
Figure 2.
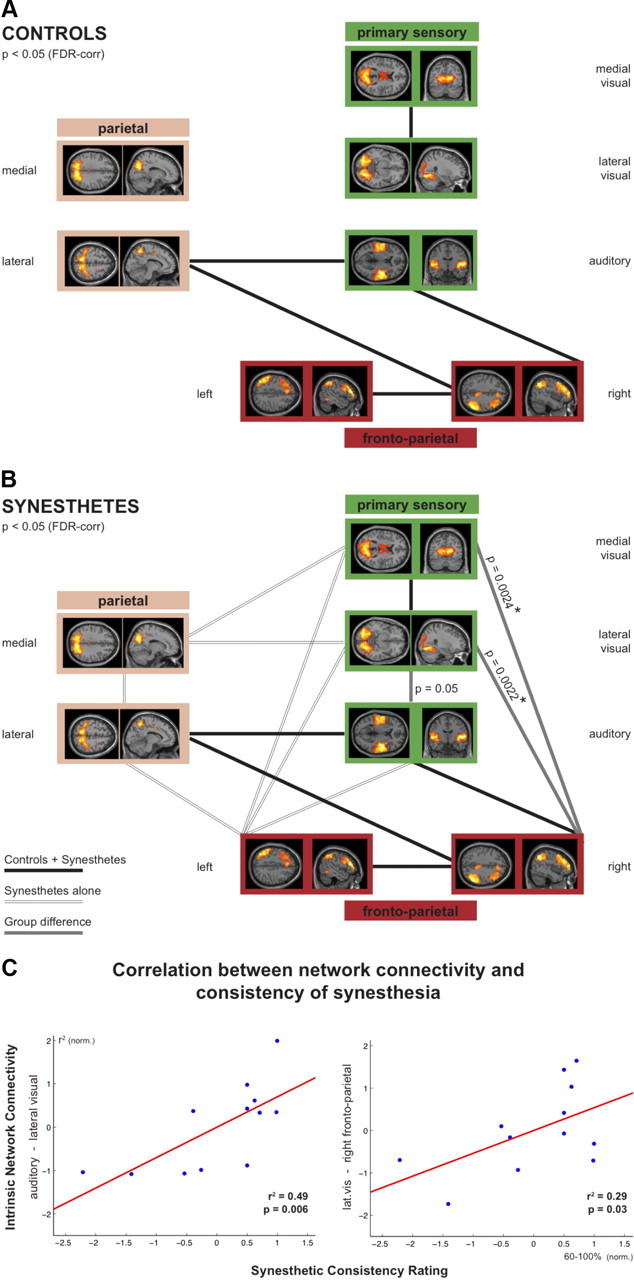
A, B, Illustration of the intrinsic network architecture in controls (A) and synesthetes (B) composed of coherent, ongoing neuronal activity between seven synesthesia-relevant ICNs. C, Intrinsic network connectivity correlates with the consistency of synesthetic experiences. By means of multiple spatial regression analysis, the following seven synesthesia-relevant ICNs were selected for further correlation analyses in an automated manner: three primary sensory ICNs (medial and lateral visual network, auditory network), the right and left frontoparietal ICN, and the medial and lateral parietal ICNs. A, Significant pairwise correlations between the time courses of the ICNs in both groups are represented by thick black lines connecting the respective ICNs (one-sample t tests, two-sided, p < 0.05, FDR corrected). B, Additional significant connections in synesthetes are indicated by double lines (one-sample t tests, two-sided, p < 0.05, FDR corrected). Gray lines represent significant group differences, i.e., additional connections in synesthetes that are significantly stronger compared with the control group (two-sample t test, two-sided, p < 0.05, uncorrected; * indicates group differences surviving FDR correction). C, Correlation analyses between the functional connectivity and the consistency of synesthetic experiences (using the normalized scores for the three functional connections that were significantly stronger in grapheme–color synesthetes and the normalized consistency scores) revealed a significant correlation between the synesthetic consistency scores and the intrinsic connectivity strength between the lateral visual and the auditory ICNs (r2 = 0.49, p = 0.006, left) and the lateral visual and the right frontoparietal ICNs (r2 = 0.29, p = 0.03, right).
In addition to these global differences of the intrinsic network architecture between synesthetes and control subjects (i.e., three times more significant connections in the synesthetes), the direct group comparison revealed that two specific network connections were significantly stronger in the grapheme–color synesthetes (two-sample t tests, two-sided, p < 0.05, FDR corrected): these were the connections between the medial (p = 0.0024) and lateral (p = 0.0022) visual networks and the right frontoparietal network (Fig. 2B, gray lines). In addition, the connection between the lateral visual and auditory network showed a trend toward significance (p = 0.05).
To test whether the increased FNC determined the consistency of synesthetic experiences, correlation analysis was performed with the individual consistency scores and the strength of the three functional network connections that differed between synesthetes and controls. In synesthetes, the connection strength of the lateral visual ICN with both the auditory ICN (p = 0.006) and the right frontoparietal ICN (p = 0.03) significantly correlated with the consistency scores (Fig. 2C). No significant correlation was found for the connection between the medial visual and right frontoparietal ICNs (p = 0.10).
Seed-based correlation analysis for the cytoarchitectonically defined color area V4
One-sample t tests based on the z-transformed individual FC maps revealed that in grapheme–color synesthetes, color area V4 showed a significant FC with other synesthesia-relevant regions, namely primary and secondary visual areas, auditory cortex bilateral, and right parietal cortex, while in control subjects, V4 was also functionally connected to primary and secondary visual areas but showed no FC with the auditory cortices and the right parietal cortex (Fig. 3; Table 4). Thus, the seed-based correlation analysis confirmed the FNC analysis results of a significantly increased intrinsic FC between the lateral visual network (including the color area V4) and the bilateral auditory network as well as the right frontoparietal network in synesthetes compared with controls (Fig. 2B). However, the differences in the seed-based correlation patterns between synesthetes and controls did not survive the predefined statistical threshold (p < 0.05, FWE corrected) when assessed by a two-sample t test.
Figure 3.

A, B, Surface renderings of brain regions functionally connected with bilateral color area V4 in grapheme–color synesthetes (A) and control subjects (B). The synesthesia-relevant brain regions (right parietal cortex and bilateral auditory cortices) that are functionally connected to color area V4 in synesthetes (A) but not control subjects (B) are circled. Please note that also the functional connectivity of V4 with other primary and secondary visual areas was more pronounced in synesthetes. All shown regions reached significance at p < 0.05 (FWE corrected, extent threshold 50 voxels).
Table 4.
Regions functionally connected with bilateral color area V4 in synesthetes and controls
| Hemi-sphere | Cluster size (voxels) | Max. t value | MNI coordinates |
|||
|---|---|---|---|---|---|---|
| X | y | z | ||||
| Synesthetes | ||||||
| Primary and secondary visual cortex | L | 4573* | 32.67 | −27 | −87 | −9 |
| R | 27 | −84 | −9 | |||
| Auditory cortex | L | 250 | 17.74 | −63 | −36 | 3 |
| R | 336 | 16.55 | 66 | −21 | 6 | |
| Parietal cortex | R | 58 | 13.40 | 24 | −54 | 57 |
| Controls | ||||||
| Primary and secondary visual cortex | R | 3506* | 30.70 | 21 | −87 | −18 |
| L | −27 | −66 | −21 | |||
| Medial frontal cortex | M | 88 | 15.96 | 6 | 63 | 12 |
| Inferior temporal cortex | L | 136 | 15.49 | −57 | −9 | −27 |
| Cuneus | R | 52 | 14.84 | 21 | −72 | 27 |
| Superior parietal cortex | M | 132 | 14.37 | 0 | −72 | 54 |
*These voxels belong to a contiguous bilateral cluster. Note that the clusters in grapheme–color synesthetes are more extensive than in controls (Fig. 3). In contrast, control subjects show smaller, separable clusters.
Discussion
Supporting neurobiological models of synesthesia that hypothesize increased connectivity in grapheme–color synesthetes (Hubbard and Ramachandran, 2005), the current rs-fMRI study reveals increased intrinsic functional connectivity in grapheme–color synesthetes, complementing earlier findings of increased structural connectivity in synesthesia (Rouw and Scholte, 2007). Our results thus complement the findings of previous studies in nonsynesthetes showing the structural correlates of intrinsic FC networks (Honey et al., 2007; Vincent et al., 2007). Moreover, our results are in line with a recent resting-state electroencephalography (EEG) study in which several synesthesia-relevant brain regions revealed stronger functional connectivity in lower frequencies of the theta and alpha band in colored–hearing synesthetes compared with nonsynesthetic control subjects (Jäncke and Langer, 2011). Such connectivity changes in the low-frequency band may well constitute the electrophysiological correlate for the low-frequency BOLD fluctuations in resting state fMRI data as suggested by simultaneous EEG–fMRI studies (Laufs et al., 2003; Van de Ville et al., 2010).
Applying a multiple spatial regression analysis to the combined group ICA, we identified seven synesthesia-relevant ICNs whose intranetwork and internetwork connectivity was investigated. These seven ICNs were also identified in the separate within-group ICAs, indicating a homogenous distribution of the ICNs in synesthetes and controls. Consistent with the notion of functional hyperconnectivity in grapheme–color synesthesia, the direct group comparison of intranetwork connectivity differences revealed regions showing significantly stronger intrinsic FC in synesthetes than control subjects for all seven synesthesia-relevant ICNs. In contrast, only two ICNs (i.e., the left and right frontoparietal networks) contained regions with stronger FC in controls compared with synesthetes.
The finding of increased intranetwork connectivity in synesthetes is consistent with the results of a recent study by Hupé et al. (2011) that suggests that the joint coding of real and synesthetic colors is distributed rather than localized in the visual cortex. In fact, our findings are direct support for the assumption of Hupé et al. (2011) that “… if synesthetic experience relies on connecting regions together, it does not necessarily involve a stronger BOLD response in any region but maybe subtle coactivations in distributed regions.” Thus, the current study strongly supports Hupé et al.'s hypothesis that “network analysis of brain connectivity appears then as a promising approach to elucidate principles underlying synesthesia” (Hupé et al., 2011, page 11).
With respect to the internetwork connectivity, the current study revealed increased global and specific intrinsic functional network connectivity in synesthetic subjects. Here, “global” refers to the overall increased amount of significant connections between the seven investigated ICNs in the group of synesthetic subjects compared with the nonsynesthetes. In contrast, “specific” refers to those connections for which a significant group difference was revealed, emphasizing the relevance of these specific connections in processing synesthetic experiences. With respect to the increased global intrinsic network connectivity in grapheme–color synesthesia, it is remarkable that all (five) significant connections between the ICNs found in the control group were also present in the synesthetic subjects. This observation is in line with the notion that synesthetes are healthy subjects without any neurological or psychiatric disease (Hubbard, 2007), but are endowed with additional competences. The finding that the additional experiences of synesthetic subjects are associated with an increased functional network connectivity is also in line with a study by Jafri and colleagues (2008), who revealed an increased functional network connectivity of the default mode network in schizophrenic patients and speculated that this increased functional network connectivity was linked to their hallucinatory experiences. In contrast, reduced functional connectivity has been shown in patients with psychiatric deficits resulting in limited experiences [as in dementia (Greicius et al., 2004)]. However, with respect to this notion, the findings in the ICA literature are inconclusive as the opposite pattern, i.e., decreased functional connectivity in schizophrenia (Vercammen et al., 2010) and increased functional connectivity in dementia (Gour et al., 2011), has also been reported. Grapheme–color synesthetes showed not only a threefold increase of global intrinsic network connectivity compared with controls, but also specific (quantitative) differences in the intrinsic network connectivity: the two visual ICNs were significantly more strongly connected to the right-lateralized frontoparietal ICN in synesthetes compared with nonsynesthetes. This is in accordance with the known role of frontoparietal networks in color-form binding for normal perception (Donner et al., 2002) and previous studies reporting attenuation of synesthetic binding following transcranial magnetic stimulation of the right parietal cortex (Esterman et al., 2006; Muggleton et al., 2007).
Moreover, the strength of the functional connectivity in the resting state between the lateral visual, auditory, and right frontoparietal ICN were associated with the individual consistency of the synesthetic experiences. Recently, different patterns of effective connectivity were shown to be associated with the type of grapheme–color synesthesia (van Leeuwen et al., 2011). In projectors, i.e., synesthetes experiencing the appearance of the synesthetic color in external space (colocalized with the inducing grapheme), the cross-activation of V4 was elicited by a bottom-up pathway in the fusiform gyrus. In contrast, V4 cross-activation was evoked by a top-down process via the parietal lobe in associators, i.e., synesthetes who experience the synesthetic color internally, in their mind's eye. Together, these data suggest that the stability and characteristics of synesthetic experiences are reflected by the degree of functional connectivity at rest and effective connectivity during the performance of tasks inducing synesthetic color perceptions.
The seed-based correlation analysis revealed a significant functional connectivity of bilateral color area V4 with the auditory cortex bilaterally and the right parietal cortex in synesthetes but not in controls. Constituting an independent approach, the seed-based correlation analysis confirmed our findings of the FNC analysis of the seven synesthesia-relevant ICNs, as this analysis also revealed an increased internetwork connectivity between the lateral visual network (including color area V4) with the auditory network and the right frontoparietal network.
Although the converging results of the seed-based correlation and the FNC analyses show the potential of resting-state fMRI for assessing functional connectivity by different approaches, there are also limitations to this method. For example, some authors related the connectivity of networks covering midline and brainstem structures, at least in part, to pulsation artifacts (Birn et al., 2008). Moreover, it needs to be noted that during resting-state fMRI, sensory input (e.g., scanner noise) is present. Nevertheless, as our main findings are unrelated to midline or brainstem structures and our synesthetes did not report synesthetic experiences triggered by the scanner noise, it is unlikely that these aspects have confounded the current results.
Our data, together with previous data showing structural differences and differences in functional network characteristics between synesthetes and nonsynesthetes at rest (Rouw and Scholte, 2007, 2010; Jäncke et al., 2009; Weiss and Fink, 2009; Hänggi et al., 2011; Jäncke and Langer, 2011), indicate that there are general differences between the brains of synesthetes and nonsynesthetes even when no synesthesia-inducing stimuli are present. We suggest that these structural and functional differences predispose the synesthetes' brains to elicit synesthetic experience in response to particular inducer stimuli. One should keep in mind, however, that these structural and functional differences might occur as a result of the synesthetic experiences rather than causing them. The latter possibility can only be examined by longitudinal studies preferentially performed in synesthetic and nonsynesthetic children (Simner et al., 2009).
A further important step is to investigate the functional network architecture during the actual perception of synesthetic experiences. First evidence for increased functional connectivity in this context is provided by Specht and Laeng (2011), who showed an increased coherence of the color area V4 with a perceptual network during a single letter stroop task in two grapheme–color synesthetes (compared with 10 control subjects). Such task-related ICA analysis should be replicated in a larger group of synesthetes and should be complemented with an FNC analysis.
Our data on globally and specifically increased intrinsic network connectivity in grapheme–color synesthetes may help to inform the current debate whether hyperconnectivity in synesthesia occurs either locally, i.e., within circumscribed anatomical regions (Hubbard, 2007), or globally, i.e., widespread throughout the brain (Bargary and Mitchell, 2008). Previous studies investigating structural alterations in grapheme–color synesthetes provided (equivocal) evidence for either type of (structural) hyperconnectivity in synesthesia: structural differences between synesthetes and controls emerged either at the local (Rouw and Scholte, 2007, 2010; Weiss and Fink, 2009) or at the global (Jäncke et al., 2009; Hänggi et al., 2011) level. Our functional connectivity data suggest that a combination of both models most appropriately characterizes grapheme–color synesthetes since they differ functionally from nonsynesthetes at both levels, i.e., at a global level (i.e., overall increased number of significant ICNs in synesthetes compared with controls) and a specific level (i.e., significantly increased FC between some specific ICNs). Furthermore, the current finding stress the importance of investigating both global and specific functional network connectivity in clinical populations to properly characterize the pathophysiological changes in the network architecture caused by schizophrenia, dementia, or other systemic diseases.
Footnotes
This work was supported by Grant 8762754 of the Kommission fuer Klinische Forschung at the Klinikum Rechts der Isar (to V.R.). We are grateful to our subjects and our colleagues at the Institute of Neurocience and Medicine, Research Centre Jülich.
The authors declare no competing financial interests.
References
- Bargary G, Mitchell KJ. Synaesthesia and cortical connectivity. Trends Neurosci. 2008;31:335–342. doi: 10.1016/j.tins.2008.03.007. [DOI] [PubMed] [Google Scholar]
- Baron-Cohen S, Harrison J, Goldstein LH, Wyke M. Coloured speech perception: is synaesthesia what happens when modularity breaks down? Perception. 1993;22:419–426. doi: 10.1068/p220419. [DOI] [PubMed] [Google Scholar]
- Birn RM, Murphy K, Bandettini PA. The effect of respiration variations on independent component analysis results of resting state functional connectivity. Hum Brain Mapp. 2008;29:740–750. doi: 10.1002/hbm.20577. [DOI] [PMC free article] [PubMed] [Google Scholar]
- Biswal B, Yetkin FZ, Haughton VM, Hyde JS. Functional connectivity in the motor cortex of resting human brain using echo-planar MRI. Magn Reson Med. 1995;34:537–541. doi: 10.1002/mrm.1910340409. [DOI] [PubMed] [Google Scholar]
- Biswal BB, Mennes M, Zuo XN, Gohel S, Kelly C, Smith SM, Beckmann CF, Adelstein JS, Buckner RL, Colcombe S, Dogonowski AM, Ernst M, Fair D, Hampson M, Hoptman MJ, Hyde JS, Kiviniemi VJ, Kötter R, Li SJ, Lin CP, et al. Toward discovery science of human brain function. Proc Natl Acad Sci U S A. 2010;107:4734–4739. doi: 10.1073/pnas.0911855107. [DOI] [PMC free article] [PubMed] [Google Scholar]
- Calhoun VD, Adali T, Pearlson GD, Pekar JJ. A method for making group inferences from functional MRI data using independent component analysis. Hum Brain Mapp. 2001;14:140–151. doi: 10.1002/hbm.1048. [DOI] [PMC free article] [PubMed] [Google Scholar]
- Damoiseaux JS, Rombouts SA, Barkhof F, Scheltens P, Stam CJ, Smith SM, Beckmann CF. Consistent resting-state networks across healthy subjects. Proc Natl Acad Sci U S A. 2006;103:13848–13853. doi: 10.1073/pnas.0601417103. [DOI] [PMC free article] [PubMed] [Google Scholar]
- Donner TH, Kettermann A, Diesch E, Ostendorf F, Villringer A, Brandt SA. Visual feature and conjunction searches of equal difficulty engage only partially overlapping frontoparietal networks. Neuroimage. 2002;15:16–25. doi: 10.1006/nimg.2001.0951. [DOI] [PubMed] [Google Scholar]
- Eickhoff SB, Stephan KE, Mohlberg H, Grefkes C, Fink GR, Amunts K, Zilles K. A new SPM toolbox for combining probabilistic cytoarchitectonic maps and functional imaging data. Neuroimage. 2005;25:1325–1335. doi: 10.1016/j.neuroimage.2004.12.034. [DOI] [PubMed] [Google Scholar]
- Erhardt EB, Rachakonda S, Bedrick EJ, Allen EA, Adali T, Calhoun VD. Comparison of multi-subject ICA methods for analysis of fMRI data. Hum Brain Mapp. 2011;32:2075–2095. doi: 10.1002/hbm.21170. [DOI] [PMC free article] [PubMed] [Google Scholar]
- Esterman M, Verstynen T, Ivry RB, Robertson LC. Coming unbound: disrupting automatic integratin of synaesthetic color and graphemes by transcranial magnetic stimulation of the right parietal lobe. J Cogn Neurosci. 2006;18:1570–1576. doi: 10.1162/jocn.2006.18.9.1570. [DOI] [PubMed] [Google Scholar]
- Fox MD, Raichle ME. Spontaneous fluctuations in brain activity observed with functional magnetic resonance imaging. Nat Rev Neurosci. 2007;8:700–711. doi: 10.1038/nrn2201. [DOI] [PubMed] [Google Scholar]
- Gour N, Ranjeva JP, Ceccaldi M, Confort-Gouny S, Barbeau E, Soulier E, Guye M, Didic M, Felician O. Basal functional connectivity within the anterior temporal network is associated with performance on declarative memory tasks. Neuroimage. 2011;58:687–697. doi: 10.1016/j.neuroimage.2011.05.090. [DOI] [PubMed] [Google Scholar]
- Greicius MD, Srivastava G, Reiss AL, Menon V. Default-mode network activity distinguishes Alzheimer's disease from healthy aging: evidence from functional MRI. Proc Natl Acad Sci U S A. 2004;101:4637–4642. doi: 10.1073/pnas.0308627101. [DOI] [PMC free article] [PubMed] [Google Scholar]
- Hänggi J, Wotruba D, Jäncke L. Globally altered structural brain network topology in grapheme-color synesthesia. J Neurosci. 2011;31:5816–5828. doi: 10.1523/JNEUROSCI.0964-10.2011. [DOI] [PMC free article] [PubMed] [Google Scholar]
- Himberg J, Hyvärinen A, Esposito F. Validating the independent components of neuroimaging time series via clustering and visualization. Neuroimage. 2004;22:1214–1222. doi: 10.1016/j.neuroimage.2004.03.027. [DOI] [PubMed] [Google Scholar]
- Honey CJ, Kötter R, Breakspear M, Sporns O. Network structure of cerebral cortex shapes functional connectivity on multiple time scales. Proc Natl Acad Sci U S A. 2007;104:10240–10245. doi: 10.1073/pnas.0701519104. [DOI] [PMC free article] [PubMed] [Google Scholar]
- Hubbard EM. Neurophysiology of synesthesia. Curr Psychiatry Rep. 2007;9:193–199. doi: 10.1007/s11920-007-0018-6. [DOI] [PubMed] [Google Scholar]
- Hubbard EM, Ramachandran VS. Neurocognitive mechanisms of synesthesia. Neuron. 2005;48:509–520. doi: 10.1016/j.neuron.2005.10.012. [DOI] [PubMed] [Google Scholar]
- Hubbard EM, Arman AC, Ramachandran VS, Boynton GM. Individual differences among grapheme-color synesthetes: brain-behavior correlations. Neuron. 2005;45:975–985. doi: 10.1016/j.neuron.2005.02.008. [DOI] [PubMed] [Google Scholar]
- Hupé JM, Bordier C, Dojat M. The neural bases of grapheme-color synesthesia are not localized in real color-sensitive areas. Cereb Cortex. 2011 doi: 10.1093/cercor/bhr236. [DOI] [PubMed] [Google Scholar]
- Jafri MJ, Pearlson GD, Stevens M, Calhoun VD. A method for functional network connectivity among spatially independent resting-state components in schizophrenia. Neuroimage. 2008;39:1666–1681. doi: 10.1016/j.neuroimage.2007.11.001. [DOI] [PMC free article] [PubMed] [Google Scholar]
- Jäncke L, Langer N. A strong parietal hub in the small-world network of coloured-hearing synaesthetes during resting state EEG. J Neuropsychol. 2011;5:178–202. doi: 10.1111/j.1748-6653.2011.02004.x. [DOI] [PubMed] [Google Scholar]
- Jäncke L, Beeli G, Eulig C, Hänggi J. The neuroanatomy of grapheme–color synesthesia. Eur J Neurosci. 2009;29:1287–1293. doi: 10.1111/j.1460-9568.2009.06673.x. [DOI] [PubMed] [Google Scholar]
- Laufs H, Krakow K, Sterzer P, Eger E, Beyerle A, Salek-Haddadi A, Kleinschmidt A. Electroencephalographic signatures of attentional and cognitive default modes in spontaneous brain activity fluctuations at rest. Proc Natl Acad Sci U S A. 2003;100:11053–11058. doi: 10.1073/pnas.1831638100. [DOI] [PMC free article] [PubMed] [Google Scholar]
- Lehrl S, Triebig G, Fischer B. Multiple choice vocabulary test MWT as a valid and short test to estimate premorbid intelligence. Acta Neurol Scand. 1995;91:335–345. doi: 10.1111/j.1600-0404.1995.tb07018.x. [DOI] [PubMed] [Google Scholar]
- Muggleton N, Tsakanikos E, Walsh V, Ward J. Disruption of synaesthesia following TMS of the right posterior parietal cortex. Neuropsychologia. 2007;45:1582–1585. doi: 10.1016/j.neuropsychologia.2006.11.021. [DOI] [PubMed] [Google Scholar]
- Nunn JA, Gregory LJ, Brammer M, Williams SC, Parslow DM, Morgan MJ, Morris RG, Bullmore ET, Baron-Cohen S, Gray JA. Functional magnetic resonance imaging of synaesthesia: activation of V4/V8 by spoken words. Nat Neurosci. 2002;5:371–375. doi: 10.1038/nn818. [DOI] [PubMed] [Google Scholar]
- Oldfield RC. The assessment and analysis of handedness: the Edinburgh inventory. Neuropsychologia. 1971;9:97–113. doi: 10.1016/0028-3932(71)90067-4. [DOI] [PubMed] [Google Scholar]
- Rouw R, Scholte HS. Increased structural connectivity in grapheme-color synesthesia. Nat Neurosci. 2007;10:792–797. doi: 10.1038/nn1906. [DOI] [PubMed] [Google Scholar]
- Rouw R, Scholte HS. Neural basis of individual differences in synesthetic experiences. J Neurosci. 2010;30:6205–6213. doi: 10.1523/JNEUROSCI.3444-09.2010. [DOI] [PMC free article] [PubMed] [Google Scholar]
- Schölvinck ML, Maier A, Ye FQ, Duyn JH, Leopold DA. Neural basis of global resting-state fMRI activity. Proc Natl Acad Sci U S A. 2010;107:10238–10243. doi: 10.1073/pnas.0913110107. [DOI] [PMC free article] [PubMed] [Google Scholar]
- Simner J, Harrold J, Creed H, Monro L, Foulkes L. Early detection of markers for synaesthesia in childhood populations. Brain. 2009;132:57–64. doi: 10.1093/brain/awn292. [DOI] [PubMed] [Google Scholar]
- Smith SM, Fox PT, Miller KL, Glahn DC, Fox PM, Mackay CE, Filippini N, Watkins KE, Toro R, Laird AR, Beckmann CF. Correspondence of the brain's functional architecture during activation and rest. Proc Natl Acad Sci U S A. 2009;106:13040–13045. doi: 10.1073/pnas.0905267106. [DOI] [PMC free article] [PubMed] [Google Scholar]
- Song XW, Dong ZY, Long XY, Li SF, Zuo XN, Zhu CZ, He Y, Yan CG, Zang YF. REST: a toolkit for resting-state functional magnetic resonance imaging data processing. PLoS One. 2011;6:e25031. doi: 10.1371/journal.pone.0025031. [DOI] [PMC free article] [PubMed] [Google Scholar]
- Sorg C, Riedl V, Mühlau M, Calhoun VD, Eichele T, Läer L, Drzezga A, Förstl H, Kurz A, Zimmer C, Wohlschläger AM. Selective changes of resting-state networks in individuals at risk for Alzheimer's disease. Proc Natl Acad Sci U S A. 2007;104:18760–18765. doi: 10.1073/pnas.0708803104. [DOI] [PMC free article] [PubMed] [Google Scholar]
- Specht K, Laeng B. An independent component analysis of fMRI data of grapheme-colour synaesthesia. J Neuropsychol. 2011;5:203–213. doi: 10.1111/j.1748-6653.2011.02008.x. [DOI] [PubMed] [Google Scholar]
- Van de Ville D, Britz J, Michel CM. EEG microstate sequences in healthy humans at rest reveal scale-free dynamics. Proc Natl Acad Sci U S A. 2010;107:18179–18184. doi: 10.1073/pnas.1007841107. [DOI] [PMC free article] [PubMed] [Google Scholar]
- van Leeuwen TM, den Ouden HE, Hagoort P. Effective connectivity determines the nature of subjective experience in grapheme-color synesthesia. J Neurosci. 2011;31:9879–9884. doi: 10.1523/JNEUROSCI.0569-11.2011. [DOI] [PMC free article] [PubMed] [Google Scholar]
- Vercammen A, Knegtering H, den Boer JA, Liemburg EJ, Aleman A. Auditory hallucinations in schizophrenia are associated with reduced functional connectivity of the temporo-parietal area. Biol Psychiatry. 2010;67:912–918. doi: 10.1016/j.biopsych.2009.11.017. [DOI] [PubMed] [Google Scholar]
- Vincent JL, Patel GH, Fox MD, Snyder AZ, Baker JT, Van Essen DC, Zempel JM, Snyder LH, Corbetta M, Raichle ME. Intrinsic functional architecture in the anaesthetized monkey brain. Nature. 2007;447:83–86. doi: 10.1038/nature05758. [DOI] [PubMed] [Google Scholar]
- Weiss PH, Fink GR. Grapheme-colour synaesthetes show increased grey matter volumes of parietal and fusiform cortex. Brain. 2009;132:65–70. doi: 10.1093/brain/awn304. [DOI] [PubMed] [Google Scholar]
- Weiss PH, Shah NJ, Toni I, Zilles K, Fink GR. Associating colours with people: a case of chromatic-lexical synaesthesia. Cortex. 2001;37:750–753. doi: 10.1016/s0010-9452(08)70631-2. [DOI] [PubMed] [Google Scholar]
- Weiss PH, Zilles K, Fink GR. When visual perception causes feeling: enhanced cross-modal processing in grapheme–color synesthesia. Neuroimage. 2005;28:859–868. doi: 10.1016/j.neuroimage.2005.06.052. [DOI] [PubMed] [Google Scholar]