

Abstract
A large amount of experimental evidence has highlighted the rapid changes in synaptic efficacy induced by high-frequency stimulation and BDNF at central excitatory synapses. We clarified the quantal mechanisms and the involvement of Synapsin I (SynI) phosphorylation in the expression of post-tetanic potentiation (PTP) and in its modulation by BDNF in mouse glutamatergic autapses. We found that PTP is associated with an elevation in the probability of release and a concomitant increase in the size of the readily releasable pool (RRP). The latter component was virtually absent in SynI knock-out (KO) neurons, which indeed displayed impaired PTP. PTP was fully rescued by the expression of wild-type SynI, but not of its dephosphomimetic mutants in the phosphorylation sites for cAMP-dependent protein kinase and Ca2+/calmodulin-dependent protein kinases I/II. BDNF potently enhanced PTP through a further increase in the RRP size, which was missing in SynI KO neurons. In these neurons, the BDNF-induced PTP enhancement was rescued by the expression of wild-type SynI, but not of its dephosphomimetic mutant at the mitogen-dependent protein kinase sites. The results indicate that the increase in RRP size necessary for the full expression of PTP, and its sensitivity to BDNF, involve phosphorylation of SynI at distinct sites, thus implicating SynI as an essential downstream effector for the expression of PTP and for its enhancement by BDNF.
Introduction
Short-term plasticity is a modification of synaptic strength induced by high-frequency activity and plays important roles in temporal coding, filtering, adaptation, and pattern detection in brain microcircuits (Zucker and Regehr, 2002; Abbott and Regehr, 2004). Post-tetanic potentiation (PTP) is a transient enhancement of synaptic strength in response to high-frequency stimulation (HFS) which is associated with an increased number of neurotransmitter quanta released in response to the action potential (Zucker and Regehr, 2002). Distinct quantal mechanisms contribute to PTP in various synapses and several presynaptic candidates have been implicated in the expression of PTP, including synapsins, Munc13, Ca2+-activated kinases, or Ca2+-binding proteins (Fioravante and Regehr, 2011).
Brain-derived neurotrophic factor (BDNF) signaling is intimately connected with brain plasticity (Poo, 2001). BDNF has been reported to potentiate excitatory synaptic transmission in primary neurons (Lohof et al., 1993; Lessmann et al., 1994; Levine et al., 1995; Stoop and Poo, 1996; Li et al., 1998), brain slices (Kang and Schumann, 1995; Figurov et al., 1996; Gottschalk et al., 1998), and hippocampal neurons in vivo (Messaoudi et al., 1998). BDNF was shown to acutely increase the frequency of mEPSCs (Lessmann and Heumann, 1998; Li et al., 1998; Collin et al., 2001; Tyler and Pozzo-Miller, 2001) as well as the amplitude and variance of evoked EPSCs (eEPSCs) (Berninger et al., 1999; Schinder et al., 2000; Tyler et al., 2006), suggesting a presynaptic site of action. Consistently, deletion of the Bdnf gene induced several presynaptic defects, including pronounced synaptic fatigue, fewer docked synaptic vesicles (SVs), and reduced expression levels of SV proteins (Figurov et al., 1996; Pozzo-Miller et al., 1999). The fast action of the acute BDNF treatment, and the persistence of potentiation of neurotransmitter release by BDNF even after removal of the soma of the presynaptic neuron (Stoop and Poo, 1995), suggest that the BDNF-induced signaling cascade involves post-translational modifications of preexisting presynaptic components.
Potential downstream targets of both HFS and BDNF are the Synapsins (Syns), a family of SV-associated phosphoproteins, which are substrates of multiple kinases including mitogen-activated protein kinase (MAPK) Erk1/2 (Jovanovic et al., 1996). In adult synapses, Syns regulate the trafficking of SVs within the nerve terminal in a phosphorylation-dependent manner, ultimately affecting the proportion of SVs that are available for release (Cesca et al., 2010). Indeed, studies in synaptosomal preparations have shown that depolarization or acute BDNF increases SynI phosphorylation at distinct sites, increasing the availability of SVs and facilitating evoked neurotransmitter release (Wang et al., 1988; Jovanovic et al., 2000).
Here, we investigated the presynaptic mechanisms of PTP and its modulation by BDNF in excitatory autapses. We showed that PTP is associated with an increase in release probability (Pr) and readily releasable pool (RRP) size, the latter of which is dependent on the concomitant phosphorylation of SynI by cAMP-dependent protein kinase (PKA) or Ca2+/calmodulin-dependent protein kinase I (CaMKI) and by CaMKII. Moreover, PTP was markedly enhanced by BDNF, which induced a further increase in the RRP size entirely dependent on MAPK phosphorylation of SynI. Our results show that distinct components of PTP exist, driven by changes in RRP size, which depend on the coincidence between electrical activity and BDNF release and activate distinct transduction pathways converging onto SynI phosphorylation.
Materials and Methods
cDNA subcloning and site-directed mutagenesis.
Green fluorescent protein-tagged rat SynIa was kindly provided by Hung-Teh Kao (Brown University, Providence, RI). mCherry-tagged SynIa (wt-SynI) was generated by substituting mCherry, obtained from the mammalian expression vector pmCherry-C1 (Clontech), for GFP using the BglII and AgeI sites. The CaMKII dephosphomimetic mutant of SynI (S566A; S603A) was generated by site-directed mutagenesis using the QuikChange Lightning kit (Agilent Technologies) with the following two antiparallel primers carrying codons for the required substitution: forward, 5′-GCTACCCGTCAGGCAGCTATCTCTGGTCCAG-3′ and 5′-GTCCCATTCGTCAGGCCGCCCAGGCAGG TCCCGGAC-3′ for respectively site 2 and 3; and reverse, 5′-CTGGACCAGAGATAGCTGCCTGACGGGTAGC-3′ and 5′-GTCCGGGACCTGCCTGGGCGGCCTGACGAATGGGAC-3′. The PKA/CaMKI-dephosphomimetic mutant of SynI (S9A) was generated by using the following primers: forward, 5′-TTTCCTCCGACGTCGATTTGCATCCGGGGAC-3′; and reverse, 5′-GTCCCCGGATGCAAATCGACGTCGG AGGAAA-3′. The PKA/CaMKs double mutant was obtained by introducing the additional S9A mutation into the S566A/S603A CaMKII mutant. The MAPK dephosphomimetic mutant of SynI (S62A; S67A) was generated by site-directed mutagenesis using the following primers: forward, 5′-TCCAGTGGCCGCTCCAGCAG CCCCTGCTCCCGGGTCCTC-3′; and reverse, 5′-GAGGACCCGGGAGCAGGGGCTGCTGGAGCGGCCACT GGAG-3′. The inserts with the mutated SynI cDNAs were then taken out and ligated into the pCCLsin.PPT.hPGK.GFP.pre lentiviral vector using AgeI and SalI restriction sites.
Lentiviral vector production.
Third-generation pCCLsin.PPT.hPGK.GFP.pre lentiviral vectors were produced by cotransfection of the expression vector carrying the gene of interest and helper plasmids for packaging (Gag, Pol, Rev, and VSV-G) into HEK293T cells, using the Ca3PO4 transfection method. Supernatants were collected, passed through a 0.45 μm filter, and purified by ultracentrifugation as previously described (De Palma and Naldini, 2002). Viral vectors were titrated at concentrations ranging from 1 × 10⁸ to 5 × 10⁹ transducing units/ml, and used at a multiplicity of infection of 2.5–100. Expression and packaging plasmids were a kind gift from M. Amendola and L. Naldini (Tiget, San Raffaele Science Institute, Milan, Italy).
Hippocampal autaptic cultures.
SynI knock-out (KO) mice were generated by homologous recombination (Chin et al., 1995) and rederived on a C57BL/6J background (Charles River). Offspring of homozygous KO mice and of wild-type (WT) littermates of either sex were used throughout. All experiments were performed in accordance with the guidelines established by the European Community Council (Directive of November 24th, 1986) and approved by the National Council on Animal Care of the Ministry of Health. Mice were killed by inhalation of CO2, and 17/18 d embryos (E17–E18) were removed immediately by cesarean section. Removal and dissection of hippocampi were previously described (Baldelli et al., 2005). Briefly, hippocampi were dissociated by enzymatic digestion in 0.125% trypsin for 20 min at 37°C and then triturated with a fire-polished Pasteur pipette. No antimitotic drugs were added to prevent glia proliferation. Autaptic neurons were prepared as described previously (Bekkers and Stevens, 1991) with slight modifications. Dissociated neurons were plated at very low density (20 cells/mm2) on microdots (40–300 μm in diameter) obtained by spraying a mixture of poly-d-lysine (0.1 mg/ml) and collagen (0.25 mg/ml) on dishes that had been pretreated with 0.15% agarose. Both glial cells and single autaptic neurons were present under this culture condition. Infection with wt-SynI or its phosphorylation site mutants (1A-SynI, 2,3A-SynI, 1,2,3A-SynI, or 4,5A-SynI) were performed by adding the lentiviral vector into the cell medium at 8 DIV. The medium was removed after 24 h, cells were washed, and fresh medium was added to the dishes. All patch-clamp experiments were performed on single and isolated cultured hippocampal neurons forming autapses between 12 and 16 DIV. Under this condition, the percentage of neurons expressing GFP-SynIa or its phosphorylation site mutants was ∼95%. The multiplicity of infection was calibrated by immunoblot analysis in such a way that the expression levels of recombinant SynI in KO primary neurons were in the same range of the endogenous levels of SynI expressed by WT neurons. Under these conditions, the expression of wt-SynI and all its phosphorylation site mutants was closely similar (data not shown).
Patch-clamp recordings, data acquisition, and analysis.
Whole-cell patch-clamp recordings were made from autaptic neurons grown on microislands, as previously described (Baldelli et al., 2007). Since the expression of recombinant SynI was moderately heterogeneous among SynI KO autaptic neurons due to the stochastic nature of the infection process, only neurons showing fluorescence levels within a narrow range were selected for patch-clamp recordings, while neurons exhibiting low or high levels of fluorescence were discarded. Patch electrodes, fabricated from thick borosilicate glass (Hilgenberg), were pulled to a final resistance of 3–4 MΩ. eEPSCs were recorded using an EPC-10 amplifier (HEKA Elektronik) by superfusing the whole-cell clamped neuron with a Tyrode solution containing the following (in mm): 150 NaCl, 2 CaCl2, 1 MgCl2, 4 KCl, 10 glucose, 10 HEPES, pH 7.4. d-AP5 (50 μm; Tocris Bioscience) and CGP58845 (5 μm; Tocris Bioscience) were added to the Tyrode solution to block NMDA and GABAB receptors, respectively. BDNF (Sigma) was added to the recording chamber from a stock solution (10 μg/ml in distilled water containing 1 mg/ml bovine serum albumin) to reach a final concentration of 100 ng/ml. To block Trk receptors, neurons were pretreated for 20 min with K252a (200 nm; Sigma) and recorded in the presence of the inhibitor. The standard internal solution was as follows (in mm): 100 CsMES, 20 CsCl, 2 MgCl2, 5 EGTA, 10 HEPES, 4 ATP, and 15 phosphocreatine, pH 7.4. Cs+ replaced K+ in the pipette solution to block outward K+ currents. All the experiments were performed at room temperature (22–24°C). Neurons were voltage-clamped at −70 mV. Axonal action potentials were evoked by depolarizing the cell body to +40 mV for 0.5 ms at 0.1 Hz. Evoked EPSCs were acquired at 10–20 kHz sample frequency and filtered at half the acquisition rate with an 8-pole low-pass Bessel filter. Recordings with leak currents >100 pA or series resistance >20 MΩ were discarded. Data acquisition was performed using PatchMaster programs (HEKA Elektronik). Evoked EPSCs were inspected visually, and only those that were not contaminated by spontaneous activity were considered. To calculate the peak current during an isolated stimulus or a train of stimuli, we first subtracted an averaged trace containing the stimulus artifact and the action potential current, but lacking any discernable synaptic current (i.e., synaptic failures). Such traces were easily identified toward the end of a train of stimuli, when synaptic depression was maximal. These traces were averaged and scaled to the peak Na+ current contaminating the eEPSC.
To analyze paired-pulse ratio (PPR), two brief supraliminar depolarizing pulses were applied to autaptic neurons at 50 ms intervals. For each couple of eEPSCs, PPR was calculated as the ratio I2/I1, where I1 and I2 are the amplitudes of the eEPSCs evoked by the conditioning and test stimuli, respectively. The amplitude of I2 was determined as the difference between the I2 peak and the corresponding value of I1 calculated by monoexponential fitting of the eEPSC decay (Jensen et al., 1999). Because of the high intrinsic variability of PPR, the mean PPR was calculated from the responses to at least four to eight paired-pulse stimulation protocols for each interpulse interval.
For the evaluation of PTP, autaptic neurons were depolarized with short trains of stimuli (1 s at 40 Hz). The maximal PTP induced by HFS was determined by measuring the maximal amplitude of the eEPSCs, usually observed 10–20 s after the train. The time course of PTP was followed with a stimulation frequency to 0.1 Hz. During HFS, the time interval between consecutive stimuli was shorter than the time needed for an eEPSC to return to baseline, so eEPSCs overlapped partially. To correctly estimate the EPSC amplitude, the baseline of each event was defined as the final value of the decay phase of the preceding eEPSC and the amplitude of the nth eEPSC was calculated by subtracting the residual amplitude of the previous eEPSCs from its peak value. In the experiments in which PTP was analyzed in KO neurons expressing SynI phosphorylation mutants, the rescue of PTP was considered unsuccessful if PTP was <80%.
Cumulative eEPSC amplitude analysis.
The size of the readily releasable pool of synchronous release (i.e., RRP) and the probability that any given SV in the RRP will be released (i.e., Pr) were calculated using the cumulative amplitude analysis (Baldelli et al., 2007). RRP was determined by summing up peak EPSC amplitudes during 40 repetitive stimuli applied at 40 Hz. This analysis assumes that depression during the steady-state phase is limited by a constant recycling of SVs and that an equilibrium occurs between released and recycled SVs (Schneggenburger et al., 1999). The number of data points for the linear fitting of the steady-state phase was evaluated by calculating the best linear fit including the maximum number of data points starting from the last one (i.e., from the 40th eEPSC). The intercept with the y-axis gave the RRP, and the ratio between the amplitude of the first eEPSC (I1) and RRP yielded the Pr. Due to the specific features of this analysis, when dealing with RRP throughout the article, we specifically refer to the synchronous RRP.
Statistical analysis.
Data were analyzed by paired/unpaired Student's t test or, in the case of more than two experimental groups, by one-way ANOVA followed by post hoc multiple-comparison tests using the SPSS software. Significance level was preset to p < 0.05. Data were expressed as means ± SEM for number of cells (n). The normal distribution of experimental data was assessed using the Kolmogorov–Smirnov test.
Results
PTP is associated with an enhanced Pr and a concomitant increase of RRP size dependent on PKA/CaMK phosphorylation of SynI
PTP is a form a short-term synaptic plasticity involving the activity-dependent mobilization of the SV recycling pool in which the potential role of SynI has been controversial (Zucker and Regehr, 2002; Fioravante and Regehr, 2011). To analyze the molecular mechanisms of PTP expression, we studied the potential role of SynI and its phosphorylation as a presynaptic target of HFS in excitatory autapses from the hippocampus of WT and KO mice (Fig. 1A). A short HFS (1 s at 40 Hz) (Fig. 1B) was used to evoke PTP, and a paired-pulse stimulus applied every 10 s (interpulse interval, 50 ms) was used to monitor changes in eEPSC amplitude. We analyzed both WT and SynI KO neurons, as well as KO neurons in which wt-SynI had been re-expressed using lentiviral vectors. Moreover, to test the role of site-specific phosphorylation of SynI by PKA/CaMKs and MAPK, KO neurons were transduced with dephosphomimetic mutants of SynI lacking the PKA/CaMKI site (1A-SynI), the CaMKII sites (2,3A-SynI), all the PKA/CaMKs (1,2,3A-SynI), or the MAPK sites (4,5A-SynI).
Figure 1.

PTP is impaired in KO neurons and is rescued by expression of SynI, but not of its PKA/CaMKs phosphorylation mutants. A, Microphotograph of WT and KO autaptic neurons. Scale bar, 30 μm. B, The experimental protocol used to investigate PTP was based on a paired-pulse stimulation (interpulse interval, 50 ms) applied 10 times at 0.1 Hz, interrupted by a train of 1 s at 40 Hz, resumed, and repeated 60 times. C, Representative time courses of PTP in WT neurons, KO neurons, or KO neurons expressing either wt-SynI or its phosphomutants (1A-SynI, 2,3A-SynI, 1,2,3A-SynI, or 4,5A-SynI). PTP was calculated by estimating the percentage increase in eEPSC amplitude with respect to the average eEPSC amplitude before the train. The maximal PTP was observed at the first stimulation, 10 s after the train, and the eEPSC amplitude quickly recovered the baseline value in ∼120 s. D, Bars (means ± SEM) represent the amplitude of maximum PTP expressed as the percentage change with respect to baseline eEPSC. Superimposed symbols show the individual PTP changes observed in WT neurons (n = 21), KO neurons (n = 25), and KO neurons expressing either wt-SynI (n = 17) or its phosphomutant forms (1A-SynI, n = 17; 2,3A-SynI, n = 22; 1,2,3A-SynI, n = 9; 4,5A-SynI, n = 7). **p < 0.01 versus WT, one-way ANOVA followed by Bonferroni's multiple-comparison test. E, Bars (means ± SEM) show PPRs determined before (control) and after PTP induction. The superimposed symbols represent individual PPR values. **p < 0.01 versus control, paired Student's t test.
While the duration of PTP was similar in WT and KO autaptic neurons (Fig. 1C), the maximum PTP, observed immediately after the end of the HFS, was significantly reduced by SynI deletion (WT, 117.3 ± 9.7%, n = 21; KO, 75.7% ± 5.9%, n = 25) (Fig. 1D). Interestingly, PTP amplitude was totally rescued by the expression of either wt-SynI or its MAPK phosphomutant 4,5A-SynI in virtually all neurons analyzed. On the contrary, in a large percentage (∼60%) of the tested cells, the expression of the PKA/CaMKI phosphomutant (1A-SynI), the CaMKII phosphomutant (2,3A-SynI), or the PKA/CaMKs phosphomutant (1,2,3A-SynI) was totally ineffective in rescuing the full expression of PTP (PTP <80%) (Fig. 1D). These results reveal, for the first time, that the expression of SynI is necessary for a full expression of PTP in mammalian neurons and that, in a consistent neuronal population, this occurs through the coincident phosphorylation of SynI at the PKA/CaMKI and CaMKII sites.
Monitoring PTP through paired-pulse stimulation allowed us to evaluate whether the increase in eEPSC amplitude induced by HFS was associated with a change in PPR. Indeed, PPR was significantly decreased in WT neurons (from 1.27 ± 0.06 to 0.79 ± 0.04; n = 21), KO neurons (from 1.35 ± 0.06 to 0.9 ± 0.05; n = 25), or KO neurons in which either wt-SynI or its phospho-mutants were expressed (Fig. 1E), demonstrating that PTP is caused, at least in part, by an increase in the Pr due to the intraterminal Ca2+ buildup. The fact that KO neurons displayed a reduction of PPR comparable to WT neurons despite the PTP impairment, suggests that the role played by SynI in PTP does not involve an activity-dependent change in Pr.
To characterize the exact nature of the PTP impairment induced by the SynI deletion, we compared the PTP-dependent changes of RRP size and Pr in WT and KO autaptic neurons. To this aim, two stimulation trains (1 s at 40 Hz) separated by an interval of 10 s were applied (Fig. 2A,B). The first train was used to induce PTP and estimate RRP and Pr before PTP induction by cumulative amplitude analysis of eEPSC, while the second train was used to evaluate the changes in Pr and RRP due to PTP expression (Fig. 2C). The cumulative profile of repeated eEPSCs showed a rapid rise followed by a slower linear increase. Assuming that the slow linear rise is attributable to the equilibrium between the release and the constant replenishment of SVs, back-extrapolation of the linear portion to time 0 yields the total release minus the total replenishment, corresponding to the RRP (Schneggenburger et al., 1999). We found that, in WT neurons, PTP resulted from two distinct processes; namely, an increase in Pr (Fig. 2D) and an increase in the RRP size (Fig. 2E), in agreement with previous observations in the rat calyx of Held synapses (Habets and Borst, 2007; Lee et al., 2008). Interestingly, in KO neurons the increase in Pr was maintained (Fig. 2D), whereas the increase in RRP size was virtually lost (Fig. 2E).
Figure 2.
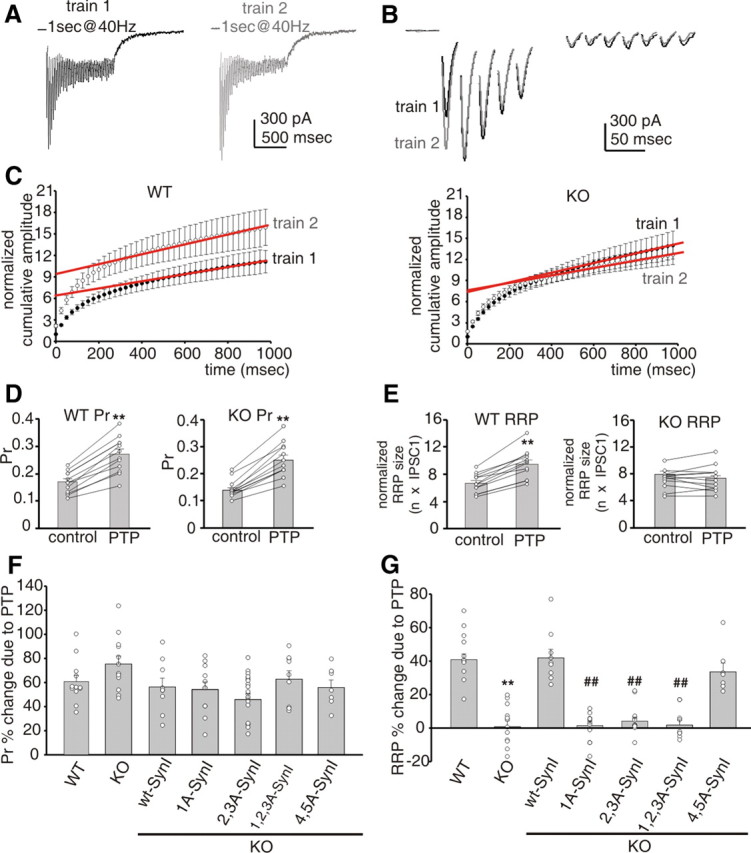
A, PTP is associated with an increased Pr and a concomitant increase in RRP size dependent on PKA/CaMK phosphorylation of SynI. Representative stimulation trains (1 s at 40 Hz), applied at a time interval of 10 s, were used to estimate changes in Pr and RRP size responsible for PTP induction in a WT neuron. B, A detail of the first five and last seven eEPSCs in response to the first (black trace) and second (gray trace) train. Stimulation artifacts were blanked. C, Mean cumulative eEPSC plots showing the changes induced by PTP in WT (left; n = 9) and KO (right; n = 12) neurons. To estimate the RRP, data points in the linear range of the curves were fitted by linear regression and back-extrapolated to time 0 (red lines). D, E, Graph histograms show mean (± SEM) Pr (D) and normalized RRP (E) sizes before (control) and 10 s after PTP induction in WT (left; n = 9) and KO (right; n = 12) neurons. Superimposed symbols connected by lines represent individual Pr and RRP values. **p < 0.01 versus control, paired Student's t test. F, G, Mean percentage changes (± SEM) in Pr (F) and RRP (G) sizes induced by PTP. Superimposed symbols represent individual changes in Pr and RRP observed in WT neurons (n = 12), KO (n = 12) neurons, and KO neurons expressing either wt-SynI (n = 9) or its phosphomutant forms (1A-SynI, n = 17; 2,3A-SynI, n = 22; 1,2,3A-SynI, n = 9; 4,5A-SynI, n = 7). One-way ANOVA followed by Bonferroni's multiple-comparison test. **p < 0.01 versus WT; ##p < 0.01 versus SynI.
These results can shed light on the debated role of SynI in PTP. Although PTP is not suppressed in SynI KO neurons, it is impaired because of the failure to recruit SVs to the RRP in an activity-dependent manner. To identify which phosphorylation pathways were involved, we compared RRP and Pr changes induced by PTP in KO neurons expressing either wt-SynI or its phosphorylation mutants (Fig. 2F,G). The percentage increase in Pr due to PTP was on the average ∼50% in both WT and KO neurons (Fig. 2D). A similar increase of Pr was observed in KO cells expressing either wt-SynI or its phosphomutants, regardless of whether the PKA/CaMK or MAPK sites were mutated (Fig. 2F). The increase of RRP size responsible for PTP was on the average ∼40% in WT neurons; such an increase, virtually absent in KO neurons, was completely rescued by reintroduction of either wt-SynI or its MAPK phosphomutant 4,5A-SynI in all tested cells (Fig. 2G). Interestingly, deletion of the PKA/CaMKI phosphorylation site, the CaMKII phosphorylation sites, or all three PKA/CaMK sites completely suppressed the increase of RRP due to PTP in the very same cells in which PTP was not rescued (∼60%) (Fig. 2G). This indicates that, in a consistent neuronal population, the increase in RRP size associated with PTP is mediated by the coincident phosphorylation of SynI at the PKA/CaMKI and CaMKII sites.
The acute enhancement of EPSC amplitude by BDNF is SynI independent and is due to a combined increase in RRP size and probability of release
BDNF is known to induce a rapid enhancement of glutamatergic transmission (for review, see Poo, 2001). Thus, before studying the effects of BDNF on PTP, we studied its acute effects on basal excitatory transmission and the potential involvement of SynI in these effects. We observed that the acute treatment with BDNF (100 ng/ml) induced an ∼40% increase of eEPSC amplitude in both WT and KO hippocampal glutamatergic neurons (Fig. 3A). The effect of BDNF was extremely rapid, reaching a steady-state value 200 s after application (data not shown). As previously observed (Poo, 2001), the rapid increase in the postsynaptic currents in response to BDNF was limited to 50–70% of neurons. This percentage did not significantly vary in SynI KO neurons (Fig. 3B, bottom). As expected from the persistence of the BDNF effect in the absence of SynI, KO neurons expressing wt-SynI, 1,2,3A-SynI, or 4,5A-SynI responded to BDNF with an enhancement of eEPSC of comparable magnitude (Fig. 3B, top). Treatment of either WT or KO neurons with the nonspecific receptor tyrosine kinase inhibitor K252a prevented the BDNF effect in 100% of the tested cells (Fig. 3B).
Figure 3.

BDNF increases eEPSC amplitude in cultured hippocampal autaptic neurons. A, Neurons (12–16 DIV) were patched and clamped at −70 mV. EPSCs were evoked by injecting, at time intervals of 10 s, brief (0.5 ms) depolarizing pulses at +40 mV evoking INa (deleted), followed by a postsynaptic current that was identified as excitatory based on the fast kinetics of decay and its selective blockade by CNQX. B, Bar histograms show the mean percentage changes in eEPSC amplitude evoked by BDNF application (100 ng/ml, 15 min; top) and the percentages of responsive and unresponsive cells (bottom) in WT neurons, KO neurons, and KO neuron expressing either wt-SynI or its dephosphomimetic mutants 1,2,3A-SynI and 4,5A-SynI. The number of neurons tested for each condition is reported inside the bars. BDNF-responsive neurons were identified as the neurons displaying a BDNF-induced increase of eEPSC of >10%. The two right-most white bars show that all WT and KO neurons pretreated with K252a (200 nm) for 20 min became fully unresponsive to BDNF action. C, Dual eEPSCs recorded from WT and KO neurons in response to paired stimuli separated by interpulse intervals of 50 ms and administered at a stimulation frequency of 0.1 Hz. The amplitude of the second EPSC was increased with respect to the first one and showed greater variability. D, Each couple of bars (mean ± SEM) represents the PPR calculated before (untreated) and after BDNF treatment for responsive (gray bars; 8 ≤ n ≤ 15 for each bar) and unresponsive (white bars; 4 ≤ n ≤ 9 for each bar) cells in WT neurons, KO neurons, and KO neurons expressing either wt-SynI or its phosphomutant forms (1,2,3A-SynI; 4,5A-SynI). *p < 0.05 versus control, paired Student's t test, 4 ≤ n ≤ 15 for each bar.
The enhancement of eEPSC by BDNF has been previously associated with a decrease in PPR, a result that strongly suggests a presynaptic mechanism of action (Figurov et al., 1996; Gottschalk et al., 1998). We applied a paired-pulse stimulation protocol (50 ms interpulse interval) to both BDNF-responsive and unresponsive neurons to verify whether a change in PPR induced by BDNF was correlated with the increase in eEPSC amplitude (Fig. 3C). We observed that the eEPSC enhancement induced by BDNF was always associated with a small, but significant, decrease in PPR in both WT and KO responsive autapses, while nonresponsive neurons never showed alterations in PPR. Similar responses were observed in KO neurons expressing wt-SynI, 1,2,3A-SynI, or 4,5A-SynI (Fig. 3D). Since PPR is generally inversely correlated with the Pr (Zucker and Regehr, 2002), these results suggest that the potentiating action of BDNF is due to an increase in Pr.
To clarify the presynaptic mechanisms of BDNF action, we studied changes in RRP size and Pr by analyzing, upon a 15 min BDNF treatment, the cumulative amplitude profile of EPSC during a high-frequency (1 s at 40 Hz) train of stimuli (Fig. 4A). A significant depression of eEPSCs became apparent during the train in both WT and KO neurons, regardless of BDNF application (Fig. 4B). The cumulative profile of repeated eEPSCs showed a rapid rise that was enhanced by BDNF in both genotypes, followed by a slower linear increase (Fig. 4C,D). BDNF treatment caused a 40% increase in the amplitude of the first eEPSC (Fig. 4E); this correlated with a significant increase in both RRP size (Fig. 4F) and Pr (Fig. 4G). The analysis of cumulative amplitude profiles clearly showed that the acute potentiation of eEPSC induced by BDNF is mediated by a concomitant increase of the RRP and Pr.
Figure 4.

An increase in both RRP and Pr underlies the enhancement of eEPSC induced by BDNF. A, Representative recordings during a train of 40 stimuli at 40 Hz in untreated (top trace) and BDNF-treated (bottom trace) WT neurons. Stimulation artifacts were removed. B, Plots of mean eEPSC amplitude (±SEM) versus time during repetitive stimulation at 40 Hz for WT (top graph; n = 9) or KO (bottom graph; n = 12) neurons before (closed symbols) and after (open symbols) BDNF treatment. C, D, Cumulative eEPSC amplitude profiles for WT (C) and KO (D) neurons normalized to the amplitude of the first eEPSC of the train in the absence of BDNF. To estimate the RRP, data points in the range of 0.4–0.9 s obtained before (closed symbols) and after (open symbols) BDNF treatment were fitted by linear regression and back-extrapolated to time 0 (red lines). E–G, The amplitude of the first eEPSC in the train (E), the size of RRP (F), and the calculated Pr (G) determined before (untreated) and after BDNF treatment are shown as means ± SEM. for WT (left graphs; n = 9) and KO (right graphs; n = 12) neurons. Points and lines refer to single observations. **p < 0.01 versus control, paired Student's t test.
BDNF enhances PTP through an increase in the RRP size mediated by MAPK phosphorylation of SynI
Next, we evaluated the effects of acute BDNF on the expression of PTP and the role played by SynI in these effects. PTP was induced as described above in either WT or KO autaptic neurons. BDNF was then applied for 15 min, and changes in eEPSC amplitude were monitored. Only cells responding to BDNF application, with at least a 10% increase in eEPSC amplitude, were further stimulated with a second train to evaluate the changes in PTP induced by BDNF.
BDNF significantly increased the maximum PTP reached by WT neurons (from 117.3 ± 9.7% to 174.1 ± 16% for untreated and BDNF-treated neurons, respectively; n = 21), whereas it was completely ineffective in all tested KO cells (from 75.7 ± 5.9% to 72.9 ± 6.6, respectively, before and after BDNF treatment; n = 25) (Fig. 5A,B). Notably, both a normal expression of PTP and the ability of BDNF to enhance PTP were entirely rescued by expression of wt-SynI in KO autaptic neurons [from 119.7 ± 7.6% to 175.8 ± 11.8%, respectively, before (n = 17) and after (n = 12) BDNF treatment]. Interestingly, a similar rescue of the BDNF-dependent PTP enhancement, but not of the PTP amplitude under control conditions, was also observed in KO neurons expressing the SynI mutant in which all PKA/CaMK phosphorylation sites were deleted [1,2,3A-SynI; 65.2 ± 6.2% to 134.7 ± 5.7, respectively, before (n = 9) and after (n = 4) BDNF treatment] (Fig. 5A,B). On the contrary, KO neurons expressing the SynI mutant in which MAPK phosphorylation sites were deleted (4,5A-SynI) displayed normal PTP under basal conditions (see above) but were virtually unable to respond to BDNF with an increase in PTP [from 111.3 ± 5.4% to 104.6 ± 5.2%, respectively, before (n = 7) and after (n = 7) BDNF treatment] (Fig. 5A,B).
Figure 5.

BDNF enhances PTP in WT, but not in KO, neurons, and this effect is rescued by expression of Syn I, but not of its MAPK phosphorylation mutant. A, B, Representative time courses of PTP (A) and mean (±SEM) maximum PTP amplitude (B) recorded in WT neurons (n = 21), KO neurons (n = 25), and KO neurons expressing either wt-SynI (n = 17) or its dephosphomimetic mutants (1,2,3A-SynI, n = 9; 4,5A-SynI, n = 7) before (white bars) or after (gray bars) BDNF treatment. Superimposed symbols represent individual experiments. **p < 0.01 versus WT, paired Student's t test. C, Each couple of bars represents the mean PPR (±SEM) calculated before (control) and after PTP induction in the absence (white bars) or presence (gray bars) of BDNF. **p < 0.01 versus untreated control, paired Student's t test (4 ≤ n ≤ 25 for each bar).
To characterize in more detail the enhancement of PTP induced by BDNF, we studied whether PPR was affected. As shown above, we found that the induction of PTP per se was associated with a ∼35% reduction of the PPR in both genotypes (Fig. 5C, white bars). However, the enhancement of PTP induced by BDNF did not further reduce PPR in WT neurons, KO neurons, or KO neurons expressing wt-SynI, Syn-1,2,3A, or Syn-4,5A (Fig. 5C; gray bars). These results suggest that the enhancement of PTP induced by BDNF is not due to a further increase of Pr. To further elucidate the mechanism underlying the enhancement of PTP induced by BDNF, we dissected the effects of BDNF on RRP size and Pr associated with PTP induction. To this aim, paired trains (1 s at 40 Hz) of stimulation separated by an interval of 10 s were applied to WT neurons under control conditions (Fig. 6A, left), and reapplied after 15 min of treatment with BDNF (Fig. 6A, right). This procedure allowed us to determine, by cumulative amplitude analysis, the effect of BDNF treatment on PTP-induced changes in RRP and Pr (Fig. 6B–E). As mentioned above (Fig. 2), when PTP was generated in WT synapses in the absence of BDNF, both RRP and Pr were increased (Fig. 6F,G). However, when PTP was reinduced after BDNF treatment, a further increase in the RRP size was observed (Fig. 6F), while the Pr remained unchanged (Fig. 6G). Notably, KO neurons equally experienced the increase in Pr (Fig. 6G), but they were virtually unable both to increase the RRP size in an activity-dependent manner and to further increase it in response to BDNF (Fig. 6F).
Figure 6.

BDNF enhances PTP through a further increase in the RRP size mediated by MAPK phosphorylation of SynI. A, Two short stimulation trains (1 s at 40 Hz), separated by 10 s, were used to estimate RRP size and Pr before and after PTP induction. The stimulation protocol was subsequently repeated in the same cells after treatment with BDNF. B–E, The estimation of the RRP size and Pr was performed by using the cumulative amplitude profile analysis, as described in Material and Methods. Cumulative eEPSC amplitude profiles were measured before (filled symbols) and after (open symbols) PTP induction in WT (B, C) and KO (D, E) neurons, in the absence (untreated; B, D) or presence (C, E) of BDNF. Cumulative values were normalized to the amplitude of the first eEPSC of the first train. To estimate the RRP, data points in the linear range of the curves were fitted by linear regression and back-extrapolated to time 0 (red lines). F, G, Mean (±SEM) percentage changes in RRP size (F) and Pr (G) determined in WT neurons (n = 9), KO neurons (n = 12), and KO neurons expressing either wt-SynI (n = 9) or its dephosphomimetic mutants (1,2,3A-SynI, n = 9; 4,5A-SynI, n = 7) before (white bars) or after (gray bars) BDNF treatment. **p < 0.01 versus the respective control group, paired Student's t test.
The reintroduction of wt-SynI in KO neurons was able to reproduce the behavior of WT neurons by rescuing both the activity-dependent and the BDNF-dependent increase in RRP (Fig. 6F,G). Interestingly, when the 1,2,3A-SynI mutant was reintroduced, the transduced synapses were unable to increase the RRP size in response to PTP induction, but they were still able to respond to BDNF with an increase in RRP size of the same magnitude of that observed in neurons expressing wt-SynI (Fig. 6F). Exactly opposite effects were obtained by expressing the 4,5A-SynI mutant in KO neurons: in this case, the activity-dependent increase in RRP size associated with PTP induction was comparable to that obtained in neurons expressing wt-SynI, while the capability of responding to BDNF with a further increase in the RRP size was completely lost (Fig. 6F). Finally, and consistent with the data on PPR (Fig. 5), wt-SynI or either phosphorylation mutant did not affect the Pr changes associated with PTP expression either before or after BDNF treatment (Fig. 6G).
Modeling of PTP components in the absence or presence of BDNF
The results obtained in WT and KO mice demonstrate that PTP is contributed by separate mechanisms that regulate the size of the RRP and the Pr. The results allowed building a minimal model of synaptic dynamics capable of reproducing synaptic depression, facilitation, and PTP under the different experimental conditions. The PTP mechanism was split into Pr and RRP components, which evolve according to the residual Ca2+ hypothesis (Zucker and Regehr, 2002). Although the temporal dynamics of the Pr and RRP components can differ during PTP expression (Habets and Borst, 2007), we assumed that they developed on the same time scale, because of the lack of additional information on distinct dynamics. The model (Fig. 7A) stems from the classic Tsodyks and Markram (1997) model and was extended to include a synaptic facilitation mechanism, similar to that of Dittman and Regehr (1998), and two separate PTP mechanisms aimed at regulating RRP and Pr values.
Figure 7.

Modeling of PTP components and the effects of BDNF and site-specific phosphorylation of SynI. A, The cyclic kinetic scheme reproduces the time course of synaptic dynamics at a nerve terminal. Each stimulus causes the release of a fraction of the RRP (equal to Pr(t) × RRP) in the released pool (REL), which, in turn, elicits an eEPSC of a proportional amplitude. SVs then recover back through the recovered pool (REC) to refill the RRP. The extent of facilitation was regulated by varying the parameter α under the various experimental conditions (range, 0.21–0.28). The maximum potentiation (MPOT) of both RRP and Pr was set equal to the experimental values. All the other parameters were held constant through the various simulated conditions, namely: τF = 200 ms, KF = 1, δF = 5 for facilitation, and τP = 50 s, KP = 1, δP = 2, CaXp = 10 identical for the potentiation of RRP and Pr. The recovery time constant (τREC) was set to 1 s. The PTP protocol and BDNF increase Pr and RRP size by the terms MPr and MRRP explicitly described in Equations 1–3. Model traces reproducing PPR changes before and after PTP induction are shown below and reflect the same time course found in the experiments (compare with Fig. 3A). B, Model-deduced PTP values under the various conditions. The model reproduced the extent of PTP in the absence (open bars) or presence (gray bars) of BDNF. Circles (means ± SEM) represent the experimentally determined values of PTP taken from Figure 5B. C, Schematic representation of SynI-independent (white background) and SynI-dependent (gray background) changes in Pr and RRP underlying the action of BDNF on basal transmission (left), PTP induction by HFS (center), and PTP enhancement by BDNF (right). When applied alone, BDNF potentiates basal transmission by inducing modest SynI-independent increases in both Pr (Pr1) and RRP (RRP1). HFS induces much larger changes in both parameters (Pr2 and RRP2) in response to the Ca2+ buildup. When PTP is evoked in the presence of BDNF, a further increase in RRP is observed (RRP3). Thin lines refer to the signal transduction pathways activated by HFS (PKA, CaMKs) and by the coincidence of HFS and BDNF (MAPK). RRP2 and RRP3 refer to the additive increases in the RRP size brought about by phosphorylation of SynI at sites 1, 2, and 3 (HFS) and at sites 4 and 5 (HFS + BDNF), respectively. CM, Calmodulin.
The Ca2+-dependent potentiation and facilitation were modeled by incrementing the corresponding concentrations of Ca2+-bound molecules by a constant amount at each stimulus (δP and δF for potentiation and facilitation, respectively) and by leaving them to decay back to the basal values with their own time constant (τP and τF, respectively). The dynamic changes of the RRP accounted for the SV depletion and refilling mechanisms (with the time constant τREC) (Fig. 7A, scheme), as well as for a potentiation term that is activated during HFS. The change of RRP over time is described by:
where MRRP(t) is given by the following:
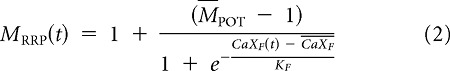 |
where CaXP(t), KP, and CaXP correspond to the concentration of Ca2+-bound molecules, the Ca2+ affinity, and the EC50 of the sigmoidal curve, respectively. The term MPOT represents the maximum RRP increase and is given by the sum of the PKA/CaMK-mediated and MAPK-mediated contributions, MPOT = MPKA/CaMK + MMAPK.
The dynamic changes of Pr accounting for facilitation and potentiation are described by:
 |
where CaXF(t) and KF correspond to the concentration of Ca2+-bound molecules and the Ca2+ affinity for facilitation, respectively. The parameter α regulates the extent of synaptic facilitation, while Pr and Pr(t) represent the initial probability and the probability at time = t, respectively. The Pr change was modeled by MPr(t) with the same function describing the RRP changes (Eq. 2), with the exception that MPOT now represents the maximum value reached by Pr after HFS stimulation (indicated by MPr). Finally, once the stimulation protocol ended, the potentiated RRP and Pr relaxed back to the initial values with a time constant comparable to that of eEPSC amplitude (τP ∼50 s) (Fig. 1B; see also Fig. 7A, model traces). In the simulations, the cumulative amplitude analysis was not used to estimate the RRP size because Equation 1 allowed the exact tracking of the RRP value. When such analysis was used in the model, it underestimated the RRP size by <15% compared with the value computed using Equation 1. Therefore, the model also yields the accuracy of the RRP estimation by means of the cumulative amplitude analysis used in the experiments.
In the model, the basal properties of neurotransmission (EPSC amplitude, synaptic depression, and facilitation) were reproduced by setting the initial Pr and RRP values to the corresponding experimental values and by hand-tuning the facilitation and recovery parameters. The potentiation of RRP and Pr following the PTP protocol in the presence or absence of BDNF was determined by setting the parameters MPKA/CaMK, MMAPK, and MPr to the corresponding experimentally observed values (Fig. 6F,G). With this parameter setting, the EPSC potentiation observed in the experiments was faithfully reproduced (compare Figs. 7B, 5B). Finally, the model also reproduced the facilitation/depression shift observed before and after PTP induction, (Fig. 7A, bottom, simulated traces) and the experimental PPR values determined under basal conditions and after PTP induction in the presence or absence of BDNF (data not shown).
Discussion
PTP is a fast and reversible form of short-term synaptic plasticity that plays fundamental roles in information transfer within neuronal circuits. We have investigated the presynaptic mechanisms of PTP and of its enhancement by BDNF in excitatory autapses and the role played by SynI as downstream target of HFS and BDNF. SynI is phosphorylated by multiple serine/threonine kinases, including PKA, CaMKI/II, and MAPK, as well as by the tyrosine kinase Src, and regulates SV trafficking from the reserve/recycling pool to the RRP to foster exocytosis (Cesca et al., 2010). Thus, SynI is an ideal coincidence detector for the activation of multiple signaling pathways, regulating adaptive changes in SV trafficking and RRP size.
PKA/CaMK phosphorylation of SynI mediates the RRP increase in response to HFS
PTP is a relatively sustained form of short-term homosynaptic plasticity that, in all synapses studied, has been shown to be mostly presynaptic in origin (Zucker and Regehr, 2002). The role played by SynI in PTP has been long debated. An early hypothesis proposed that PTP is caused by CaMKII activation through the Ca2+ buildup reached during HFS, rapidly triggering SynI phosphorylation and resulting in an increased SV availability for release (for review, see Zucker and Regehr, 2002; Cesca et al., 2010). However, data from genetic mutants of SynI and CaMKIIα failed to support these predictions. Field recordings in the CA1 region of hippocampal slices revealed that both SynI−/− mice (Rosahl et al., 1995) and CaMKIIα+/− mice had normal PTP (Stevens et al., 1994). On the other hand, PTP was reduced in SynII−/− mice (Rosahl et al., 1995), but this Syn isoform is not a CaMKII substrate. In agreement with these data, CaMKII inhibitors failed to block PTP in hippocampal neurons (Malinow et al., 1988).
However, other data directly or indirectly implicate SynI in the regulation of PTP expression. In hippocampal CA1 slices from genetically altered mice, the combined deletion of SynI and SynII had a much stronger effect on PTP expression than the single SynII deletion (Rosahl et al., 1995), indicating that SynI does play a role in regulating PTP, although its action may be masked by the presence of SynII. Moreover, in Aplysia neurons, PTP was virtually abolished by the injection of SynI neutralizing antibodies and enhanced by the injection of exogenous SynI (Humeau et al., 2001).
Our results support the concept that SynI has a definite role in the presynaptic expression of PTP by promoting an activity-dependent increase in RRP size. A similar increase in RRP was recently found to be at the basis of PTP in the calyx of Held synapse (Habets and Borst, 2005; Lee et al., 2008). Notably, the reduction of PTP observed in autapses lacking SynI could be fully ascribed to the loss of ability to increase the size of the RRP in response to HFS and could be entirely rescued by expression of wt-SynI. As PTP has a time course on the order of seconds in mammals, this time is sufficiently long to implicate an activity-dependent mobilization of SVs from the RP to the RRP mediated by SynI.
In a large neuronal population, the SynI-dependent increase in the RRP size during PTP was entirely due to its concomitant phosphorylation at sites 1,2,3 by PKA/CaMKs and the reduced PTP of KO neurons could be mimicked by the point mutation of either the PKA/CaMKI site or the CaMKII sites of SynI. In Aplysia or Helix neurons, PTP was found to be dependent on presynaptic CaMKs, because the application of CaMK inhibitors or the presynaptic injection of calmodulin-inhibiting peptide strongly impaired it (Jin and Hawkins, 2003; Fiumara et al., 2007). Moreover, at the same synapses, PKA activation was also found to be required for PTP, likely occurring as a consequence of the Ca2+/calmodulin-mediated activation of adenylyl cyclase during the tetanus. The view that the activity-dependent phosphorylation of SynI site 1 by CaMKI and/or PKA is an important step for the mobilization of SVs in PTP was confirmed by the specific PTP impairment following expression of a Syn site 1 mutant in Helix synapses (Fiumara et al., 2007). Here, we demonstrate that to have a full expression of PTP, SynI needs to be phosphorylated also by CaMKII. The involvement of SynI in PTP is consistent with the hypothesis of a predocking model, in which Ca2+ accumulation induced by HFS triggers the CaMK/PKA-dependent phosphorylation of SynI at multiple sites and the subsequent mobilization of SVs from the actin/SV clusters to boost release (Fig. 7C).
The observation that deletion of PKA/CaMK phosphorylation sites did not mimic the effect of SynI deletion in a fraction of the tested neurons suggests that alternative activity-dependent signaling pathways impinging on SynI, such as those mediated by the kinases Src and CDK5 (Kim and Ryan, 2010; Messa et al., 2010), may be involved in causing the increase in RRP size associated with PTP. Alternative pathways have been described in Helix neurons or in the calyx of Held synapse, where MAPK or myosin light chain kinase was found to be involved in regulating SV availability via cross talk with other Ca2+-dependent pathways (Lee et al., 2008; Giachello et al., 2010).
BDNF facilitates basal synaptic transmission in excitatory autaptic neurons in a SynI-independent manner
We found that BDNF induced a rapid enhancement of basal eEPSCs attributable to a parallel, albeit modest, increase in RRP and Pr. It was previously shown that KCl or 4AP increase SynI phosphorylation at MAPK sites after an early and transient calcineurin-mediated dephosphorylation (Jovanovic et al., 1996, 2001) and that the potentiation of glutamate release by BDNF is completely lost in synaptosomes lacking SynI (Jovanovic et al., 2000). In contrast, we have observed that the effect of BDNF on basal synaptic strength did not involve SynI. However, in the former study neurotransmitter release was evoked by a long-lasting depolarization with 4-aminopyridine, which is known to mobilize not only the RRP, but also a large fraction of the recycling pool of SVs, while here, instead, we have used either single-action potentials or short stimulation trains, which mobilize only a fraction of RRP or, at most, the “whole” RRP. Probably, the rapid effect on RRP involves other presynaptic molecular actors, as was suggested by recent results showing that the BDNF-induced increase in neurotransmitter release is hindered in Rab3A (Thakker-Varia et al., 2001; Alder et al., 2005) and Rim1alfa (Simsek-Duran and Lonart, 2008) KO mice. Moreover, other presynaptic mechanisms, such as the increase in intraterminal Ca2+ following activation of phospholipase Cγ and/or transient receptor potential cation channels (TRPC) or fast-depolarizing Na+ currents could underlie the rapid increase of Pr and RRP evoked by BDNF (Li et al., 1999; Blum et al., 2002; Amaral and Pozzo-Miller, 2007).
BDNF enhances PTP through a further RRP increase dependent on MAPK phosphorylation of SynI
The ability of BDNF to enhance PTP through an increase in the size of the RRP dependent on the MAPK phosphorylation of SynI is a physiologically interesting mechanism. The enhancement of PTP by BDNF was virtually absent in KO neurons and was rescued by wt-SynI, but not by SynI bearing point mutations in the MAPK phosphorylation sites, strongly indicating that MAPK phosphorylation of SynI is necessary and sufficient for BDNF to enhance PTP. Interestingly, the BDNF-induced increase of PTP in WT neurons was not associated with any further change in Pr, but with an increase in RRP size that was distinct and additive with respect to that triggered by HFS.
BDNF may thus operate not only by regulating the efficacy of release initiated by isolated action potentials through a SynI-independent mechanism, but also by affecting short-term plasticity in a SynI-dependent manner. To act on SV trafficking and increase the size of the RRP during PTP, BDNF requires high intraterminal Ca2+ levels such as those reached during HFS. Interestingly, BDNF is released by both presynaptic and/or postsynaptic sites in response to high-frequency presynaptic activity (Balkowiec and Katz, 2000; Hartmann et al., 2001). Thus, this enhancer mechanism may be triggered by the coincidence of high neuronal activity and neurotrophin release. The ensuing activation of the MAPK–SynI phosphorylation cascade adds a further batch of SVs to the RRP, already increased by HFS, to further enhance the potentiated release, thus fine tuning the availability of SVs to the pattern and intensity of presynaptic activation (Fig. 7C).
Conclusions
The present findings demonstrate that PTP is associated with the phosphorylation of several SynI sites by distinct kinases that are activated by HFS and the concomitant release of BDNF, inducing stepwise increases in RRP size. The various kinase pathways involved can be recruited over specific time courses, depending on the frequency of presynaptic activity, extent of Ca2+ buildup, presence of heterosynaptic modulators, and coincidence between these events. Such a conclusion was confirmed by modeling synaptic dynamics to reproduce facilitation and PTP, yielding changes in Pr and RRP under the various experimental conditions that were in full agreement with the experimentally determined ones. The presence of graded PTP expression driven by changes in RRP size dependent on the activation of distinct signal transduction pathways can play a role in the dynamic range and computational properties of the excitatory synapse.
Footnotes
This study was supported by research grants from the Italian Ministry of University and Research (Progetti di Rilevante Interesse Nazionale to F.B. and F.V.), the Italian Ministry of Health Progetto Giovani (to P.B.), the Compagnia di San Paolo, Torino (to P.B., F.B., and F.V.), and the FET Proactive 7 Project (Grant EU 270483 to F.B.). The support of Telethon-Italy (Grant GGP09066 to P.B. and GGP09134 to F.B. and F.V.) is also acknowledged. We thank Drs. Hung-Teh Kao (Brown University, Providence, RI) and Paul Greengard (The Rockefeller University, New York, NY) for providing us with the SynI KO mice; Drs. Luigi Naldini and Mario Amendola (Tiget, Milano, Italy) for invaluable help in lentiviral production protocols; Drs. Anna Fassio, Franco Onofri, and Anna Corradi (University of Genova, Genova, Italy), and Marina Nanni (The Italian Institute of Technology, Genova, Italy) for useful discussions and precious help with cell cultures.
The authors declare no competing financial interests.
References
- Abbott LF, Regehr WG. Synaptic computation. Nature. 2004;431:796–803. doi: 10.1038/nature03010. [DOI] [PubMed] [Google Scholar]
- Alder J, Thakker-Varia S, Crozier RA, Shaheen A, Plummer MR, Black IB. Early presynaptic and late postsynaptic components contribute independently to brain-derived neurotrophic factor-induced synaptic plasticity. J Neurosci. 2005;25:3080–3085. doi: 10.1523/JNEUROSCI.2970-04.2005. [DOI] [PMC free article] [PubMed] [Google Scholar]
- Amaral MD, Pozzo-Miller L. BDNF induces calcium elevations associated with IBDNF, a nonselective cationic current mediated by TRPC channels. J Neurophysiol. 2007;98:2476–2482. doi: 10.1152/jn.00797.2007. [DOI] [PMC free article] [PubMed] [Google Scholar]
- Baldelli P, Hernandez-Guijo JM, Carabelli V, Carbone E. Brain-derived neurotrophic factor enhances GABA release probability and nonuniform distribution of N- and P/Q-type channels on release sites of hippocampal inhibitory synapses. J Neurosci. 2005;25:3358–3368. doi: 10.1523/JNEUROSCI.4227-04.2005. [DOI] [PMC free article] [PubMed] [Google Scholar]
- Baldelli P, Fassio A, Valtorta F, Benfenati F. Lack of synapsin I reduces the readily releasable pool of synaptic vesicles at central inhibitory synapses. J Neurosci. 2007;27:13520–13531. doi: 10.1523/JNEUROSCI.3151-07.2007. [DOI] [PMC free article] [PubMed] [Google Scholar]
- Balkowiec A, Katz DM. Activity-dependent release of endogenous brain-derived neurotrophic factor from primary sensory neurons detected by ELISA in situ. J Neurosci. 2000;20:7417–7423. doi: 10.1523/JNEUROSCI.20-19-07417.2000. [DOI] [PMC free article] [PubMed] [Google Scholar]
- Bekkers JM, Stevens CF. Excitatory and inhibitory autaptic currents in isolated hippocampal neurons maintained in cell culture. Proc Natl Acad Sci U S A. 1991;88:7834–7838. doi: 10.1073/pnas.88.17.7834. [DOI] [PMC free article] [PubMed] [Google Scholar]
- Berninger B, Schinder AF, Poo MM. Synaptic reliability correlates with reduced susceptibility to synaptic potentiation by brain-derived neurotrophic factor. Learn Mem. 1999;6:232–242. [PMC free article] [PubMed] [Google Scholar]
- Blum R, Kafitz KW, Konnerth A. Neurotrophin-evoked depolarization requires the sodium channel NaV1.9. Nature. 2002;419:687–693. doi: 10.1038/nature01085. [DOI] [PubMed] [Google Scholar]
- Cesca F, Baldelli P, Valtorta F, Benfenati F. The synapsins: key actors of synapse function and plasticity. Prog Neurobiol. 2010;91:313–348. doi: 10.1016/j.pneurobio.2010.04.006. [DOI] [PubMed] [Google Scholar]
- Chin LS, Li L, Ferreira A, Kosik KS, Greengard P. Impairment of axonal development and of synaptogenesis in hippocampal neurons of synapsin I-deficient mice. Proc Natl Acad Sci U S A. 1995;92:9230–9234. doi: 10.1073/pnas.92.20.9230. [DOI] [PMC free article] [PubMed] [Google Scholar]
- Collin C, Vicario-Abejon C, Rubio ME, Wenthold RJ, McKay RD, Segal M. Neurotrophins act at presynaptic terminals to activate synapses among cultured hippocampal neurons. Eur J Neurosci. 2001;13:1273–1282. doi: 10.1046/j.0953-816x.2001.01500.x. [DOI] [PubMed] [Google Scholar]
- De Palma M, Naldini L. Transduction of a gene expression cassette using advanced generation lentiviral vectors. Methods Enzymol. 2002;346:514–529. doi: 10.1016/s0076-6879(02)46074-0. [DOI] [PubMed] [Google Scholar]
- Dittman JS, Regehr WG. Calcium dependence and recovery kinetics of presynaptic depression at the climbing fiber to Purkinje cell synapse. J Neurosci. 1998;18:6147–6162. doi: 10.1523/JNEUROSCI.18-16-06147.1998. [DOI] [PMC free article] [PubMed] [Google Scholar]
- Figurov A, Pozzo-Miller LD, Olafsson P, Wang T, Lu B. Regulation of synaptic responses to high-frequency stimulation and LTP by neurotrophins in the hippocampus. Nature. 1996;381:706–709. doi: 10.1038/381706a0. [DOI] [PubMed] [Google Scholar]
- Fioravante D, Regehr WG. Short-term forms of presynaptic plasticity. Curr Opin Neurobiol. 2011;21:269–274. doi: 10.1016/j.conb.2011.02.003. [DOI] [PMC free article] [PubMed] [Google Scholar]
- Fiumara F, Milanese C, Corradi A, Giovedì S, Leitinger G, Menegon A, Montarolo PG, Benfenati F, Ghirardi M. Phosphorylation of synapsin domain A is required for post-tetanic potentiation. J Cell Sci. 2007;120:3228–3237. doi: 10.1242/jcs.012005. [DOI] [PMC free article] [PubMed] [Google Scholar]
- Giachello CN, Fiumara F, Giacomini C, Corradi A, Milanese C, Ghirardi M, Benfenati F, Montarolo PG. MAPK/Erk-dependent phosphorylation of synapsin mediates formation of functional synapses and short-term homosynaptic plasticity. J Cell Sci. 2010;123:881–893. doi: 10.1242/jcs.056846. [DOI] [PubMed] [Google Scholar]
- Gottschalk W, Pozzo-Miller LD, Figurov A, Lu B. Presynaptic modulation of synaptic transmission and plasticity by brain-derived neurotrophic factor in the developing hippocampus. J Neurosci. 1998;18:6830–6839. doi: 10.1523/JNEUROSCI.18-17-06830.1998. [DOI] [PMC free article] [PubMed] [Google Scholar]
- Habets RL, Borst JG. Post-tetanic potentiation in the rat calyx of Held synapse. J Physiol. 2005;564:173–187. doi: 10.1113/jphysiol.2004.079160. [DOI] [PMC free article] [PubMed] [Google Scholar]
- Habets RL, Borst JG. Dynamics of the readily releasable pool during post-tetanic potentiation in the rat calyx of Held synapse. J Physiol. 2007;581:467–478. doi: 10.1113/jphysiol.2006.127365. [DOI] [PMC free article] [PubMed] [Google Scholar]
- Hartmann M, Heumann R, Lessmann V. Synaptic secretion of BDNF after high-frequency stimulation of glutamatergic synapses. EMBO J. 2001;20:5887–5897. doi: 10.1093/emboj/20.21.5887. [DOI] [PMC free article] [PubMed] [Google Scholar]
- Humeau Y, Doussau F, Vitiello F, Greengard P, Benfenati F, Poulain B. Synapsin controls both reserve and releasable synaptic vesicle pools during neuronal activity and short-term plasticity in Aplysia. J Neurosci. 2001;21:4195–4206. doi: 10.1523/JNEUROSCI.21-12-04195.2001. [DOI] [PMC free article] [PubMed] [Google Scholar]
- Jensen K, Lambert JD, Jensen MS. Activity-dependent depression of GABAergic IPSCs in cultured hippocampal neurons. J Neurophysiol. 1999;82:42–49. doi: 10.1152/jn.1999.82.1.42. [DOI] [PubMed] [Google Scholar]
- Jin I, Hawkins RD. Presynaptic and postsynaptic mechanisms of a novel form of homosynaptic potentiation at Aplysia sensory-motor neuron synapses. J Neurosci. 2003;23:7288–7297. doi: 10.1523/JNEUROSCI.23-19-07288.2003. [DOI] [PMC free article] [PubMed] [Google Scholar]
- Jovanovic JN, Benfenati F, Siow YL, Sihra TS, Sanghera JS, Pelech SL, Greengard P, Czernik AJ. Neurotrophins stimulate phosphorylation of synapsin I by MAP kinase and regulate synapsin I-actin interactions. Proc Natl Acad Sci U S A. 1996;93:3679–3683. doi: 10.1073/pnas.93.8.3679. [DOI] [PMC free article] [PubMed] [Google Scholar]
- Jovanovic JN, Czernik AJ, Fienberg AA, Greengard P, Sihra TS. Synapsins as mediators of BDNF-enhanced neurotransmitter release. Nat Neurosci. 2000;3:323–329. doi: 10.1038/73888. [DOI] [PubMed] [Google Scholar]
- Jovanovic JN, Sihra TS, Nairn AC, Hemmings HC, Jr, Greengard P, Czernik AJ. Opposing changes in phosphorylation of specific sites in synapsin I during Ca2+-dependent glutamate release in isolated nerve terminals. J Neurosci. 2001;21:7944–7953. doi: 10.1523/JNEUROSCI.21-20-07944.2001. [DOI] [PMC free article] [PubMed] [Google Scholar]
- Kang H, Schuman EM. Long-lasting neurotrophin-induced enhancement of synaptic transmission in the adult hippocampus. Science. 1995;267:1658–1662. doi: 10.1126/science.7886457. [DOI] [PubMed] [Google Scholar]
- Kim SH, Ryan TA. CDK5 serves as a major control point in neurotransmitter release. Neuron. 2010;67:797–809. doi: 10.1016/j.neuron.2010.08.003. [DOI] [PMC free article] [PubMed] [Google Scholar]
- Lee JS, Kim MH, Ho WK, Lee SH. Presynaptic release probability and readily releasable pool size are regulated by two independent mechanisms during post-tetanic potentiation at the calyx of Held synapse. J Neurosci. 2008;28:7945–7953. doi: 10.1523/JNEUROSCI.2165-08.2008. [DOI] [PMC free article] [PubMed] [Google Scholar]
- Lessmann V, Heumann R. Modulation of unitary glutamatergic synapses by neurotrophin-4/5 or brain-derived neurotrophic factor in hippocampal microcultures: presynaptic enhancement depends on pre-established paired-pulse facilitation. Neuroscience. 1998;86:399–413. doi: 10.1016/s0306-4522(98)00035-9. [DOI] [PubMed] [Google Scholar]
- Lessmann V, Gottmann K, Heumann R. BDNF and NT-4/5 enhance glutamatergic synaptic transmission in cultured hippocampal neurones. Neuroreport. 1994;6:21–25. doi: 10.1097/00001756-199412300-00007. [DOI] [PubMed] [Google Scholar]
- Levine ES, Dreyfus CF, Black IB, Plummer MR. Brain-derived neurotrophic factor rapidly enhances synaptic transmission in hippocampal neurons via postsynaptic tyrosine kinase receptors. Proc Natl Acad Sci U S A. 1995;92:8074–8077. doi: 10.1073/pnas.92.17.8074. [DOI] [PMC free article] [PubMed] [Google Scholar]
- Li HS, Xu XZ, Montell C. Activation of a TRPC3-dependent cation current through the neurotrophin BDNF. Neuron. 1999;24:261–273. doi: 10.1016/s0896-6273(00)80838-7. [DOI] [PubMed] [Google Scholar]
- Li YX, Xu Y, Ju D, Lester HA, Davidson N, Schuman EM. Expression of a dominant negative TrkB receptor, T1, reveals a requirement for presynaptic signaling in BDNF-induced synaptic potentiation in cultured hippocampal neurons. Proc Natl Acad Sci U S A. 1998;95:10884–10889. doi: 10.1073/pnas.95.18.10884. [DOI] [PMC free article] [PubMed] [Google Scholar]
- Lohof AM, Ip NY, Poo MM. Potentiation of developing neuromuscular synapses by the neurotrophins NT-3 and BDNF. Nature. 1993;363:350–353. doi: 10.1038/363350a0. [DOI] [PubMed] [Google Scholar]
- Malinow R, Madison DV, Tsien RW. Persistent protein kinase activity underlying long-term potentiation. Nature. 1988;335:820–824. doi: 10.1038/335820a0. [DOI] [PubMed] [Google Scholar]
- Messa M, Congia S, Defranchi E, Valtorta F, Fassio A, Onofri F, Benfenati F. Tyrosine phosphorylation of synapsin I by Src regulates synaptic-vesicle trafficking. J Cell Sci. 2010;123:2256–2265. doi: 10.1242/jcs.068445. [DOI] [PubMed] [Google Scholar]
- Messaoudi E, Bârdsen K, Srebro B, Bramham CR. Acute intrahippocampal infusion of BDNF induces lasting potentiation of synaptic transmission in the rat dentate gyrus. J Neurophysiol. 1998;79:496–499. doi: 10.1152/jn.1998.79.1.496. [DOI] [PubMed] [Google Scholar]
- Poo MM. Neurotrophins as synaptic modulators. Nat Rev Neurosci. 2001;2:24–32. doi: 10.1038/35049004. [DOI] [PubMed] [Google Scholar]
- Pozzo-Miller LD, Gottschalk W, Zhang L, McDermott K, Du J, Gopalakrishnan R, Oho C, Sheng ZH, Lu B. Impairments in high-frequency transmission, synaptic vesicle docking, and synaptic protein distribution in the hippocampus of BDNF knock-out mice. J Neurosci. 1999;19:4972–4983. doi: 10.1523/JNEUROSCI.19-12-04972.1999. [DOI] [PMC free article] [PubMed] [Google Scholar]
- Rosahl TW, Spillane D, Missler M, Herz J, Selig DK, Wolff JR, Hammer RE, Malenka RC, Südhof TC. Essential functions of synapsins I and II in synaptic vesicle regulation. Nature. 1995;375:488–493. doi: 10.1038/375488a0. [DOI] [PubMed] [Google Scholar]
- Schinder AF, Berninger B, Poo M. Postsynaptic target specificity of neurotrophin-induced presynaptic potentiation. Neuron. 2000;25:151–163. doi: 10.1016/s0896-6273(00)80879-x. [DOI] [PubMed] [Google Scholar]
- Schneggenburger R, Meyer AC, Neher E. Released fraction and total size of a pool of immediately available transmitter quanta at a calyx synapse. Neuron. 1999;23:399–409. doi: 10.1016/s0896-6273(00)80789-8. [DOI] [PubMed] [Google Scholar]
- Simsek-Duran F, Lonart G. The role of RIM1α in BDNF-enhanced glutamate release. Neuropharmacology. 2008;55:27–34. doi: 10.1016/j.neuropharm.2008.04.009. [DOI] [PubMed] [Google Scholar]
- Stevens CF, Tonegawa S, Wang Y. The role of calcium-calmodulin kinase II in three forms of synaptic plasticity. Curr Biol. 1994;4:687–693. doi: 10.1016/s0960-9822(00)00153-6. [DOI] [PubMed] [Google Scholar]
- Stoop R, Poo MM. Potentiation of transmitter release by ciliary neurotrophic factor requires somatic signaling. Science. 1995;267:695–699. doi: 10.1126/science.7839148. [DOI] [PubMed] [Google Scholar]
- Stoop R, Poo MM. Synaptic modulation by neurotrophic factors: differential and synergistic effects of brain-derived neurotrophic factor and ciliary neurotrophic factor. J Neurosci. 1996;16:3256–3264. doi: 10.1523/JNEUROSCI.16-10-03256.1996. [DOI] [PMC free article] [PubMed] [Google Scholar]
- Thakker-Varia S, Alder J, Crozier RA, Plummer MR, Black IB. Rab3A is required for brain-derived neurotrophic factor-induced synaptic plasticity: transcriptional analysis at the population and single-cell levels. J Neurosci. 2001;21:6782–6790. doi: 10.1523/JNEUROSCI.21-17-06782.2001. [DOI] [PMC free article] [PubMed] [Google Scholar]
- Tsodyks MV, Markram H. The neural code between neocortical pyramidal neurons depends on neurotransmitter release probability. Proc Natl Acad Sci U S A. 1997;94:719–723. doi: 10.1073/pnas.94.2.719. [DOI] [PMC free article] [PubMed] [Google Scholar]
- Tyler WJ, Pozzo-Miller LD. BDNF enhances quantal neurotransmitter release and increases the number of docked vesicles at the active zones of hippocampal excitatory synapses. J Neurosci. 2001;21:4249–4258. doi: 10.1523/JNEUROSCI.21-12-04249.2001. [DOI] [PMC free article] [PubMed] [Google Scholar]
- Tyler WJ, Zhang XL, Hartman K, Winterer J, Muller W, Stanton PK, Pozzo-Miller L. BDNF increases release probability and the size of a rapidly recycling vesicle pool within rat hippocampal excitatory synapses. J Physiol. 2006;574:787–803. doi: 10.1113/jphysiol.2006.111310. [DOI] [PMC free article] [PubMed] [Google Scholar]
- Wang JK, Walaas SI, Greengard P. Protein phosphorylation in nerve terminals: comparison of calcium/calmodulin-dependent and calcium/diacylglycerol-dependent systems. J Neurosci. 1988;8:281–288. doi: 10.1523/JNEUROSCI.08-01-00281.1988. [DOI] [PMC free article] [PubMed] [Google Scholar]
- Zucker RS, Regehr WG. Short-term synaptic plasticity. Annu Rev Physiol. 2002;64:355–405. doi: 10.1146/annurev.physiol.64.092501.114547. [DOI] [PubMed] [Google Scholar]