

Abstract
During development, neurons migrate from their site of origin to their final destinations. Upon reaching this destination, the termination of their migration is crucial for building functional architectures such as laminated structures and nuclei. How this termination is regulated, however, is not clear. Here, we investigated the contribution of cell-intrinsic mechanisms and extrinsic factors. Using GAD67-GFP knock-in mice and in utero electroporation cell labeling, we visualized GABAergic neurons and analyzed their motility in vitro. We find that the motility of GABAergic neurons in cortical slices gradually decreases as development proceeds and is almost abolished by the end of the first postnatal week. Consistent with this, a reduction of embryonic interneuron motility occurred in dissociated cultures. This is in part due to cell-intrinsic mechanisms, as a reduction in motility is observed during long-term culturing on glial feeder cells. Cell-intrinsic regulation is further supported by observations that interneurons labeled in early stages migrated more actively than those labeled in late stages in the same cortical explant. We found evidence suggesting that upregulation of the potassium-chloride cotransporter KCC2 underlies this intrinsic regulation. Reduced motility is also observed when embryonic interneurons are plated on postnatal cortical feeder cells, suggesting extrinsic factors derived from the postnatal cortex too contribute to termination. These factors should include secreted molecules, as cultured postnatal cortical cells could exercise this effect without directly contacting the interneuron. These findings suggest that intrinsic mechanisms and extrinsic factors coordinate to reduce the motility of migrating neurons, thereby leading to the termination of migration.
Introduction
During development, neurons migrate from their birthplace to their final destinations where the migration terminates to establish neuronal architectures such as nuclei and laminated structures. While neuronal migration has been studied extensively (for review, see Marín et al., 2010), little is known about the mechanisms that achieve termination.
One possibly important factor in this process is cell-intrinsic regulation. For example, isolated granule cells in cerebellar microexplant cultures slow, eventually becoming stationary in culture over a time course that is similar to their in vivo development (Yacubova and Komuro, 2002; see also Trenkner et al., 1984). Alternatively, extrinsic factors may have a vital role, as several secreted molecules have been shown to suppress or promote neuron motility (Powell et al., 2001; Polleux et al., 2002; Pozas and Ibáñez, 2005; Cameron et al., 2007; Lysko et al., 2011).
While these two factors are not mutually exclusive, to date the effects of both have never been reported in the same study, mostly due to experimental limitations. For example, in experiments that studied intrinsic mechanisms, isolated cells were used, a condition that excludes interactions with other cells. Conversely, studies demonstrating the role of secreted molecules were not designed to evaluate the contribution of intrinsic mechanisms. Ideally, to clarify the importance of both during development, experimental conditions that mimic cellular interactions in vivo would be used.
In this study, we did just this by observing cortical interneurons, a model for which generation, migration, and maturation are well documented. Most of these neurons are generated in the subpallium (Anderson et al., 1997, 2001; Tamamaki et al., 1997; Nery et al., 2002; Yozu et al., 2005; Kanatani et al., 2008; Miyoshi et al., 2010), where they reach a peak on E13 (Fairén et al., 1986), and then migrate to the cortex (Nadarajah and Parnavelas, 2002; Tanaka et al., 2003; Métin et al., 2006). There, they reach the marginal zone (MZ) where they execute multidirectional tangential migration that disperses throughout the entire cortex (Tanaka et al., 2006, 2009, 2010). Postnatally, these neurons settle to their final positions (Hevner et al., 2004; Bortone and Polleux, 2009; Tanaka et al., 2009) and initiate axon elongation (Yamasaki et al., 2010), a key step in their maturation.
We analyzed cortical interneuron motility using two independent methods. The first was to analyze the migration of cortical interneurons that were dissociated from the cortex of embryonic and postnatal GAD67-GFP knock-in mice (termed GAD mice henceforth) (Tamamaki et al., 2003) and then plated onto cortical or glial cell feeder layers. The second was to compare the motility of interneurons labeled via in utero electroporation at two different embryonic stages using cortical explants. From these methods, we show evidence that both cell-intrinsic mechanisms and extrinsic factors underlie the termination of interneuron migration.
Materials and Methods
All animal use and care were in accordance with institutional guidelines.
Dissociated culture
Mouse primary cultured cortical neurons were prepared from embryonic and postnatal heterozygous GAD67 knock-in (∂ neo) mice (Tamamaki et al., 2003) or wild-type mice. GABA content in this line is 0.61 compared with wild type (Tamamaki et al., 2003). Mice were anesthetized and decapitated. Embryonic dorsal cortices were dissected, at the level that included the lateral ganglionic eminence (LGE) and medial ganglionic eminence (MGE), and postnatal cortices were dissected, at the level that included the striatum but excluded the hippocampus, in ice-cold HBSS. Dissected cortices were dissociated using papain (Worthington Biochemical) and a fire-polished Pasteur pipette. Suspensions of GAD and wild-type mouse cortices were centrifuged and the pellets were diluted to a concentration of 5000 cells/μl and 65,000 cells/μl, respectively, in a Neurobasal medium supplemented with B27 and 0.5 mm l-glutamine (all obtained from Invitrogen). To establish a feeder layer, a 10 μl drop of the cortical cell suspension from wild-type mice was placed in the center of a poly-l-lysine (Sigma-Aldrich)-coated 35 mm dish filled with 2 ml of NG+ medium (NG medium plus 25 μm l-glutamic acid) and was allowed to attach to the dish for 15 min. Subsequently, a 10 μl drop of the cell suspension from GAD mice was overlaid onto the feeder layer where the suspension from wild-type mice was dropped. Thus, 5 × 10⁴ cells from GAD mouse cortices were overlaid on a feeder layer composed of 6.5 × 10⁵ cells. Cultures were grown for 36–39 h, which was followed by time-lapse imaging.
To assess the contribution of secreted factors, cortical neurons from E14.5 GAD mice that were plated onto the cortical feeder layer from E14.5 wild-type mice as above and a poly-l-lysine-coated Millicell–PCM membrane (Millipore) was placed above the membrane. Fifteen minutes after plating the GAD cortical neurons, the cell suspension of cortical neurons from wild-type mice (3.25 × 10⁶ cells) was seeded onto the Millicell–PCM membrane.
A glial feeder layer was prepared from the cerebral cortex of E18.5 mice (Nakanishi et al., 1994). Dissection and dissociation were performed as described above. Dissociated cells were grown in a flask and cultured for 2 weeks in DMEM (Nissui) containing 10% FBS (Invitrogen) and penicillin-streptomycin mixed solution (Nacalai Tesque). The glial cultures were trypsinized and subcultured onto poly-l-lysine-coated 35 mm dishes. After glial cells became confluent, cortical neurons from E14.5 GAD mice were plated at a density of 10,000 cells/dish.
In utero electroporation
Ganglionic eminence-directed in utero electroporation was performed as described previously (Tanaka et al., 2009), with some modifications. Plasmid solution (2–3 μl) was pressure-injected and five 50 V/50 ms (for E12.5 embryo) or 80 V/50 ms (for E15.5 embryo) pulses were delivered. The plasmids used were pCAGGS-mCherry, pCAGGS-EGFP (Tanaka et al., 2009), pCAGGS-GAP-tdTomato, and pCAGGS-GAP-EGFP (Yamasaki et al., 2010). For time-lapse imaging, in utero electroporation was performed on the same embryo at two different stages, E12.5 and E15.5. In one embryo, pCAGGS-mCherry was electroporated first, followed by pCAGGS-GAP-EGFP. In another, pCAGGS-GAP-EGFP was electroporated first, followed by pCAGGS-GAP-tdTomato. In both cases, time-lapse imaging was performed at E18.5. For KCC2 immunostaining pCAGGS-EGFP was electroporated either at E12.5 or E15.5. Embryos were subjected to KCC2 immunostaining at E18.5.
Time-lapse imaging
Dissociated cultures.
Either a laser confocal microscope (MRC-1024; Zeiss) or a spinning disk confocal microscope (BX-DSU; Olympus) equipped with a cooled CCD camera (CoolSNAP HQ CCD; Photometrics) was used. For the laser confocal microscope, images were captured at 5 min intervals over 85 min using an Olympus 20×, NA (numerical aperture) = 0.4 objective attached to an upright light microscope (BX50; Olympus), an excitation wavelength of 488 nm, and an emission filter of 522/35 nm. For the spinning disk confocal microscope, images were again captured at 5 min intervals over 85 min but using an Olympus 20×, NA = 0.5 water-immersion objective attached to an upright light microscope (BX51W1; Olympus) equipped with a motorized XY stage (MD-XY30100T-META; Sigma Koki). Images were acquired at nine different areas using this stage. The position at which a drop of the cortical neuron suspension was placed was set as the starting point of imaging. Imaging was further performed by moving the stage either left, right, top, or bottom 1 or 2 mm. In glial feeder layer experiments, images of all GFP-positive interneurons within a 12 × 12 mm window were acquired.
Slice preparations.
Cortical slices were described previously (Tanaka et al., 2003). Briefly, GAD mouse brains were dissected and embedded in 4% low-melting-point agarose. Coronal sections of 150 μm were cut using a vibrating microtome (VT1000; Leica Microsystems) and deposited onto a poly-l-lysine-coated Millicell–CM membrane (Millipore). Embryonic slices were selected from the anterior half of the cerebral hemisphere at a level that included the LGE and MGE and postnatal cortices were dissected at the level that included the striatum, but excluded the hippocampus and the corpus callosum. Cortical slices were covered with collagen gels and immersed in HBSS (Nissui) containing 5% FBS, 10 μg/ml insulin, and 100 μg/ml transferrin. Slices were secured in a 37°C chamber. Time-lapse analyses (3 min intervals, 87 min duration) were performed using the aforementioned laser confocal microscopes. Cells within a 200-μm-wide strip of the cortex were subjected to analysis. Brightness and contrast for all frame and layering images were adjusted by Adobe Photoshop (v. 7.0; Adobe Systems) and MetaMorph (v. 6.1; Molecular Devices) software.
Cortical explant.
Time-lapse imaging of labeled cells in flat-mounted cortices has been described previously (Tanaka et al., 2009; Yamasaki et al., 2010). Briefly, cortical explants from electroporated mouse embryos were embedded on collagen-coated membrane inserts with the ventricular side up and filled with Opti-MEM (Invitrogen) containing 2.5% FBS, 2.5% horse serum, 1% N2 supplement (Invitrogen), 20 mm d-glucose, and 20 μg/ml streptomycin. Cortical explants were secured in a 37°C chamber (5% CO2, 95% O2). Multipoint time-lapse analyses were performed in 6–9 imaging fields at 30 or 40 min intervals using a confocal microscope (FV1000; Olympus) equipped with a motorized XY stage (FC-101G; Sigma Koki). Images of labeled cells were captured using an Olympus 20×, NA = 0.45 objective attached to an inverted light microscope (IX81; Olympus), an excitation wavelength of 488 nm and an emission filter of 505–525 nm for GFP, or an excitation wavelength of 543 nm and an emission filter of 560–660 nm for mCherry and tdTomato. A stack of images was created from a series of 4–6 consecutive images acquired along the z-axis at 5–10 μm intervals at each time point and digitally magnified 1.2 times. A montage of imaging fields was created off-line. Cells that appeared or disappeared during the course of observation were excluded from the analysis. The brightness and contrast of each image were adjusted as described above.
Quantitative analysis of migration distance
To determine the position of individual neurons, the centroid was calculated after thresholding images that were captured with a laser confocal microscope using Scion Image software. The migration distance was calculated using the “track object function” in MetaMorph (v. 6.1 or 7.7; Molecular Devices). Overall migrating distance was defined as the distance from the initial position of a single migrating neuron to its final position, while cumulative migrating distance was defined as the sum of distances for each migrating step. Cells that migrated a distance >15 μm during time-lapse imaging were denoted as migrating cells. Neurite length was determined by measuring the length from the soma to the tip of the longest neurite in each interneuron.
Immunohistochemistry of KCC2 antibody
P7 GAD mice were deeply anesthetized with sodium pentobarbital (100 mg/kg body weight), while E18.5 mouse embryos and P0 mice were anesthetized on ice. They were then transcardially perfused with 4% PFA in 0.1 m PB and postfixed with 4% PFA in PB overnight at 4°C. Cryostat sections were cut at 20 μm. The procedures for KCC2 immunohistochemistry followed the method of Bortone and Polleux (2009). In brief, sections were washed with PBS three times for 15 min, followed by incubation with a blocking solution (10% BSA and 0.3% Triton X-100 in PBS) for 18 h at 4 °C. Then the sections were incubated in a mixture of rabbit polyclonal anti-KCC2 antibody (Millipore) and rat anti-GFP monoclonal antibody (Nacalai Tesque) each diluted at 1:1000 in the blocking solution for 18 h at 4 °C. After seven washes with PBS for 15 min, sections were washed in the blocking solution with 5% normal goat serum for 15 min and then incubated with a mixture of goat Alexa Fluor568-conjugated anti-rabbit IgG (Invitrogen; 1:1000) and goat Alexa Fluor488-conjugated anti-rat IgG (Invitrogen; 1:1000) in blocking solution with 5% normal goat serum for 18 h at 4 °C. They were then washed with PBS five times for 15 min and mounted with polyvinyl alcohol.
Images of labeled cells were captured with a confocal microscope (FV1000; Olympus) using an Olympus 20×, NA = 0.75 and 60×, NA = 1.35 oil-immersion objective attached to an upright light microscope (BX61; Olympus), with an excitation wavelength of 488 nm and an emission filter of 505–525 nm for Alexa Fluor488, or an excitation wavelength of 543 nm and an emission filter of 560–660 nm for Alexa Fluor568. A montage of imaging fields was created by Adobe Photoshop (v. 7.0).
A quantitative analysis of KCC2 expression was performed using MetaMorph (v.7.7). Interneurons labeled by electroporation and localized within 60 μm from the pial surface, a range that corresponds to that for image capture in time-lapse imaging experiment, and oriented tangentially (within ±45° from the tangential axis) were subjected to the analysis. Average intensity of KCC2 immunofluorescence in each GFP-positive cell was determined by dividing the total immunofluorescence by the area of the cell.
Results
Termination of interneuron migration in cortical slices
Cortical interneurons in E13.5–E15.5 cortical explants execute active migration in the SVZ and intermediate zone (IZ) (Tanaka et al., 2003). To examine the time at which migration terminates, we analyzed interneuron motility in GAD mouse cortical slices at later stages. At E18.5, many interneurons in the MZ were stationary (Fig. 1A, white dots), whereas a substantial proportion of neurons in the cortical plate (CP), IZ, and SVZ exhibited active migration (Fig. 1A). However, at P6, the motility of most interneurons was almost abolished throughout the cerebral wall (Fig. 1B, white dots), suggesting that these cells were nearing their termination of migration. Their migration distance became substantially shorter as development proceeded (Fig. 1C). The proportion of migrating cells also decreased significantly, with only a small fraction retaining motility (Fig. 1D). These results suggest that cortical interneurons lose their motility during early postnatal development and that they eventually terminate migration at ∼1 week postnatally.
Figure 1.
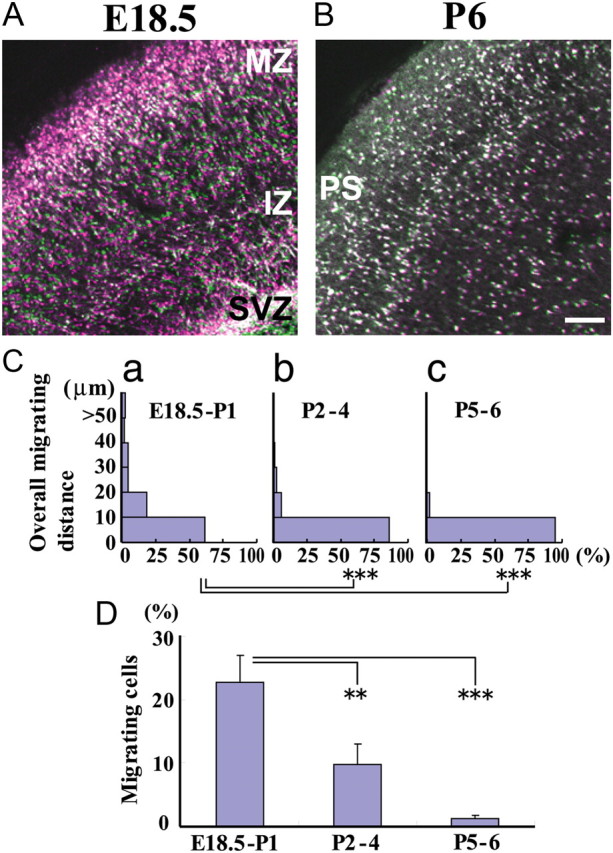
Termination of interneuron migration in slice cultures. Cortical slices prepared from GAD mice were analyzed using time-lapse imaging for 87 min. A, Merged images captured at the beginning (purple) and end (green) of imaging E18.5 embryo. B, Same as A but of P6 mice. White, stationary behavior. C, Histograms of overall migrating distance in the cortex of E18.5–P1 (a), P2–P4 (b), and P5–P6 (c). Overall migrating distance = neuron final position − neuron initial position. Distances significantly decreased between E18.5–P1 and P2–P4, and between E18.5–P1 and P5–P6. ***p < 0.001 (Mann–Whitney U test). D, Proportion of migrating cells significantly decreased as development proceeded, almost reaching zero at P5–P6. Bars represent the SEM. **p < 0.01 and ***p < 0.001 (ANOVA, Bonferroni). Number of cells: E18.5–P1, 706 cells in three slices; P2–P4, 862 cells in five slices; P5–P6, 494 cells in four slices. PS, Pial surface. Scale bar, 50 μm.
Reduction of cortical interneuron motility in dissociated cultures
To assess the factors that contribute to migration termination, we developed a dissociated culture of embryonic and postnatal cortical neurons that allowed for the analysis of motility and tested whether dissociated cortical interneurons exhibit a developmental stage-dependent reduction in motility. A concentrated dissociated culture from wild-type mouse cortices was used as a feeder layer upon which a cell suspension from isochronic GAD mouse cortices was plated on top (Fig. 2A; see Materials and Methods). Many interneurons from an E14.5 cortex showed high motility by extending bifurcated leading processes (Fig. 2Ba,Ca), behaviors that resemble interneurons in cortical explants (Tanaka et al., 2006). At E18.5, interneurons retained modest motility. Some cells actively migrated long distances by extending a leading process (Fig. 2Bb,Cb), whereas others did not change their position substantially, moving in small steps and alternating their direction of migration (Fig. 2Bc,Cc). At P3, some interneurons migrated by extending short processes (Fig. 2Bd,Cd); however, the distance of migration was shorter than that observed at E18.5 (see below). At P7, although a substantial proportion of interneurons retained motility, they moved only around a restricted area by extending and retracting short processes (Fig. 2Be,Ce). Because some of the interneurons in the dissociated culture did not exhibit directed migration (Fig. 2Cc), interneuron motility was also assessed using cumulative migrating distance in addition to overall migration distance (see Materials and Methods). The cumulative migrating distance increased slightly at E18.5 (Fig. 2Db); however, it decreased thereafter as development proceeded further (Fig. 2Dc,Dd). The overall migrating distance decreased monotonically as development proceeded (Fig. 2E). The proportion of migrating cells assessed using cumulative migration distance was significantly less at P7 (Fig. 2F). Although ∼40% of cells were scored as migrating cells, that number was <10% at P7 as assessed by the overall migrating distance (Fig. 2G). These findings are consistent with cortical slice observations, which showed that interneurons terminate migration almost completely ∼1 week postnatally, and indicate that the process of the termination of cortical interneuron migration can be studied in dissociated cultures of embryonic and postnatal cortical cells.
Figure 2.
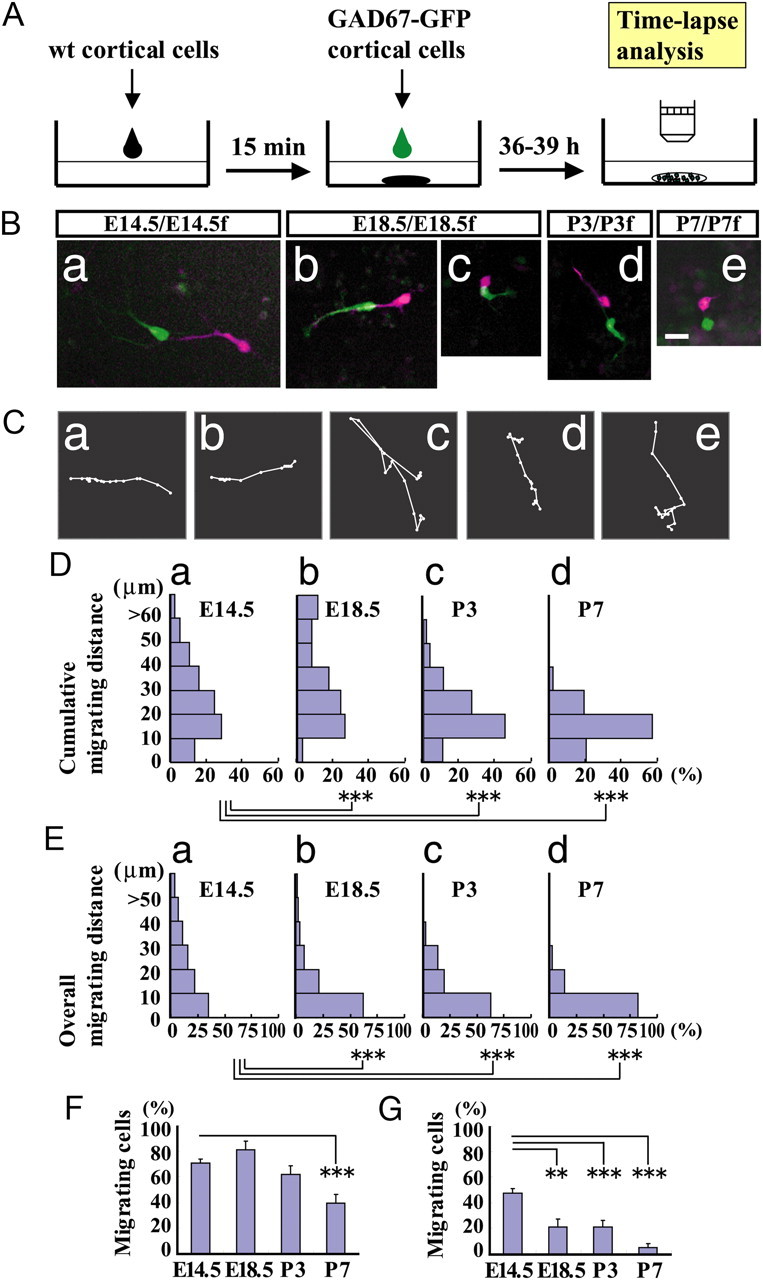
Developmental reduction of interneuron motility in a dissociated culture. A, Experimental procedure. GAD mouse interneurons were plated on a cortical feeder layer. The suspensions of E14.5, E18.5, P3, and P7 GAD mouse cortices were separately overlaid on suspensions of isochronic wild-type (wt) mouse cortices. After 36–39 h cultivation time-lapse analysis was performed. Ba–Be, Representative images showing interneuron motility at different developmental stages. Merged images of E14.5/E14.5f neurons, E18.5/E18.5f neurons, P3/P3f neurons, and P7/E7f neurons, respectively, where the numerator represents the age of GAD mouse neurons and the denominator represents that of feeder layer cells, captured at the beginning (purple) and end (green) of the time-lapse (85 min of recording). C, Representative migratory trajectories of interneurons from E14.5 (a), E18.5 (b and c), P3 (d), and P7 (e). b, c, Magnified by a factor of two; e, magnified by a factor of four. Magnifications are relative to a. D, E, Histograms of cumulative migrating distances (D) and overall migrating distances (E) of E14.5 (a), E18.5 (b), P3 (c), and P7 (d) interneurons. The cumulative migrating distance was slightly higher at E18.5, but decreased thereafter with development. ***p < 0.001 (Mann–Whitney U test). The overall migrating distance was significantly lower as development proceeded with significant differences between E14.5 and later stages, E18.5, P3 and P7. ***p < 0.001 (Mann–Whitney U test). F, G, Proportion of migrating cells based on cumulative migrating distance (F) and overall migrating distance (G). Bars represent SEM. **p < 0.01, ***p < 0.001 (ANOVA, Bonferroni). Number of cells: E14.5, 494 cells in 28 cultures; E18.5, 481 cells in four cultures; P3, 177 cells in four cultures; P7, 139 cells in nine cultures. Scale bar, 20 μm.
Embryonic interneuron motility was reduced during long-term culturing
We first tested for the role of intrinsic mechanisms by observing changes in motility of E14.5 GAD mouse-dissociated cortical cells during long-term culturing on an isochronic wild-type cortical cell feeder layer and on glial feeder cells.
Interneuron motility on a cortical cell feeder layer
Figure 3 shows the morphology and the motility of interneurons after 24 and 96 h of culturing. After 24 h, interneurons migrated actively by extending a branched leading process (Fig. 3A). However, after 96 h, most interneurons appeared stationary and extended multiple neurites (Fig. 3B, arrowheads). Quantitative analysis demonstrated that the distance of migration was significantly shorter at 96 h (24 h, Fig. 3Ca,Da; 96 h, Fig. 3Cb,Db). The proportion of migrating cells also decreased significantly, as the cumulative migrating distance decreased from 74.6 ± 3.7% at 24 h (mean ± SEM, 247 cells in three samples) to 10.7 ± 12.9% at 96 h (155 cells in three samples) (p = 0.0012, Student's t test), while the overall migrating distance also decreased (from 47.8 ± 12.7% at 24 h to 8.6 ± 14.2% at 96 h) (p < 0.05, Student's t test). Both the length and number of interneuron neurites increased concurrently with the decreased motility (Fig. 3, E,F, respectively) in a manner reminiscent of morphological interneuron maturation in vivo (Yamasaki et al., 2010). Together, these results show that the reduced motility and morphological differentiation in dissociated embryonic interneurons occurred during the 3 d culture period. These changes could be explained by intrinsic mechanisms. However, because the influence from feeder layer cells, which should include progenitors and postmitotic neurons, might also change during the culture period, it is possible that motility changes were due to influence from the feeder cortical cells.
Figure 3.

Reduction of embryonic interneuron motility in long-term cultures. Time-lapse analysis of E14.5 GAD mouse interneurons in a dissociated culture. Suspensions of E14.5 GAD mouse cortices were overlaid on the suspensions of E14.5 wild-type mouse cortices (E14.5/E14.5f). A, B, Migratory behaviors of interneurons at 24 and 96 h of culturing, respectively. At 24 h, interneurons showed robust migration with bifurcated neurites; at 96 h, most interneurons were stationary and extended longer and multiple neurites (B, arrowhead). Elapsed time is shown in the lower left corner of each panel. C, D, Cumulative migrating distance (C) and overall migrating distance (D) of interneurons at 24 h (a) and 96 h (b). Distances were significantly shorter at 96 h than 24 h. ***p < 0.001 for each test (Mann–Whitney U test). E, F, Neurite length (E) and number (F) of interneurons at 24 h (a) and 96 h (b). Neurites had significantly longer lengths (E) and more common (F) at 96 h. ***p < 0.001 (Mann–Whitney U test). Number of cells: 24 h, 247 cells in three cultures; 96 h, 155 cells in three cultures. Scale bars, 20 μm.
Interneuron motility on the glial cell feeder layer
To eliminate this possibility, we plated interneurons on a feeder layer of glial cells that had been cultured for >2 weeks before being plated on the dishes (see Materials and Methods). After the glial cells became confluent, a low density (10,000 cells/35 mm dish) of dissociated cortical cells from GAD mice were plated on top to minimize any interactions. As shown in Figure 4A, interneurons grown on a glial feeder layer exhibited prominent motility by extending bifurcated leading processes 24 h after plating. However, at 96 h, their migration had almost ceased, with the cells extending relatively long processes (Fig. 4B, arrowhead). Both the cumulative migrating distance and overall migrating distance decreased significantly during the period between 24 h (Fig. 4Ca,Da) and 96 h (Fig. 4Cb,Db) after plating. Similarly, the proportion of migrating cells also decreased significantly, from a cumulative migrating distance of 89.3 ± 4.2% at 24 h (107 cells in four cultures) to 20.5 ± 7.5% at 96 h (93 cells in four cultures) (p < 0.001, Student's t test) and from an overall migrating distance of 37.6 ± 5.6% at 24 h to 7.1 ± 2.6% at 96 h (p < 0.01, Student's t test). Together, these findings support the hypothesis that the observed reduction of interneuron motility is regulated by cell-intrinsic mechanisms.
Figure 4.

Reduced embryonic interneuron motility during long-term culturing on a glial feeder layer. Motility of E14.5 GAD mouse interneurons in a long-term culture on glial feeder layer (E14.5/gliaf). A, B, Migratory behavior of interneurons at 24 and 96 h of culturing, respectively. At 24 h, interneurons migrated actively with bifurcated neurites; at 96 h, the migration had nearly terminated with cells exhibiting long neurites (arrowheads). Elapsed time is shown in the upper right corner of each panel. C, D, Histograms of cumulative migrating distance (C) and overall migrating distance (D) of interneurons observed 24 h (a) or 96 h (b) later. The migrating distance was significantly shorter at 96 h than 24 h. ***p < 0.001 for each test (Mann–Whitney U test). E, F, Neurite length (E) and number (F) at 24 h (a) and 96 h (b), respectively. Both were significantly increased at 96 h compared with 24 h. ***p < 0.001 for each test (Mann–Whitney U test). Number of cells: 24 h, 107 cells in four cultures; 96 h, 93 cells in four cultures. Scale bars, 20 μm.
Changes in neurite morphology were concurrent with the decreased motility. As shown in Figure 4, E and F, a significant increase in neurite length (Fig. 4Ea,Eb) and number (Fig. 4Fa,Fb) was observed, suggesting morphological differentiation in interneurons. These cells retained motility in that they alternately extended and retracted neurites (data not shown).
Distinct motility of early- and late-born cortical interneurons in cortical explants
The results described above suggest that intrinsic mechanisms are involved in the developmental reduction of cortical interneuron motility. However, although cortical interneurons actively extended and retracted neurites 96 h after plating, it may be that the reduction of their motility is a result of neuronal degradation in vitro caused by long-term culturing. To explore this possibility, we compared interneuron motility with different birth dates under the same environment by carrying out successive electroporations to the ganglionic eminences at two different developmental stages, E12.5 and E15.5, using plasmids that encode for fluorescent proteins of different colors. At E18.5, we prepared a cortical explant (Tanaka et al., 2009) and performed time-lapse analyses. Figure 5A shows migration properties of the interneurons electroporated at early and late embryonic stages in the MZ of cortical explants. Cells labeled by electroporation at E15.5 (green) showed high motility (arrows and double arrows), whereas those labeled at E12.5 (red) showed reduced motility (arrowheads and double arrowheads, see Movie 1). Quantitative analysis found both cumulative migrating distance (Fig. 5B) and overall migrating distance (Fig. 5C) were significantly longer in E15.5 electroporated cells (Fig. 5Bb,Cb) than E12.5 electroporated cells (Fig. 5Ba,Ca). Similarly, the proportion of migrating cells also increased significantly in E15.5 electroporated cells, from a cumulative migrating distance of 28.8 ± 8.7% in E12.5 electroporated cells (143 cells) to 83.2 ± 12.0% in E15.5 electroporated cells (49 cells) (p < 0.05, Student's t test) and from an overall migrating distance of 7.8 ± 3.9% in E12.5 electroporated cells to 59.5 ± 5.3% in E15.5 electroporated cells (p < 0.01, Student's t test). Together, these results indicate that late-born interneurons exhibit more pronounced motility than early-born interneurons under the same conditions. These findings indicate that their distinct motility can be ascribed to differences in cell-intrinsic properties. Given that embryonic interneurons gradually lose motility until they eventually terminate migration, these results lend support to the hypothesis that cell-intrinsic mechanisms are involved.
Figure 5.

Migration of interneurons with different birth dates in cortical explants. Time-lapse analysis of early- and late-born interneurons in cortical explants. pCAGGS-mCherry and pCAGGS-GAP-EGFP were electroporated into the ganglionic eminence of E12.5 and E15.5 embryos, respectively, and dorsal cortices were excised at E18.5. Time-lapse analysis of cortical explants was performed and viewed from the MZ side. A, Migratory behaviors of early-born (red) and late-born (green) cortical interneurons in the E18.5 cortical MZ. Interneurons labeled by electroporation at E15.5 (arrows and double arrows) showed robust motility compared with those labeled at E12.5 (arrowheads and double arrowheads). Elapsed time is shown in the lower right corner of each panel. B, C, Histograms of cumulative migrating distance (B) and overall migrating distance (C) of interneurons electroporated at E12.5 (a) or E15.5 (b). Both were significantly shorter for early-born cortical interneurons than late-born interneurons in cortical explants. ***p < 0.001 for each test (Mann–Whitney U test). Late-born cortical interneurons had significantly higher motility. Data were analyzed from three montages of movies obtained from two cortical explants. Number of cells: E12.5 electroporated cells, 143 cells; E15.5 electroporated cells, 49 cells. Scale bar, 50 μm.
Movie 1.
Differential behaviors of early-born and late-born cortical interneurons in the E18.5 cortical MZ. Migration of interneurons with different birth dates in the cortical explant corresponding to Figure 5A. E12.5 electroporated cells (red) and E15.5 electroporated cells (green) were visualized in E18.5 MZ. Late-born interneurons migrated more rapidly than early-born interneurons in the cortical explant. The movie was taken at 40 min intervals for 23 h 20 min with a confocal microscope. The movie includes 1 s of preview images at the beginning.
Regulation of KCC2 expression
Upregulation of the potassium-chloride cotransporter KCC2 has previously been shown to play a role in termination of interneuron migration (Bortone and Polleux, 2009). Thus, an interesting possibility is that KCC2 expression is intrinsically regulated to achieve termination of migration. We first examined whether KCC2 immunoreactivity is increased during postnatal development. We found weak KCC2 immunoreactivity in P0 (Fig. 6A–D) and E18.5 cortex (data not shown) in agreement with the previous study. In P7 cortex, the KCC2 immunoreactivity was substantially increased (Fig. 6E–H), which is consistent with the idea that KCC2 is involved in the termination of interneuron migration.
Figure 6.
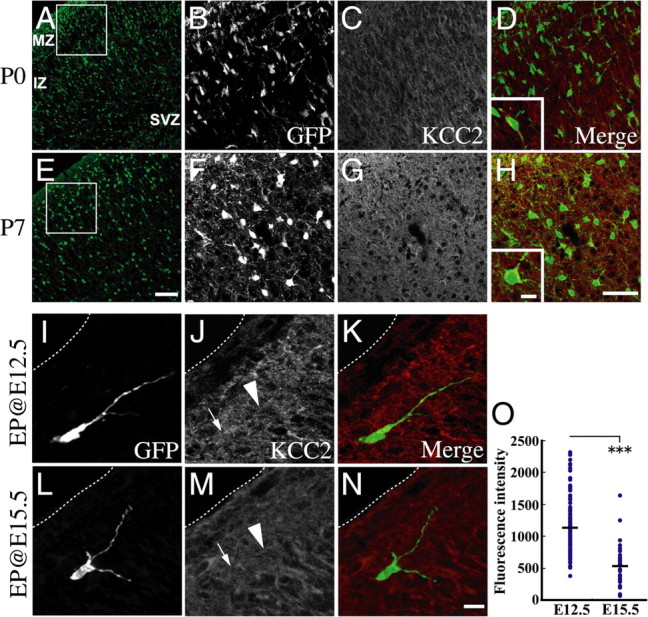
KCC2 immunoreactivities of interneurons. A–H, Immunoreactivity for GFP (A, B, E, F) and KCC2 (C, G) of the same region in P0 (A–D) and P7 (E–H) GAD mice cortex. D and H show merged images of GFP and KCC2 immunostaining. B–D and F–H show magnified images of the boxed areas in A and E, respectively. KCC2 immunoreactivities in P7 cortical interneurons are higher compared with P0 interneurons. Insets in D and H show high-magnification views of merged views illustrating KCC2 expression (red) by interneurons (green). I–O, Immunoreactivity for KCC2 in E12.5 and E15.5 electroporated cells. pCAGGS-EGFP was electroporated into the ganglionic eminence of E12.5 or E15.5 embryo of wild-type animals, and cortices were fixed at E18.5. I–N, Representative cells of KCC2 immunoreactivities in each electroporated condition. I–K, E12.5 electroporated cells. L–N, E15.5 electroporated cells. K and N show merged images of GFP (I, L) and KCC2 (J, M) staining. Arrows indicate cell bodies and arrowheads indicate processes. Dashed lines indicate the pial surface. O, Quantitative analysis of KCC2 fluorescence intensity in electroporated cells. GFP-positive cells located within the 60 μm from pial surface were collected). Average intensity of KCC2 expression in electroporated cells was calculated in each electroporated condition. Fluorescence was measured in 12 bits (value range of 0–4095). Each dot shows the intensity of each electroporated cell and bars indicate the average value. Early-born cortical interneurons exhibited significantly higher fluorescence intensity of KCC2 immunoreactivity (***p < 0.001, Mann–Whitney U test). Data were analyzed from 4 cortices. Number of cells: E12.5 electroporated cells, 115 cells; E15.5 electroporated cells, 32 cells. Scale bars: 100 μm (A, E); 50 μm (B–D, F–H); 10 μm (I–N); inset in H, 10 μm.
Because we found a difference in motility between interneurons labeled by electroporation at E12.5 and E15.5 (Fig. 5), we next compared, immunoreactivities between these cells at E18.5. We found that interneurons labeled both at E12.5 (Fig. 6I–K) and E15.5 (Fig. 6L–N) expressed KCC2 at E18.5. Quantitative analyses demonstrated that the interneurons labeled at E12.5 exhibited higher KCC2 immunoreactivities compared with those at E15.5 (Fig. 6O). These findings raise the possibility that developmental changes of KCC2 expression is regulated by a cell-intrinsic mechanism(s).
Environmental influence on interneuron migration
While the above results confirm intrinsic mechanisms contribute to the reduction of embryonic interneuron motility, they do not confirm that these mechanisms are exclusive. To assess the potential influence of extrinsic factors, we seeded E14.5 or P7 GAD mouse cortical neurons on heterochronic wild-type cortical feeder layers and compared these migratory behaviors with those observed on isochronic cortical feeder layers. Figure 7, A and B, shows examples of E14.5 and P7 interneurons each seeded on a feeder layer of E14.5 or P7 cortical cells. E14.5/E14.5f neurons exhibited high motility (Fig. 7Ba,Ca,Da). In contrast, E14.5/P7f neurons showed significantly lower motility (Fig. 7Cb, Db) as exhibited by the overlap of the neuronal position between two time points (Fig. 7A, top right; see also Bb). In general, the proportion of migrating cells was higher for E14.5/E14.5f neurons than E14.5/P7f neurons (Fig. 7E,F). P7/P7f neurons retained some motility, but migrated only short distances (Fig. 7Bc,Cc,Dc). Overall, these results indicate that P7 feeder cells regulate the motility of E14.5 interneurons negatively.
Figure 7.
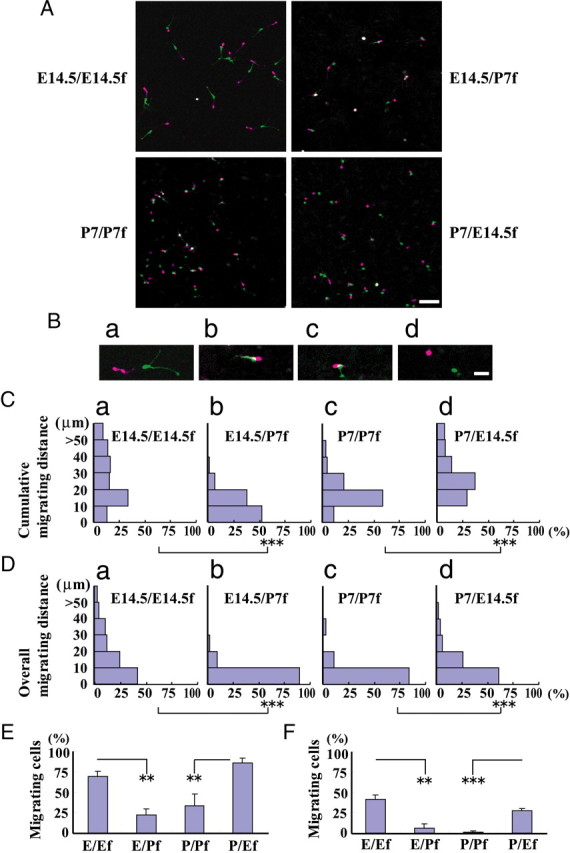
Migration of interneurons on isochronic and heterochronic cortical feeder layers. Dissociated cortical cultures were prepared from the brains of E14.5 and P7 GAD mice. Suspensions were overlaid onto the suspensions of E14.5 or P7 wild-type mice. A, Merged images of E14.5/E14.5f neurons, E14.5/P7f neurons, P7/P7f neurons, and P7/E14.5f neurons, respectively, at the beginning (purple) and end (green) of time-lapse analysis. Time-lapse analysis was performed after 36–39 h of cultivation. Time interval, 85 min. B, Representative images captured from the images shown in A. a–d, E14.5/E14.5f neurons, E14.5/P7f neurons, P7/P7f neurons, and P7/E14.5f neurons, respectively. The white signal in b and c indicates low motility. C, D, Cumulative migrating distances (C) and overall migrating distances (D). E14.5/P7f neuron motility was significantly less than that of E14.5 feeder layer cells. In contrast, P7/E14.5f neuron motility was significantly higher than that of P7/P7f neurons. ***p < 0.001 (Mann–Whitney U test). E, F, Proportion of migrating cells. E, Cumulative migrating distance. F, Overall migrating distance. Bars represent the SEM. **p < 0.01, ***p < 0.001 (ANOVA, Bonferroni). Number of cells: E14.5/E14.5, 136 cells in five cultures; E14.5/P7, 55 cells in five cultures; P7/P7, 62 cells in five cultures; P7/E14.5, 102 cells in five cultures. Scale bars: A, 50 μm; B, 20 μm.
Conversely, the motility of P7/E14.5f neurons was higher compared with P7/P7f neurons (compare Fig. 7Bc,Cc,Dc with Bd,Cd,Dd), as some of these neurons alternated their direction of migration and extended short neurites, although in a manner distinct from that of E14.5/E14.5f neurons (data not shown). Furthermore, the proportion of migrating cells was higher for P7/E14.5f neurons than P7/P7f neurons (Fig. 7E,F). These results suggest that E14.5 feeder cells regulate the motility of P7 interneurons positively.
Postnatal cortical cells may release factors that suppress the migration of embryonic interneurons
Although the above results show extrinsic factors can regulate the migration of cortical interneurons, whether the putative factors are secreted or membrane-bound remains unsolved. If a secreted factor contributes to the reduction in postnatal neurons, cell motility should change when E14.5 interneurons are physically separated from P7 neurons. To explore this possibility, we examined the migration of E14.5 interneurons plated on an E14.5 feeder layer in the presence of P7 dissociated cortical cells seeded on a Millicell membrane placed above the E14.5 neurons (Fig. 8A), which prevents contact between embryonic interneurons and P7 cells. In this case, E14.5 interneuron motility decreased (Fig. 8Bb) compared with control cultures without P7 cells on the Millicell membrane (Fig. 8Ba). Figure 8, C and D, shows histograms of the cumulative migration distance and overall migration distance of E14.5 GAD67-GFP cortical interneurons on an E14.5 feeder layer in the presence (Fig. 8Cb,Db) or absence (Fig. 8Ca,Da) of P7 cortical cells. As can be seen, the distribution shifted toward significantly shorter migration distances in the presence of P7 cells. These results suggest that P7 cortical cells release factors that downregulate the migration of embryonic cortical interneurons.
Figure 8.

Postnatal cortical cell release factors that suppress embryonic interneuron migration. A, Schematic illustrating of the experimental arrangement. A cell suspension of E14.5 GAD mouse cortices was plated onto an E14.5 wild-type cortical feeder layer, whereas P7 cortical cells were plated onto a Millicell membrane placed above the embryonic neurons. B, Merged images captured at the beginning (purple) and end (green) of the culture. Time-lapse analysis was performed after 36–39 h of culture. a, E14.5 interneurons on the E14.5 cortical feeder layer only; b, interneurons in the presence of P7 cortical cells. Time interval, 85 min. The white signal in b indicates low cell motility. C, D, Histograms of cumulative migration distance (C) and overall migration distance (D) in the absence (a) and presence (b) of P7 cortical cells on the Millicell membrane. E14.5 interneuron migration distance became shorter when cocultured with P7 cortical cells. *p < 0.05, ***p < 0.001 (Mann–Whitney U test). Number of cells: E14.5 interneurons on E14.5 cortical feeder layer, 144 cells in nine cultures; cocultured with P7 cortical cells, 139 cells in nine cultures. Scale bar, 20 μm.
Discussion
Migrating neurons must eventually stop their migration when settling at their final destination. In cortical slices, interneurons do this by gradually losing their motility during early postnatal development. Our findings that embryonic interneurons reduce their motility and almost terminate migration after long-term culturing on glial feeder cells raise the possibility that intrinsic mechanisms may contribute to the termination process. This was supported by the observation that late-born interneurons migrated more actively than early-born interneurons in the same cortical explant. We also found evidence suggesting involvement of KCC2 upregulation in this process. In addition, reduced motility in embryonic neurons on feeder cells by postnatal cortical cells suggests that cells in the postnatal cortex express factors that also regulate the termination. Together, these results suggest both intrinsic mechanisms and extrinsic factors determine the termination of interneuron migration.
Termination of interneuron migration can be recapitulated in a dissociated culture
We found that most cortical interneurons in a dissociated culture migrated actively in embryonic and early postnatal stages, whereas motility was largely abolished at P7 (Fig. 2). We also found that GAD mouse interneurons in cortical slices had nearly terminated migration at P5–P6. This is supported by a previous slice culture experiment that used Lhx6-EGFP transgenic mice to demonstrate that interneuron motility is almost abolished at P7 (Bortone and Polleux, 2009).
Furthermore, we showed that both the number and length of neurites were profoundly increased in our long-term culturing. These findings agree with our recent finding that many cortical interneurons in newborn mouse cortical explants labeled by electroporation at E12.5 extend several processes, one of which assumes an axon-like morphology (Yamasaki et al., 2010) and indicate that interneuron maturation proceeds normally in our culture conditions.
Most interneurons labeled by in utero electroporation at E12.5 accumulate in the MZ at E18.5 and then descend to the CP (Tanaka et al., 2009; Yamasaki et al., 2010). The motility of these neurons appeared to be greatly reduced in the MZ (Fig. 5), suggesting that the reduction takes place before they descend to the CP. The reduction of motility observed in dissociated postnatal neurons here is consistent with these observations.
Intrinsic regulation of the motility reduction
Cortical interneuron motility was reduced during long-term culturing on cortical feeder cells as well as on glial cells (Figs. 3, 4). Because the glial cells had been cultivated for a long period (2 weeks), it seems unlikely they substantially changed their properties during the subsequent 3 d (24–96 h after cortical cell plating) in a way that causes negative regulation of the plated neuron motility. Thus, it is most likely that the reduced motility of interneurons on glial feeder cells occurred cell autonomously. In addition, the fact that the reduced motility of interneurons was comparable between two different experiments (on cortical feeder cells and glial feeder cells) supports the hypothesis that intrinsic regulation governs their motility.
Intrinsic regulation of interneuron motility was further supported by an independent series of experiments in which the motility of interneurons labeled at two different developmental stages was compared (Fig. 5). Interneurons labeled (from the MGE) at E15.5 showed higher motility than those labeled (there) at E12.5 when observed at E18.5 in the same cortical explant. That the environment for the two was the same raises the possibility that cell-intrinsic mechanisms play an important role in motility regulation Moreover, given that these experiments were performed using cortical explants that allowed for both intrinsic and extrinsic factors to operate, it is likely that intrinsic regulation plays an important role during in vivo development at least during the embryonic stage studied. In agreement with our findings, a previous report showed that isolated granule cells in microexplant cultures of postnatal mouse cerebellum gradually lose their motility and that in in vitro culture they become permanently stationary following a time course similar to that of in vivo development (Yacubova and Komuro, 2002; see also Trenkner et al., 1984).
Although our results show their contribution, little is known about the details of the cell-intrinsic mechanisms. Possible clues come from a report that showed a loss of Ca2+ transients triggers the completion of cerebellar granule neuron migration (Kumada and Komuro, 2004). As this was observed in isolated cells, it is likely that timing of the loss of Ca2+ elevations is regulated by a cell intrinsic mechanism. Additionally, a recent study has shown that upregulation of the potassium-chloride cotransporter KCC2 plays a role in reducing interneuron motility by reducing the membrane potential upon GABAA receptor activation (Bortone and Polleux, 2009). These studies raise the possibility that intrinsic regulation of KCC2 might be involved.
The present results provided evidence suggesting intrinsic regulation of KCC2 expression. We observed an increase in KCC2 immunoreactivity in cortical interneurons during postnatal development. We also found higher KCC2 immunoreactivities in E12.5 electroporated interneurons compared with E15.5 electroporated ones when observed at E18.5. Because they were compared in the same environment (at the same developmental stage, E18.5), it is likely that (up)regulation of KCC2 expression was controlled by a cell-intrinsic mechanism(s).
There is evidence suggesting that interneurons born at different stages of development invade the CP at different times (Hevner et al., 2004; Pla et al., 2006; López-Bendito et al., 2008; Tanaka et al., 2009). Together, the present results that interneurons labeled at an earlier developmental stage showed lower motility at E18.5, time when these neurons appear to initiate invasion into the CP raise the possibility that reduction of interneuron motility occurs before their invasion into the CP in a birthdate-dependent manner.
Environmental regulation of interneuron motility
Our finding that interneuron motility was far less pronounced when embryonic interneurons were cultured on postnatal cortical cells compared with embryonic neurons (compare Fig. 7Ca with Cb and Da with Db; see also E,F) suggests that environmental factors may also contribute to the termination of interneuron migration. Whether these environmental factors were secreted factors or membrane-associated factors cannot be determined from observing interneuron behavior on feeder cells (Fig. 7). Therefore, we applied two-level culture dish experiments, finding secreted factors from postnatal cortical cells are the regulators.
The fact that KCC2 expression is increased with development supports the idea that ambient GABA acts as a stop signal (Bortone and Polleux, 2009). Previously, we found that there are no notable differences in the distribution, cellular morphology or migratory behaviors of GABAergic interneurons, in E13.5 and E15.5 cortex, between heterozygous (Gad67gfp/+) and homozygous (Gad67gfp/gfp) mice, in which GABA should be greatly diminished (Asada et al., 1997). Although we do not know the exact reason for this apparent inconsistency, it may be because the expression levels of KCC2 in E13.5 and E15.5 cortical interneurons are too low to affect the motility of the interneurons.
Morphological changes associated with the reduced interneuron motility
In the present study, we found that the decrease in the number and increase in length of neurites occurred during long-term culturing, indicating that the morphology of GABAergic interneurons was also altered. The fact that these changes occurred on glial feeder cells and concurrently with the changes in motility (Figs. 3, 4) raises the possibility that morphological changes were triggered by a reduction in their motility. This, however, seems unlikely, because in the experiments in which embryonic interneuron motility was downregulated by postnatal neurons, we did not observe morphological changes like those in long-term culturing. Therefore, it is likely that the reduction in motility and changes in morphology took place independently. The process of interneuron maturation may be a complex phenomenon that is under various transcriptional regulations (Okaty et al., 2009).
In conclusion, the present study demonstrates that reduced embryonic interneuron motility is regulated by cell-intrinsic and extracellular mechanisms. Our results suggest that the intrinsic regulation plays an important role during embryonic development, while extrinsic factors, such as secreted factors, contribute postnatally. Combined, these regulatory factors may act cooperatively to downregulate motility during the entire course of development, eventually leading to migration termination.
Footnotes
The authors declare no competing financial interests.
This work was supported by a Grant-in-Aid for Scientific Research (2222004) to F.M. from the Ministry of Education, Culture, Sports, Science and Technology, Japan. We thank Dr. Roger Tsien for tdTomato construct; Dr. Daisuke H. Tanaka for technical advice and discussion, and Drs. Katsuhiko Ono, Yasuto Tanabe, Yan Zhu, and Peter Karagiannis for critical reading and comments.
References
- Anderson SA, Eisenstat DD, Shi L, Rubenstein JL. Interneuron migration from basal forebrain to neocortex: dependence on Dlx genes. Science. 1997;278:474–476. doi: 10.1126/science.278.5337.474. [DOI] [PubMed] [Google Scholar]
- Anderson SA, Marín O, Horn C, Jennings K, Rubenstein JL. Distinct cortical migrations from the medial and lateral ganglionic eminences. Development. 2001;128:353–363. doi: 10.1242/dev.128.3.353. [DOI] [PubMed] [Google Scholar]
- Asada H, Kawamura Y, Maruyama K, Kume H, Ding RG, Kanbara N, Kuzume H, Sanbo M, Yagi T, Obata K. Cleft palate and decreased brain gamma-aminobutyric acid in mice lacking the 67-kDa isoform of glutamic acid decarboxylase. Proc Natl Acad Sci U S A. 1997;94:6496–6499. doi: 10.1073/pnas.94.12.6496. [DOI] [PMC free article] [PubMed] [Google Scholar]
- Bortone D, Polleux F. KCC2 expression promotes the termination of cortical interneuron migration in a voltage-sensitive calcium-dependent manner. Neuron. 2009;62:53–71. doi: 10.1016/j.neuron.2009.01.034. [DOI] [PMC free article] [PubMed] [Google Scholar]
- Cameron DB, Galas L, Jiang Y, Raoult E, Vaudry D, Komuro H. Cerebellar cortical-layer-specific control of neuronal migration by pituitary adenylate cyclase-activating polypeptide. Neuroscience. 2007;146:697–712. doi: 10.1016/j.neuroscience.2007.02.025. [DOI] [PMC free article] [PubMed] [Google Scholar]
- Fairén A, Cobas A, Fonseca M. Times of generation of glutamic acid decarboxylase immunoreactive neurons in mouse somatosensory cortex. J Comp Neurol. 1986;251:67–83. doi: 10.1002/cne.902510105. [DOI] [PubMed] [Google Scholar]
- Hevner RF, Daza RA, Englund C, Kohtz J, Fink A. Postnatal shifts of interneuron position in the neocortex of normal and reeler mice: evidence for inward radial migration. Neuroscience. 2004;124:605–618. doi: 10.1016/j.neuroscience.2003.11.033. [DOI] [PubMed] [Google Scholar]
- Kanatani S, Yozu M, Tabata H, Nakajima K. COUP-TFII is preferentially expressed in the caudal ganglionic eminence and is involved in the caudal migratory stream. J Neurosci. 2008;28:13582–13591. doi: 10.1523/JNEUROSCI.2132-08.2008. [DOI] [PMC free article] [PubMed] [Google Scholar]
- Kumada T, Komuro H. Completion of neuronal migration regulated by loss of Ca2+ transients. Proc Natl Acad Sci U S A. 2004;101:8479–8484. doi: 10.1073/pnas.0401000101. [DOI] [PMC free article] [PubMed] [Google Scholar]
- López-Bendito G, Sánchez-Alcañiz JA, Pla R, Borrell V, Picó E, Valdeolmillos M, Marín O. Chemokine signaling controls intracortical migration and final distribution of GABAergic interneurons. J Neurosci. 2008;28:1613–1624. doi: 10.1523/JNEUROSCI.4651-07.2008. [DOI] [PMC free article] [PubMed] [Google Scholar]
- Lysko DE, Putt M, Golden JA. SDF1 regulates leading process branching and speed of migrating interneurons. J Neurosci. 2011;31:1739–1745. doi: 10.1523/JNEUROSCI.3118-10.2011. [DOI] [PMC free article] [PubMed] [Google Scholar]
- Marín O, Valiente M, Ge X, Tsai LH. Guiding neuronal cell migrations. Cold Spring Harb Perspect Biol. 2010;2:a001834. doi: 10.1101/cshperspect.a001834. [DOI] [PMC free article] [PubMed] [Google Scholar]
- Métin C, Baudoin JP, Rakić S, Parnavelas JG. Cell and molecular mechanisms involved in the migration of cortical interneurons. Eur J Neurosci. 2006;23:894–900. doi: 10.1111/j.1460-9568.2006.04630.x. [DOI] [PubMed] [Google Scholar]
- Miyoshi G, Hjerling-Leffler J, Karayannis T, Sousa VH, Butt SJ, Battiste J, Johnson JE, Machold RP, Fishell G. Genetic fate mapping reveals that the caudal ganglionic eminence produces a large and diverse population of superficial cortical interneurons. J Neurosci. 2010;30:1582–1594. doi: 10.1523/JNEUROSCI.4515-09.2010. [DOI] [PMC free article] [PubMed] [Google Scholar]
- Nadarajah B, Parnavelas JG. Modes of neuronal migration in the developing cerebral cortex. Nat Rev Neurosci. 2002;3:423–432. doi: 10.1038/nrn845. [DOI] [PubMed] [Google Scholar]
- Nakanishi K, Okouchi Y, Ueki T, Asai K, Isobe I, Eksioglu YZ, Kato T, Hasegawa Y, Kuroda Y. Astrocytic contribution to functioning synapse formation estimated by spontaneous neuronal intracellular Ca2+ oscillations. Brain Res. 1994;659:69–78. doi: 10.1016/0006-8993(94)90876-1. [DOI] [PubMed] [Google Scholar]
- Nery S, Fishell G, Corbin JG. The caudal ganglionic eminence is a source of distinct cortical and subcortical cell populations. Nat Neurosci. 2002;5:1279–1287. doi: 10.1038/nn971. [DOI] [PubMed] [Google Scholar]
- Okaty BW, Miller MN, Sugino K, Hempel CM, Nelson SB. Transcriptional and electrophysiological maturation of neocortical fast-spiking GABAergic interneurons. J Neurosci. 2009;29:7040–7052. doi: 10.1523/JNEUROSCI.0105-09.2009. [DOI] [PMC free article] [PubMed] [Google Scholar]
- Pla R, Borrell V, Flames N, Marín O. Layer acquisition by cortical GABAergic interneurons is independent of Reelin signaling. J Neurosci. 2006;26:6924–6934. doi: 10.1523/JNEUROSCI.0245-06.2006. [DOI] [PMC free article] [PubMed] [Google Scholar]
- Polleux F, Whitford KL, Dijkhuizen PA, Vitalis T, Ghosh A. Control of cortical interneuron migration by neurotrophins and PI3-kinase signaling. Development. 2002;129:3147–3160. doi: 10.1242/dev.129.13.3147. [DOI] [PubMed] [Google Scholar]
- Powell EM, Mars WM, Levitt P. Hepatocyte growth factor/scatter factor is a motogen for interneurons migrating from the ventral to dorsal telencephalon. Neuron. 2001;30:79–89. doi: 10.1016/s0896-6273(01)00264-1. [DOI] [PubMed] [Google Scholar]
- Pozas E, Ibáñez CF. GDNF and GFRalpha1 promote differentiation and tangential migration of cortical GABAergic neurons. Neuron. 2005;45:701–713. doi: 10.1016/j.neuron.2005.01.043. [DOI] [PubMed] [Google Scholar]
- Tamamaki N, Fujimori KE, Takauji R. Origin and route of tangentially migrating neurons in the developing neocortical intermediate zone. J Neurosci. 1997;17:8313–8323. doi: 10.1523/JNEUROSCI.17-21-08313.1997. [DOI] [PMC free article] [PubMed] [Google Scholar]
- Tamamaki N, Yanagawa Y, Tomioka R, Miyazaki J, Obata K, Kaneko T. Green fluorescent protein expression and colocalization with calretinin, parvalbumin, and somatostatin in the GAD67-GFP knock-in mouse. J Comp Neurol. 2003;467:60–79. doi: 10.1002/cne.10905. [DOI] [PubMed] [Google Scholar]
- Tanaka DH, Maekawa K, Yanagawa Y, Obata K, Murakami F. Multidirectional and multizonal tangential migration of GABAergic interneurons in the developing cerebral cortex. Development. 2006;133:2167–2176. doi: 10.1242/dev.02382. [DOI] [PubMed] [Google Scholar]
- Tanaka DH, Yanagida M, Zhu Y, Mikami S, Nagasawa T, Miyazaki J, Yanagawa Y, Obata K, Murakami F. Random walk behavior of migrating cortical interneurons in the marginal zone: time-lapse analysis in flat-mount cortex. J Neurosci. 2009;29:1300–1311. doi: 10.1523/JNEUROSCI.5446-08.2009. [DOI] [PMC free article] [PubMed] [Google Scholar]
- Tanaka DH, Mikami S, Nagasawa T, Miyazaki J, Nakajima K, Murakami F. CXCR4 is required for proper regional and laminar distribution of cortical somatostatin-, calretinin-, and neuropeptide Y-expressing GABAergic interneurons. Cereb Cortex. 2010;20:2810–2817. doi: 10.1093/cercor/bhq027. [DOI] [PubMed] [Google Scholar]
- Tanaka D, Nakaya Y, Yanagawa Y, Obata K, Murakami F. Multimodal tangential migration of neocortical GABAergic neurons independent of GPI-anchored proteins. Development. 2003;130:5803–5813. doi: 10.1242/dev.00825. [DOI] [PubMed] [Google Scholar]
- Trenkner E, Smith D, Segil N. Is cerebellar granule cell migration regulated by an internal clock? J Neurosci. 1984;4:2850–2855. doi: 10.1523/JNEUROSCI.04-11-02850.1984. [DOI] [PMC free article] [PubMed] [Google Scholar]
- Yacubova E, Komuro H. Intrinsic program for migration of cerebellar granule cells in vitro. J Neurosci. 2002;22:5966–5981. doi: 10.1523/JNEUROSCI.22-14-05966.2002. [DOI] [PMC free article] [PubMed] [Google Scholar]
- Yamasaki E, Tanaka DH, Yanagawa Y, Murakami F. Cortical GABAergic interneurons transiently assume a sea urchin-like nonpolarized shape before axon initiation. J Neurosci. 2010;30:15221–15227. doi: 10.1523/JNEUROSCI.1527-10.2010. [DOI] [PMC free article] [PubMed] [Google Scholar]
- Yozu M, Tabata H, Nakajima K. The caudal migratory stream: a novel migratory stream of interneurons derived from the caudal ganglionic eminence in the developing mouse forebrain. J Neurosci. 2005;25:7268–7277. doi: 10.1523/JNEUROSCI.2072-05.2005. [DOI] [PMC free article] [PubMed] [Google Scholar]