

Abstract
In spinal cord slices from newborn mice we have analyzed the kinetics of the EPSCs mediated by heteromeric nicotinic receptors at the motoneuron–Renshaw cell (MN-RC) synapse. The miniature EPSCs decay with a time constant of 13.0 ± 1.1 ms whereas the decay of the evoked EPSCs (eEPSCs) is biphasic, with time constants of 15.6 ± 0.8 and 124.8 ± 9.0 ms. The slow component becomes prominent during a repetitive stimulation, but its time constant is unchanged. It is selectively reduced by the addition of acetylcholinesterase (AChE), and thus appears to involve ACh spillover. The constancy of the slow time constant during a train is best explained by a local spillover activating high-affinity receptors. In many cells a fraction of the eEPSC originates in neighboring RCs and is transmitted by the low-pass filter of the gap junctions. The component transmitted electrically can be eliminated by meclofenamic acid, a blocker of gap junctions. The local spillover produced by a repetitive stimulation was compared with the long-range spillover produced by inactivation of AChE. The pharmacological inactivation of AChE by neostigmine caused the appearance of an ultra-slow (second range) decay component in eEPSCs and also a continuous inward current interpreted as resulting from a continuous ACh presence. In animals lacking functional AChE in the CNS (PRiMA−/− mice) the EPSCs resembled those observed in neostigmine but the steady inward current was much smaller, suggesting an adaptation to the absence of AChE.
Introduction
Central nicotinic synapses involving postsynaptic nicotinic acetylcholine receptors (nAChRs) are present in many vertebrate central neurons (Dani and Bertrand, 2007; Albuquerque et al., 2009). These synapses have often been assumed to resemble the better known peripheral nicotinic synapses, but this analogy is limited by the differences in the subunit composition of the nAChRs and by the differences in organization of the synapses. In the best studied peripheral nicotinic synapses, the endplate and the ciliary ganglion calyceal synapse, a single presynaptic axon with multiple active zones, releases ACh over a large postsynaptic area, whereas in most central nicotinic synapses multiple axons make punctate contacts on the postsynaptic dendrites. At the neuromuscular junction AChE is mostly produced postsynaptically and anchored by collagen Q (Bernard et al., 2011), whereas in central neurons AChE is produced presynaptically and anchored by PRiMA (Dobbertin et al., 2009). One therefore expects significant differences in the dynamics of peripheral and central nicotinic synapses, particularly during repetitive activation of presynaptic neurons. This question is of particular importance because of the contradiction between data suggesting that the exceptionally high turnover rate of AChE prevents any spillover (Zimmerman and Soreq, 2006) and data suggesting that in the CNS an important fraction of the released ACh can escape hydrolysis and spill over to distant targets (Lendvai and Vizi, 2008).
The analysis of spillover in central nicotinic synapses has been hampered by the fact that it is rarely possible to attribute nicotinic EPSPs or EPSCs to identified presynaptic neurons (Bell et al., 2011; Ren et al., 2011). One of the few central cholinergic synapses in which the presynaptic axons can be selectively stimulated is the MN-RC synapse (Eccles et al., 1954; Dourado and Sargent, 2002), the organization of which is typical of central synapses (Alvarez et al., 1999). The EPSCs induced by MNs at this synapse have both glutamatergic and nicotinic components (Mentis et al., 2005; Nishimaru et al., 2005) and the nicotinic component involves both homomeric α7 and heteromeric nAChRs (Lamotte d'Incamps and Ascher, 2008). In the present study we analyzed in voltage-clamp conditions the EPSCs mediated by heteromeric nAChRs to evaluate the evidence for spillover after a repetitive stimulation of the MNs as well as after inactivation of AChE. We found evidence for spillover in both cases using the addition of extracellular AChE, which reduced the slow current amplified by a repetitive stimulation, and suppressed the ultra-slow component induced by AChE inactivation. We also found that a fraction of the EPSCS results from an electrical coupling between RCs in which the depolarization of neighboring RCs is transmitted to the cell from which one records. Thus both spillover and electrical coupling contribute to the long-lasting nicotinic EPSCs of the RCs.
Materials and Methods
Animals and slice preparation.
C57BL/6J mice (Janvier) or PRiMA−/− mice (P5–P10) (Dobbertin et al., 2009) of either sex were anesthetized with an intraperitoneal injection of 0.1 ml of pentobarbital (25 mm). An intracardiac perfusion was performed using ice-cold low Na solution containing the following (in mm): 3 KCl, 1.25 NaH2PO4, 230 sucrose, 26 NaHCO3, 0.8 CaCl2, 8 MgCl2, 25 glucose, 0.4 ascorbic acid, 1 kynurenic acid, and 2 Na pyruvate bubbled with 95% O2 and 5% CO2, pH 7.4. After decapitation the laminectomy was performed at ∼4°C in the same solution. After sectioning of the roots, the cord was transferred to a high K solution, as described by Dugué et al. (2005) but enriched with 2 mm Na pyruvate, then embedded into a 2% agar (high K) solution at 38°C. After cooling to 4°C, the agar block containing the spinal cord was glued in the chamber of the slicer and 400-μm-thick slices were cut in the high K solution. The slices were cut obliquely (35°) relative to the axis of the spinal cord to conserve the MN axons. The slices were transferred into artificial CSF (ACSF) containing the following (in mm): 130 NaCl, 2.5 KCl, 2 CaCl2, 1 MgCl2, 1.3 NaH2PO4, 26 NaHCO3, 25 glucose, 0.4 ascorbic acid, and 2 Na pyruvate) bubbled with 95% O2 and 5% CO2, pH 7.4. The transfer was made in ACSF at 34°C. After 30 min the ACSF was brought to room temperature (18−24°C).
Electrophysiology.
The recording chamber was continuously perfused with ACSF at a rate of 1–2 ml/min, at a temperature between 20 and 23°C. The RCs were found in the region of lamina VII where the axons of the MNs converge to make two to three axon bundles. They were identified by their characteristic response to a single ventral rootlet (VR) stimulation (a train of action potentials) in the cell-attached mode (Lamotte d'Incamps and Ascher, 2008), then voltage-clamped in the whole-cell configuration. Patch pipettes had an initial open-tip resistance of 3–6 MΩ. The internal solution contained the following (in mm): 125 Cs-gluconate, 5 QX314 Cl, 10 HEPES, 10 EGTA, 1 CaCl2, 4 Mg-ATP, and 0.4 Na2GTP. The pH was adjusted to 7.3 with CsOH, and the osmolarity to 285–295 mOsm. Spermine (100 μm) was added in the experiments in which the cell was brought to positive membrane potentials (Haghighi and Cooper, 1998). Membrane potentials were corrected for the liquid junction potential (Vj = −15 mV) measured as indicated by Neher (1992). Except when indicated, the recordings illustrated were obtained at −60 mV.
In the search for electrically coupled RCs, one of the cells was recorded with the usual Cs-gluconate solution, while for the other one we used a K-gluconate solution containing the following (in mm): 140 K-gluconate, 6 KCl, 10 HEPES, 1 EGTA, 0.1 CaCl2, 4 Mg-ATP, and 0.3 Na2GTP. The pH was adjusted to 7.3 with KOH, and the osmolarity to 285–295 mOsm.
The slices used contained a VR of sufficient length to be mounted on a suction stimulation electrode and a glass pipette with a tip size adapted to the diameter of the rootlet (40–170 μm) and filled with ACSF. The stimulus intensity was varied between 1 and 50 V; the stimulus duration was varied between 10 and 300 μs. Bipolar pulses were used in all cases. We compared the responses to single pulses with the responses to 5-pulse trains (frequency 100 Hz). Single pulses and pulse trains were repeated at 10 s intervals.
In all experiments the glutamatergic components of the MN-RC response (Lamotte d'Incamps and Ascher, 2008) were suppressed by adding 2,3-dioxo-6-nitro-7-sulfonyl-benzo[f]quinoxaline (NBQX) (2 μm) to block the AMPA receptors and d(−)-2-amino-5-phosphonovaleric acid (d-APV) (50 μm) to block NMDA receptors. This concentration of d-APV, which was sufficient to block the NMDA-dependent EPSCs recorded at negative potentials (Lamotte d'Incamps and Ascher, 2008), turned out to be insufficient to block the responses recorded at positive potentials, particularly those induced by repetitive stimulations (see Results). Complete blockade could be obtained by the addition of a glycine site blocker, 5,7-dichloro-kynurenic acid (DCKA) (20 μm) (Lowe, 2003). The α7 synaptic currents were blocked by methyllycaconitine (10 nm). The contribution of GABAergic and glycinergic inputs was usually negligible at −60 mV since this potential is close to their reversal potential in our experimental conditions. We nevertheless added strychnine (1 μm) and SR 95531 (gabazine) (3 μm) in most experiments (and in particular for noise analysis and miniature EPSCs [mEPSC] recordings).
To reduce electrical coupling we selected meclofenamic acid (MFA) at 50 μm (Pan et al., 2007). This compound was found to produce fewer side effects than carbenoxolone but was far from ideal since it reduced the excitability of the MN axons and, at the concentration selected, it usually required at least 45 min to reach its maximal effect.
AChE was applied at a final concentration of 10–40 μg/ml (Parnas et al., 2005). Before AChE application the flow of the solution was stopped for at least 10 min, and the AChE was only applied if the amplitude of the response had remained stable. EPSC measurements in the presence of AChE were made with the flow halted.
NBQX, d-APV, and gabazine were purchased from Tocris Bioscience and Ascent. QX-314 chloride was from Alomone Labs. AChE (G4 molecular form; Electrophorus) was purchased from Spibio. All of the other chemicals were from Sigma.
Data acquisition and analysis.
A HEKA EPC-9 amplifier was used for data acquisition. Whole-cell recordings were filtered at 3 kHz and digitized at 10 kHz. The series resistance compensation implemented in the HEKA Patchmaster was applied in some experiments (80%), but it tended to increase the noise and caused the stimulation artifact to obscure the rising phase of the RC response. The rise time of the response, τp, was measured as the interval between 20 and 80% of the peak response. The decay times were measured in most experiments by fitting a double exponential fit and calculating a weighted decay time τw = (a1.τ1 + a2.τ2)/(a1 + a2) where a1 and a2 are the amplitudes of the two components with time constants τ1 and τ2. a1(1p) and a2(1p) were the values calculated for the responses to a single pulse, a1 (5p) and a2 (5p) those calculated for the peak of the response to the fifth pulse of a train. A triple exponential fit was used for some data (see Figure 7B).
Figure 7.
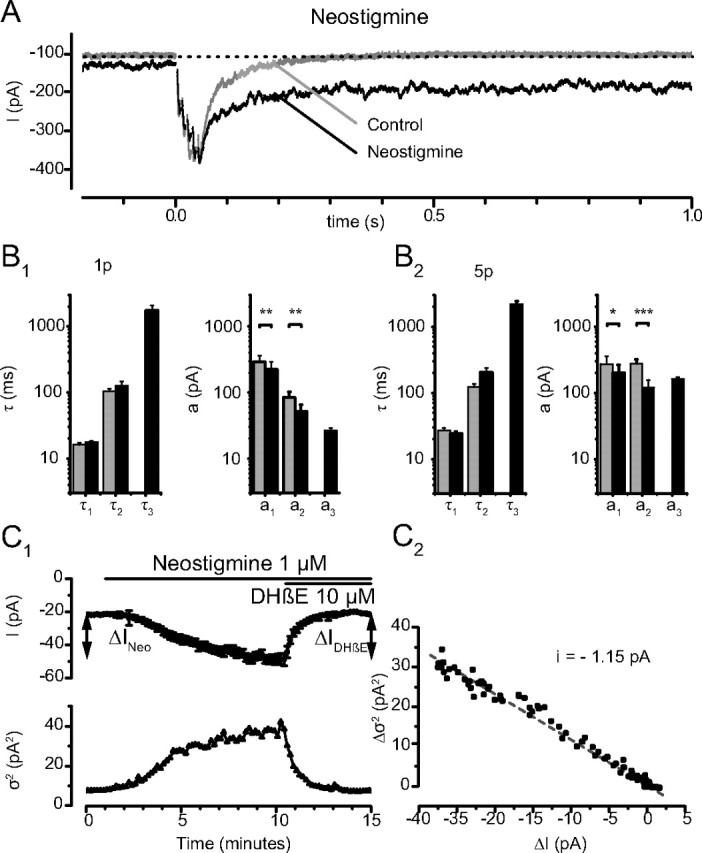
Effects of neostigmine on the EPSCs. A, Single traces of a 5p-EPSC before (Control) and 5 min after addition of neostigmine (1 μm). The holding current increased and the decay of the EPSC was greatly prolonged; note the increased noise of the holding current. B, Analysis of the decay of the EPSCs before (gray) and in the presence of neostigmine (black); note the logarithmic scale. B1, 1p-EPSCs. B2, 5p-EPSCs. Neostigmine adds to the decay an ultra-slow component (τ3 (1p) = 1741 ± 329 ms; τ3(5p) = 2188 ± 234 ms; n = 6). The time constants describing the 1p-EPSC are unaffected, (1p: τ1(CTL) = 16.1 ± 1.3 ms, τ1(NEO) = 17.8 ± 0.8 ms, p = 0.20; τ2(CTL) = 104.4 ± 10.0 ms, τ2(NEO) = 127.4 ± 19.5 ms, p = 0.40) and the time constants for 5p-EPSCs show a nonsignificant decrease (5p: τ1(CTL) = 27.0 ± 2.7 ms, τ1(NEO) = 24.2 ± 2.2 ms, p = 0.17; τ2(CTL) = 122.3 ± 15.2 ms, τ2(NEO) = 206.2 ± 30.9, p = 0.05). The amplitudes a1 and a2 decreased significantly (1p: a1(CTL) = −293.9 ± 69.6 pA, a1(NEO) = −224.2 ± 64.3 pA, p = 0.01; a2(CTL) = −85.1 ± 16.5 pA, a2(NEO) = −51.6 ± 13.5 pA, p = 0.01) and (5p: a1(CTL) = −273.8 ± 86.7 pA, a1(NEO) = −199.0 ± 64.6 pA, p = 0.03; a2(CTL)= −277.4 ± 44.4 pA, a2(NEO)= −121.4 ± 34.8 pA, p = 0.002). This effect was time dependent (data not shown). C, Steady current induced by neostigmine. Neostigmine (1 μm) induced a progressive increase of the holding current I (C1, top). The amplitude of the additional current, ΔINeo, was −32.6 ± 4.1 pA (n = 19). The subsequent application of DHβE (10 μm) reversed the effect of neostigmine and reduced the holding current by ΔIDHβE = 32.0 ± 5.0 pA (n = 14). The increase of the holding current after addition of neostigmine was associated with an increased variance, and the effect of DHβE with a decreased variance (C1, Bottom, Each point corresponds to the average of the values measured during 200 ms). C2, The elementary current l was calculated as i = Δσ2/ΔI = −1.15 pA.
Student's t tests (paired unless otherwise stated) were used to assess the difference between two samples. The level of significance used was p < 0.05, and the figures were labeled according to the value of p (*p < 0.05; **p < 0.01; ***p < 0.001). The time window used for the exponential fits was always at least 5 times longer than the slowest time constant (see Figs. 7 and 8, 8 s for the slowest time constant), but in many figures the records presented have been expanded to illustrate the details of the early part of the responses, and the late part of the record is not shown. Data are expressed as mean ± SEM (see Results).
Figure 8.

EPSCs of PRiMA−/− mice. A, EPSCs in PRiMA−/− mice. A1, 1p-EPSCs and 5p-EPSCs are superimposed. The traces are averages of 10 records. A2, Bar graphs quantifying the decay of the 1p- and 5p-EPSCs in PRiMA−/− mice. The decay was characterized with only two time constants. The values of these time constants were very close to those calculated for the neostigmine data when combining τ1 and τ2 into a single weighted time constant τw. Similar to the cells from WT animals, the weighted time constant of the decay increased from τw(1p) = 21.8 ± 3.0 ms to τw (5p) = 71.9 ± 17.8 ms (n = 7, p = 0.02). The decay time constant of the ultra-slow component τslow was not changed between (1p) and (5p) (τslow(1p) = 1130 ± 245 ms, τslow(5p) = 1576 ± 125 ms, p = 0.06, n = 7). B, Addition of AChE in PRiMA−/− mice. B1, Average sweeps showing the 5p-EPSCs in PRiMA−/− mice before (Control) and after the application of AChE. The ultra-slow component was completely suppressed. B2, In the presence of AChE, the time constants of the two-component decay of the residual current are similar to those of the WT mice treated with AChE (AChE-PRiMA−/−:τ1 = 14.7 ± 1.8 ms:τ2 = 93.4 ± 17.8 ms, n = 5; AChE-WT:τ1 = 15.3 ± 0.7 ms:τ2 = 101.6 ± 6.9 ms, n = 9). The weighted time constants are not significantly different (AChE-PRiMA−/−: τw = 27.9 ± 4.7 ms, n = 5; AChE-WT: τw = 36.6 ± 2.9 ms, n = 9; p = 0.12 unpaired t test).
Analysis of spontaneous and mEPSCs.
The frequency of the spontaneous events occurring in control conditions (spontaneous EPSCs [sEPSC]) was usually very low (on the order of one a minute) at the beginning of the experiment but increased after a few hours. The sEPSCs and mEPSCs were analyzed with Neuromatic (Thinkrandom.com). In all experiments in which we wanted to evaluate the mean amplitude of the events (see Figs. 3, 6), and had to avoid a significant error due to the missed events, we set the detection threshold at −5 pA. For the analysis of rise and decay times of the events the usual detection threshold of −5 pA was eventually raised up to −10 pA in the experiments in which the background noise was substantial, as was the case under neostigmine and in PRiMA−/− mice.
Figure 3.
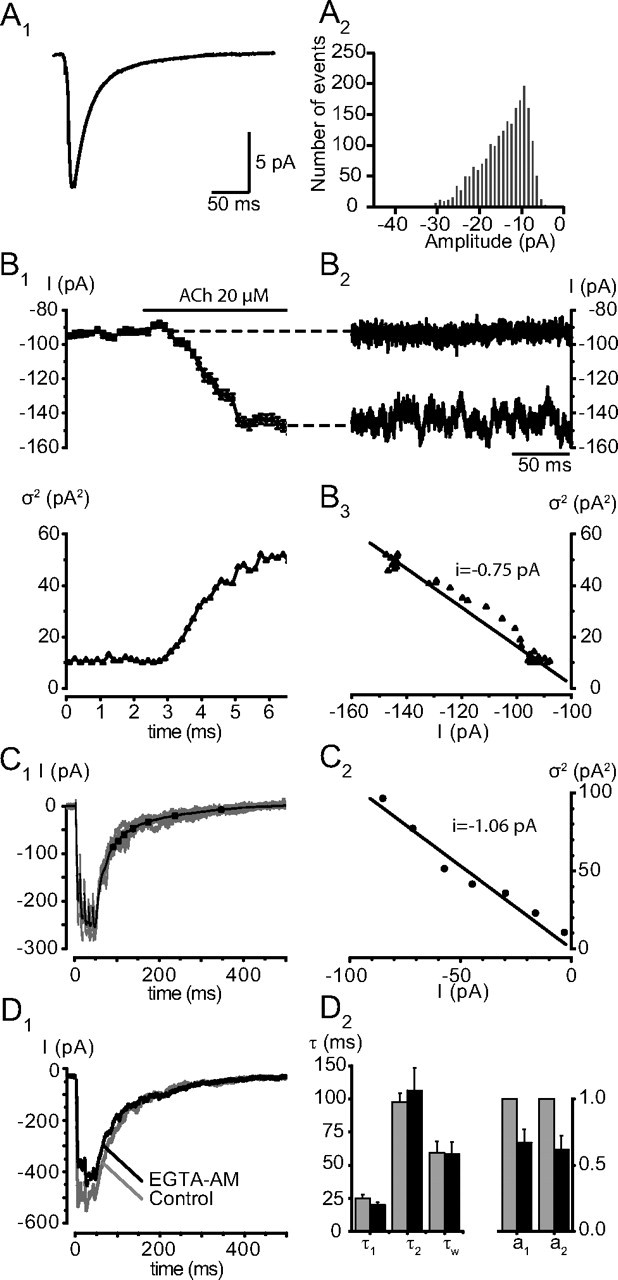
The slow component is not due to delayed release. A, Elementary fast decaying mEPSCs. A1, Averages of 2151 mEPSCs recorded after addition of TTX (500 nm). The amplitude of the average was −11.2 pA. The mean value for 5 experiments was −14.4 ± 2.1 pA. The decay of the mEPSCs was fit with a single exponential having a time constant of 14.1 ms. The mean value for 5 experiments was 13.0 ± 1.1 ms. The 20–80% rise time was 1.7 ms (mean value 1.5 ± 0.2 ms) A2, Distribution of the amplitudes of the mEPSCs. The threshold amplitude used to detect the events was set at −5 pA. B, Noise analysis of the current induced by an application of ACh (20 μm). B1, Top, Mean holding current (each dot corresponds to the mean value over an interval of 200 ms). Bottom, Variance of the current illustrated in the upper left, calculated for each 200 ms sample. B2, B3, Two records of 200 ms long of the holding current before ACh application (B2) and during the maximal effect of ACh (B3) illustrate the increase in noise. In this cell, the variance over current relation has a slope of − 0.75 pA, the mean value for this estimation of the unitary cholinergic current was −1.0 ± 0.1 pA (n = 4). C, Variance to mean ratio of the tail of eEPSCs. C1, Superimposed records of 5 EPSCs evoked by a 5-p train and average current of 59 records. The variance to mean analysis was performed only on the segment of the record starting 100 ms after the peak of the response to avoid a significant contribution of the fast component of the decay. The decay of the average synaptic current was subdivided into 7 steps of variable duration corresponding to a decrease of 5% of the maximal current amplitude (see Materials and Methods). The steps are marked by the dots on the segment. C2, Plot of the variance measured for the 7 segments over the average current during this segment. The leak current had been subtracted from the records. In this cell, the variance over current relation has a slope of − 1.06 pA. The average value of the elementary current measured during the decay of the 5p EPSCs was −1.1 ± 0.1 pA (n = 5). D, EGTA-AM reduces synaptic release but does not affect the decay of the synaptic current. EGTA-AM was applied at a concentration of 100 μm and produced a progressive decrease of the EPSCs. The decrease affected both components of the decay similarly. D1, Single 5p-EPSCs recorded before and 26 min after the application of EGTA-AM. D2, Bar graphs illustrating the mean changes of the EPSCs after 40 min in EGTA-AM. Amplitudes and time constants of decay were measured on averages from 10 records. The amplitudes of both components of the decay (normalized to the value before EGTA-AM) decreased, but there was no significant change in the time constants of the decay: control τ1(5p) = 24.7 ± 3.1 ms, τ2(5p) = 97.3 ± 7.0 ms, τw(5p) = 59.4 ± 8.6 ms; EGTA τ1(5p) = 20.2 ± 2.1 ms, EGTA τ2(5p) = 106.3 ± 17.1 ms; EGTA τw(5p) = 58.2 ± 9.3 ms (n = 3). The amplitudes a1 and a2 were reduced in EGTA to 67.1 ± 0.1 and 61.8 ± 0.1% of their original values.
Figure 6.

EPSCs evoked by minimal stimulation. The eEPSCs induced by a “minimal stimulation”—analyzed at −60 and 0 mV—are presented for 5 different cells. A–C, Illustrate the difference between the decay of the eEPSCs and that of sEPSCs in three different cases. D, E, Illustrate the effects of MFA (50 μm). A, Mixed eEPSCs. At −60 mV the eEPSC alternated between small responses with a slow rise and a slow decay (in 24/85 cases), or responses with a fast rise and a biphasic decay (in 61/85 cases). At 0 mV, all eEPSCs had a slow decay. All sEPSCs (132) had a fast decay. B, Slow eEPSCs. The eEPSCs (left column) had a slow rise and a slow decay both at −60 and at 0 mV. Their amplitude was nearly identical at −60 and at 0 mV, suggesting that they were originating in a neighboring coupled RC. In contrast, the sEPSCs recorded at −60 mV (right) had a fast decay. C, Fast eEPSCs. At −60 mV the decay of the eEPSCs (left) and of the sEPSCs (right) were both fast. The eEPSC at 0 mV was very small, suggesting that there was no significant contribution from neighboring RCs. D, E, At −60 mV the eEPSCs had a biphasic decay. At 0 mV the response showed only a slow component (D) or a spikelet (E). MFA (1 h in D, 2 h in E) eliminated the responses at 0mV, and accelerated the decay of the responses observed at −60 mV. All traces are averages (10–61 events for eEPSCs, and of 72–132 events for sEPSCs). No sEPSC was detected at 0 mV (data not shown).
Nonstationary fluctuation analysis.
To compare the variance/mean ratio of the synaptic current with that of the current induced by an application of ACh, we analyzed the fluctuations of the current during the decay of N successive EPSCs elicited by 5 pulse trains. The analysis was limited to the 300 ms segment starting 100 ms after the last stimulus of the train. This segment was subdivided in shorter segments of variable duration, each corresponding to an interval during which the current amplitude decreased by 5%. For each of these segments, we assumed quasistationary conditions and a low probability of opening and thus could compute the elementary current as i = σ2/I where I is the average current (I) from the N successive records and σ2 the variance of the current. As shown by Heinemann and Conti (1992), it is slightly more accurate to calculate σ2 from overlapping difference records than from independent records. Thus to evaluate σ2 we calculated the variance δ2for each of the (N − 1) pairs of successive records, and the average value of these differences, E[δ2]. Since the variance of the difference records is the sum of the variances of each record, E[δ2] = 2σ2.
Results
The decay of EPSCs is biphasic and slower at the end of a 5 pulse train than after a single pulse
Spillover is suspected when an increase of transmitter release prolongs the decay of a synaptic current. Among the various methods used to increase transmitter release, trains of action potentials have the advantage of mimicking a plausible physiological situation (Scanziani, 2000). We thus compared the decays of EPSCs evoked by either a single pulse or a train. The frequency of the train was chosen as 100 Hz to maximize spillover while remaining in the range which, in mice, appears as the operating range maximizing contraction strength (Manuel and Heckman, 2011).
Fitting the decays required two exponentials with time constants τ1 and τ2 and amplitudes a1 and a2. We measured these four values and then calculated the weighted time constant τw for both the decay of the response to 1p (τ1(1p), τ2 (1p), a1 (1p), a2 (1p), τw (1p)), and the decay of the response after the fifth pulse of the train (τ1(5p), τ2 (5p), a1 (5p), a2 (5p), τw(5p)). Figure 1A illustrates that the weighted time constant τw increased during a train, from τw (1p) = 33.5 ± 1.9 ms to τw (5p) = 71.9 ± 6.6 ms (n = 23).
Figure 1.
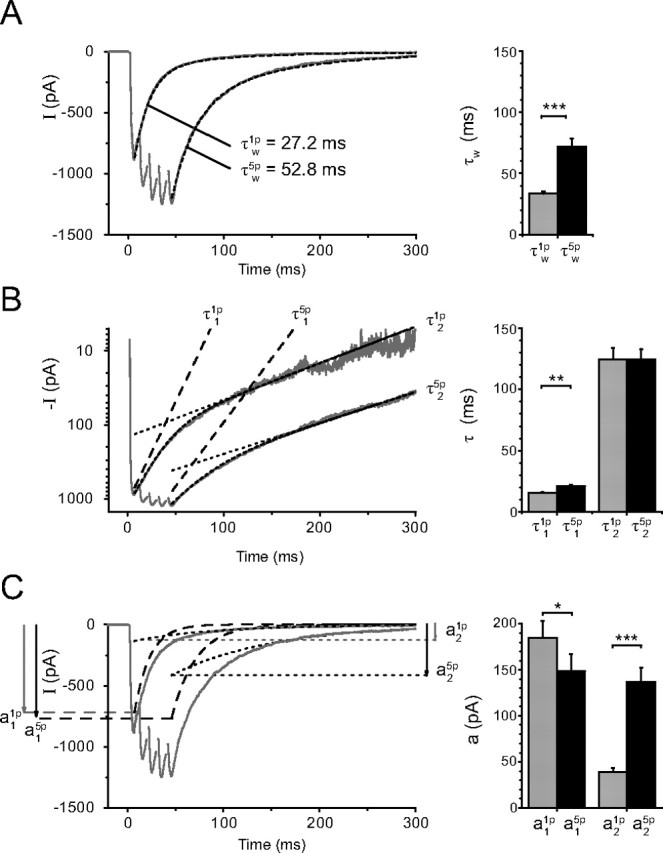
Comparison of the EPSCs evoked by a single stimulation (1p-EPSCs) and by a train of five stimulations at 100 Hz (5p-EPSCs). A, The weighted time constants describing the decay, noted τw(1p) and τw(5p), were obtained from a dual exponential fit with time constants τ1 and τ2 and amplitudes a1 and a2 (see Materials and Methods). Left, The weighted time constant was τw(1p) = 27.2 ms for the 1p-EPSC, and τw(5p) = 52.8 ms for the 5p-EPSC. The mean values were τw (1p) = 33.5 ± 1.9 ms and τw (5p) = 71.9 ± 6.6 ms (n = 23). The dual exponential fit is superimposed on the experimental records. B, The two time constants τ1 and τ2 are analyzed separately. Left, Logarithmic ordinate. The lines fitting the slow decay of the 5p-EPSCs are nearly parallel to those describing the slow decay of the 1p-EPSCs. Right, Results from 23 cells. τ2 was not significantly changed (τ2(1p) = 124.8 ± 9.0 ms; τ2(5p) = 124.7 ± 8.4 ms, p = 0.99). τ1 increased slightly (from τ1(1p) = 15.6 ± 0.8 ms to τ1(5p) = 20.8 ± 1.5 ms, p < 0.01). C, Evolution of a1 and a2 during a train. Left, The averaged EPSCs are superimposed on the theoretical lines (dotted lines) corresponding to the two exponentials used to fit the decay of the responses. <a1,τ1>, dashed lines; <a2,τ2>, dotted lines. In this experiment a1(1p) was slightly smaller than a1(5p), whereas a2(5p) was three times larger than a2(1p). Right, On average a1(1p) was slightly larger than a1(5p) (a1(1p) = 184.8 ± 18.4 pA; a1(5p) = 148.8 ± 18.0 pA, n = 23, p = 0.01) whereas a2(5p) was much larger than a2(1p) (a2(1p) = 38.9 ± 4.3 pA; a2(5p) = 136.9 ± 15.1 pA, n = 23, p < 0.001). A–C, The traces on the left correspond to the average of 10 sweeps, whereas the bar graphs on the right correspond to the data from 23 experiments. The statistical significance of the data in the bar graphs is coded by symbols according to the value of p (*p < 0.05; **p < 0.01; ***p < 0.001).
The comparison of the time constants and the amplitude for 1p and 5p revealed that there was an increase of τ1 (from τ1(1p) = 15.6 ± 0.8 ms to τ1(5p) = 20.8 ± 1.5 ms, p = 0.005) but no detectable change of τ2 (τ2(1p) = 124.8 ± 9.0 ms; τ2(5p) = 124.7 ± 8.4 ms; p = 0.99, n = 23) (Fig. 1B). a1(1p) was slightly larger than a1(5p) (a1(1p) = −184.8 ± 18.4 pA; a1(5p) = −148.8 ± 18.0 pA; n = 23, p = 0.01), whereas a2(5p) was much larger than a2(1p) (a2 (1p) = −38.9 ± 4.3 pA; a2 (5p) = −136.9 ± 15.1 pA) (Fig. 1C).
The effects of a train can thus be described by assuming that the EPSC is composed of a fast component <a1,τ1> and a slow component <a2,τ2>. The overall slowing of the decay after a train is not due to a change in the decay time constants but to an increase of the amplitude of the slow component.
The fact that during a train a1 remains nearly constant suggests that the receptors mediating the fast response are already saturated at the first pulse. On the other hand, one explanation of the buildup of the slow component is that it reflects spillover of ACh to unsaturated receptors.
The effects of added AChE
One of the most direct ways to evaluate the presence of spillover is to use a scavenger of the transmitter. This approach was first introduced in the study of glutamate receptors, where glutamate pyruvate transaminase helped to demonstrate the existence of extrasynaptic NMDA receptors (Rossi et al., 2002). More recently, AChE was used at the neuromuscular junction to detect a spillover toward the presynaptic terminal (Parnas et al., 2005). We followed this approach and examined the effect of added exogenous AChE on the EPSCs evoked by repetitive stimulations. Exposure to AChE for 5–10 min accelerated the EPSCs decay (Fig. 2). This acceleration resulted primarily from a very marked decrease of a2 (a2(CTL) = −167.7 ± 54.6 pA; a2(AChE) = −71.2 ± 18.7 pA; p = 0.03; N = 9). Although a1 was slightly reduced, the ratio a1/a2 increased from 1.8 ± 0.2 to 3.4 ± 0.5 (p = 0.02). The two time constants of the decay of 5p-EPSCs were not affected. No significant reversibility was observed during 30 min after washing out AChE. The selective depression by AChE of the amplitude of the slow component strongly suggests that during a repetitive stimulation some ACh escapes the hydrolysis by the endogenous AChE.
Figure 2.
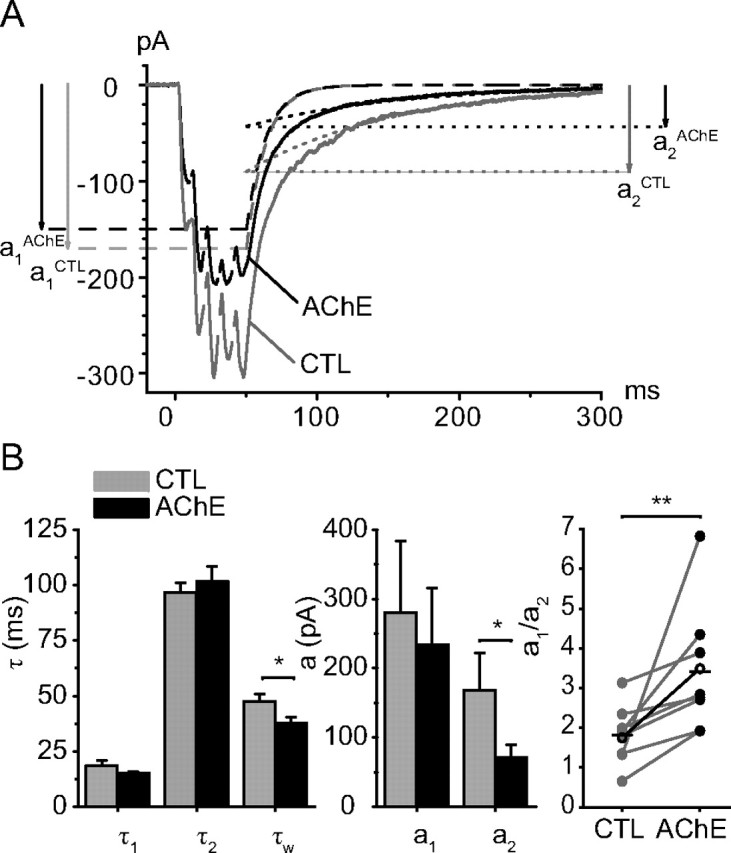
Exogenous AChE selectively reduces the slow component of the EPSCs. A, Average of 10 responses to a 5p-train in control conditions (CTL) and 7 min after addition of AChE (20–40 mg/L). The amplitude of the response decreased and its decay was shortened. Decomposing the decay into two components indicated that the <a1,τ1> component was hardly changed (a1(CTL) = −170 pA, a1(AChE)= −150 pA, τ1(CTL) = 13.3 ms, τ1(AChE) = 13.6 ms) and that τ2 is also little affected (τ2(CTL) = 106 ms, τ2(AChE) = 106 ms). The main effect of AChE is the reduction of the amplitude of a2 from a2(CTL) = −92 pA to a2(AChE) = −43 pA. The experiment illustrated was conducted at 26°C. B, The bar graphs indicate that AChE did not change the time constants of decay of the fast component (τ1(CTL) = 18.5 ± 2.5 ms and τ1(AChE) = 15.3 ± 0.7 ms, n = 9; p = 0.23) and did not change the decay of the slow component (τ2(CTL) = 96.7 ± 4.3 ms and τ2(AChE) = 101.6 ± 6.9 ms, n = 9; p = 0.33). AChE reduced the amplitude of the slow component from a2(CTL)= −167.7 ± 54.6 pA to a2(AChE) = −71.2 ± 18.7 pA (n = 9; p = 0.03) much more than that of the fast component (a1(CTL)= −280 ± 104 pA and a1(AChE)= −234 ± 81 pA, n = 9; p = 0.09). As a result the value of a1/a2 increased from 1.8 ± 0.2 to 3.4 ± 0.5 (p = 0.02) and the decay was shortened (τw(CTL) = 47.4 ± 3.4 ms and τw(AChE) = 36.6 ± 2.9 ms, n = 9; p = 0.02).
We noted, however, that exogenous AChE never completely eliminated the slow component of the EPSCs, which suggested that a fraction of the slow component could have an origin other than spillover. We therefore proceeded to test three mechanisms that, in other systems, have been found to also produce slow EPSCs.
Delayed release does not explain the slow decay of the EPSCs
The first alternate mechanism underlying the slow component that we examined was prolonged release of quanta following a 5p-train. One way to identify whether delayed release underlies the slow component is to show that the variance/mean ratio of the EPSCs decay following the 5p-train is similar to the size of quantal events (Hefft and Jonas, 2005). In contrast, if the slow decay reflects slow dissociation of ACh from the synaptic receptors, repetitive activation of receptors, or slow diffusion of ACh, the variance/mean ratio of the EPSC decay will be close to the elementary current associated with the opening and closing of ACh receptors. We therefore evaluated the amplitude of the mEPSCs and the variance/mean ratios of both the current induced by application of ACh and of the tail of the eEPSCs.
The mEPSCs were analyzed after the addition of tetrodotoxin (TTX; 500 nm) in five cells (Fig. 3A). Their mean amplitude was −14.4 ± 2.1 pA. The rise time τp was 1.5 ± 0.2 ms and the decay was well fitted with a single exponential whose time constant was 13.0 ± 1.1 ms.
To evaluate the elementary current flowing through ACh-activated channels, ACh was applied at 20 μm (the concentration at the receptors was certainly much lower given the presence of functional AChE). The average current induced by this application (at −60 mV) was −29.3 ± 9.8 pA (n = 4). The variance/mean ratio gave an elementary current i = −1.0 ± 0.1 pA (Fig. 3B).
The variance/mean ratio during the late decay of the responses to 5p-trains was −1.1 ± 0.1 pA (n = 6) (Fig. 3C). This value is close to the value of the elementary current found in the analysis of the ACh-induced current, and much lower than the average amplitude of mEPSCs and sEPSCs. This strongly suggests that delayed EPSCs similar to the sEPSCs or mEPSCs contribute little to the slow decay of the EPSC.
Another method to examine if delayed release underlies the slow component is to use EGTA-AM, which reduces delayed release, but usually preserves phasic release (Hefft and Jonas, 2005). EGTA-AM (100 μm) reduced EPSC amplitude, but the effect was slow and similar for the fast and the slow components. Figure 3D1 illustrates records taken in control and 20 min after the addition of EGTA-AM. The bar graphs of Figure 3D2 show that after 40 min a1(5p) and a2(5p) were reduced, respectively, to 67 and 62% of their initial values, but again there was no change in the kinetics of the decay. These results give additional support to the claim that delayed release contributes little to the tail of EPSCs.
I–V relations of the nicotinic EPSCs
We examined the EPSCs at different potentials. From our previous analysis of 1p-EPSCs (Lamotte d'Incamps and Ascher, 2008), we expected that the 5p-responses would show the inward rectification typically associated with central nAChRs (Haghighi and Cooper, 1998). This was indeed observed in most cells, but we also discovered in some cells an unexpected behavior: the EPSC was null at 0 mV, but a slow outward current, which we called <a0,τ0> was observed at positive potentials (Fig. 4A). This current was always very small for a 1p-EPSC but could become quite marked for the response to a train, particularly when we increased the intensity of the VR stimulation. Its decay was well fit by a single exponential with a time constant τ0 of 150.0 ± 21.1 ms, similar to that describing the decay of <a2,τ2> at −60 mV (123.0 ± 15.3 ms, p = 0.25, n = 5). The amplitude of a0 increased with depolarization and this I–V relation seemed to prolong the I–V relation of a2 (Fig. 4B), which could indicate the activation of a nonrectifying nicotinic receptor channel.
Figure 4.

NMDA receptors contribute current despite the presence of d-APV. Spermine (100 μm) was present in the recording electrode, and d-APV (50 μm), NBQX (2 μm), SR 95531 (3 μm), and strychnine (1 μm) were added to the extracellular solution. A, 1p- and 5p-EPSCs recorded at −60 and +45 mV. The EPSCs recorded at −60 mV have a two-component decay, whereas the decay of the EPSCs recorded at +45 mV is well described by a single time constant, the value of which is comparable to that of the <a2,τ2> component. B, Voltage dependence of the 5p-EPSCs. Left, Voltage dependence of the amplitude of the 5p-EPSCs. The amplitude of the responses recorded at negative potentials was analyzed by separating the two components a1 and a2 and normalizing their amplitude (100% at −30 mV). The two components have a similar behavior. The amplitude of the peak 5p-EPSC at positive potentials (a0) was normalized on the same scale as a2. It increases nearly linearly with V, and its I–V relation seems to extend the I–V relation of a2. Right, Voltage dependence of the decay of the three components a1, a2, and a0. None shows a significant voltage dependence. The time constants of decay for a2 and a0 are comparable. C, 5p-EPSCs at −60 and +45 mV in control conditions and after addition of DHβE (3 μm). D, 5p-EPSCs at −60 and +45 mV in control conditions and after addition of DCKA (50 μm).
That the outward current was not a nicotinic current became apparent when we analyzed the effects of dihydro-β-erythroidine (DHβE). This classical antagonist of heteromeric nAChRs dramatically reduced the inward currents but had no significant effect on the outward ones (Fig. 4C). We then considered that the slow outward current could be mediated by NMDA receptors despite the presence of d-APV (50 μm). That NMDA receptors can be activated in the presence of d-APV has been considered before in situations in which the prolonged presence of glutamate progressively displaced the (low-affinity) antagonist d-APV (Wyllie and Chen, 2007). One simple way of testing this hypothesis, proposed by Lowe (2003), is to block the NMDA receptors with a noncompetitive antagonist such as the glycine site antagonist DCKA. Indeed, this compound eliminated the outward current observed at positive potentials (Fig. 4D). DCKA did not interfere significantly with the inward currents recorded at −60 mV, which indicates that the NMDA component does not contribute significantly to the EPSCs recorded at that potential.
Another anomaly of the I–V relation was the observation that in some cells the EPSC remained inward at 0 mV and often at more positive potentials. This observation was explained when we discovered the presence of electrical coupling between RCs.
Electrical coupling between RCs
We next examined if electrical filtering could contribute to the slow component of the EPSC. We first considered the possibility of electrical filtering by dendrites: synaptic currents recorded at the soma but arising in distant dendrites are slowed by the cable properties of the dendrites. This mechanism did not appear at first likely to produce a slowing from 15 to 125 ms, because the cholinergic synaptic boutons are mostly on proximal dendrites and do not show the bimodal distribution which would be required to explain the sharp difference between fast and slow components (Alvarez et al., 1999). Nevertheless we examined the behavior of the EPSCs using voltage jumps (Pearce, 1993). We compared the records obtained at our usual holding potential (−60 mV) with those obtained when the cell was held at 0 mV (the reversal potential of EPSCs) during the stimulus then jumped to −60 mV 100 ms after the last stimulus. The traces obtained at −60 mV with and without the jump were superimposed after the end of the capacitive transient (data not shown), indicating that dendritic filtering was not a prominent cause of the slow decay of the EPSCs. However, in many cells the current did not reverse at 0 mV and at that potential we often detected either spikelets or a slow inward current or both class of events. This led us to examine the possibility of electrical coupling between RCs.
In our preparations the presence of electrical coupling between RCs was first revealed by the occasional presence in the EPSCs of brief inward currents, which were sometimes but not always followed by slower outward currents and looked like filtered action potentials (spikelets). These events were most easily identified on the decaying part of the EPSCs, but they were also present at the peak of the EPSCs. Examples of these events are illustrated in Figure 5. We interpret these events as spikelets because they persisted when the cell was depolarized to 0 mV, at which potential their discharge pattern resembled that of the action potential train recorded in RCs in the cell-attached configuration (Lamotte d'Incamps and Ascher, 2008). The fact that most spikelets were time linked to the stimulus and not to the steady depolarization of the cell suggested that they reflect the electrical transmission of action potentials emitted in neighboring RCs, rather than ectopic dendritic or axon spikes. The fact that their frequency was only slightly affected by the depolarization of the clamped RC to 0 mV indicates that the coupling is relatively weak. To confirm that the spikelets originated in neighboring cells we applied muscimol which is expected to inhibit the firing of all the RCs (except the one under voltage-clamp, provided the voltage-clamp effectively controls the distant dendrites) (Szapiro and Barbour, 2007). Muscimol suppressed the spikelets, and the effect could be reversed by gabazine (Fig. 5A).
Figure 5.
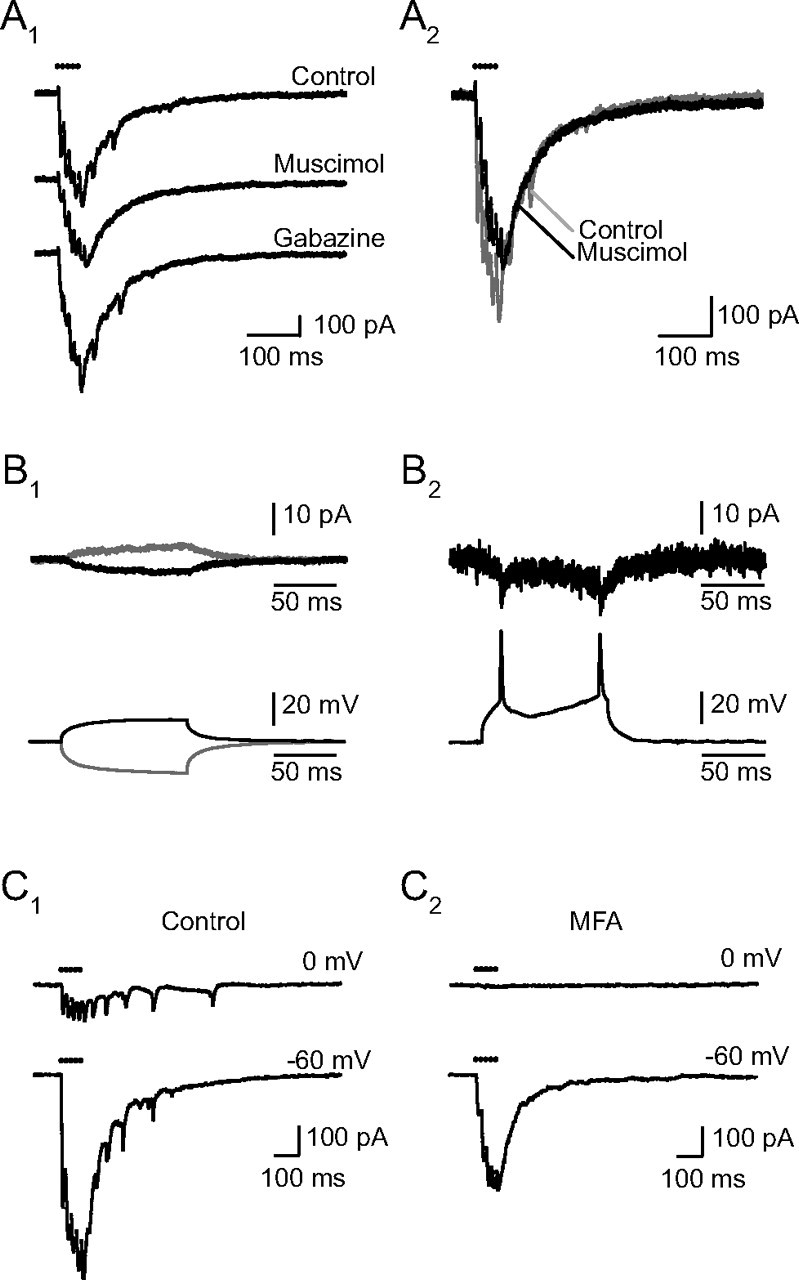
Electrical coupling between RCs. A, Muscimol eliminates the spikelets. A1, Muscimol (5 μm) suppressed both the initial and the late spikelets, reducing the peaks of the successive responses without altering the kinetics of the slow decay of the EPSCs. The nominal concentration of muscimol was 5 μm, but the records shown were taken just after the beginning of the perfusion, at which time the true concentration was certainly lower. Later the slow current also decreased as expected from a shunting of the coupled RC (data not shown). Washing muscimol and introducing gabazine (3 μm) led to the reappearance of the spikelets. A2, The superimposed traces before and after muscimol indicate that in its initial effect muscimol suppresses the spikelets but does not alter the decay of the eEPSC. B, Electrical coupling between RCs (identified by a response to the VR stimulation, data not shown). Two RCs were recorded simultaneously, one (Cs-RC) in voltage-clamp mode with a Cs-based internal solution containing QX314 (top recordings, Vhold = −60 mV) and the other (K-RC) in the current-clamp mode, with a K-based internal solution to allow the firing of action potentials (a DC current was injected to maintain the cell ∼−60 mV). B1, Pulses of current of various amplitudes were injected in the second RC and elicited an attenuated current in the first. In the two traces shown, 30 consecutive trials were averaged. The depolarizing pulse had an amplitude of 100 pA and induced a depolarization in the cell of +13.2 mV, the hyperpolarizing pulse's amplitude was −150 pA and induced a hyperpolarization of the cell of −19.2 mV. The depolarizing pulses induced an inward current in the first cell of −3.5 pA while the hyperpolarizing pulses induced an outward current of +4.4 pA. The electrical coupling can thus be estimated to 3.8 GΩ in the first trials, and to 4.4 GΩ in the case of hyperpolarizing pulses. B2, Supraliminar depolarizing current pulses injected in the K- RC and the corresponding spikelets recorded in the Cs-RC (single traces, no averaging). The spikelets are superimposed on the slow electrotonic response. C, MFA (50 μm) eliminates the spikelets and the inward current due to coupling (C1). In control conditions electrical coupling between the RC recorded from and neighboring RCs excited by the same presynaptic stimulation was revealed both by the presence of spikelets at −60 and at 0 mV and by the presence of a slow inward current at 0 mV. The spikelets recorded in this cell were exceptionally large. C2, After 75 min in MFA (50 μm), the spikelets had disappeared at both potentials. No synaptic current was observed at 0 mV. The response at −60 mV was reduced by half. The time constants of the two components of the decay were not changed, but the ratio of the fast over the slow component increased from 2.0 to 3.1. All records are single traces.
The direct demonstration that RCs are electrically coupled was obtained in paired recordings in which we recorded from neighboring RCs, changed the membrane potential in one cell (RC-K, followed in the current-clamp mode with a K-filled electrode) and recorded a current change in the other (RC-Cs, recorded in voltage-clamp with a Cs internal solution). In three pairs of cells the coupling conductance was 5.0 ± 2.9 GΩ. The time constants of the potential changes in RC-K which did not elicit a spike were similar to the time constants of the currents recorded in the RC-Cs. On the other hand, when an action potential was evoked in the RC-K cell it was strongly filtered and evoked a small spikelet (two cells) or no spikelet at all (one cell) in the RC-Cs cell. This confirms that the RC cells are coupled and that the electrical junctions act as low-pass filters.
The presence of electrical coupling explained the voltage dependence of EPSCs in cells showing spikelets. In cells which did not show spikelets on the synaptic currents, the EPSCs disappeared when the cell was depolarized to 0 mV (Fig. 4). In contrast in those cells which showed spikelets on the response at −60 mV, the spikelets were also visible at 0 mV and in most cases were superimposed on a slow inward current (Fig. 5C1). This is well explained if part of the inward current recorded in a given cell at −60 mV arises from neighboring cells. When the cell recorded from is depolarized, neighboring coupled cells are likely to be also depolarized, but always less strongly. Thus when the patched cell is at 0 mV the neighboring cells will still contribute an inward current. Muscimol eliminated the spikelets but did not eliminate the slow coupling current at 0 mV (Fig. 5A). To eliminate the coupling we used MFA (Pan et al., 2007). When applied at 50 μm for at least 45 min, MFA suppressed the spikelets at all potentials and suppressed the inward current recorded at 0 mV, confirming that electrical coupling was responsible for both events (Fig. 5C). MFA also reduced the EPSCs recorded at −60 mV. This reduction was partly due to presynaptic effects evidenced by the frequent abrupt failure of the responses to presynaptic stimulation. However, in the residual EPSCs the slow component was always more reduced than the fast one. On average in 25 experiments the time constants of the decay of the 5p-EPSCs did not change significantly (τ1 went from 23.5 ± 1.7 to 21.1 ± 1.3 ms, p = 0.19; τ2 from 108.8 ± 6.6 to 117.9 ± 6.5 ms, p = 0.26), but the ratio a1/a2 increased from 1.5 ± 0.1 to 2.7 ± 0.2 (p < 0.001).
EPSCs evoked by minimal stimulation
We analyzed the EPSCs evoked by minimal stimulation with the hope of exciting only one presynaptic axon. We found that in a number of cases we could evoke responses having a size comparable to that of mEPSCs (Fig. 3), which suggested that we were stimulating an axon making a small number of contacts on the recorded RC. However, surprisingly, these small eEPSCs often had a kinetics of decay much slower than that of mEPSCs. To perform a more systematic analysis of these eEPSCs we compared them to mEPSCs and to sEPSCs. The spontaneous events were observed in the absence of TTX.
sEPSCs, measured in a series of 10 cells, had a mean amplitude of −10.9 ± 0.7 pA, a rise time of 2.1 ± 0.2 ms, and a decay time of 14.1 ± 0.9 ms. All three values are close to the corresponding values of the mEPSCs (Fig. 3).
We then made, in each cell, a comparison of sEPSCs and eEPSCs evoked by minimal stimulation and found that the decay of the eEPSCs often showed a slow component which was never observed with sEPSCs or mEPSCs. This is illustrated in Figure 6, which shows examples of the three types of responses observed at threshold. In the case of Figure 6A, at −60 mV the responses to a series of 85 stimulations alternated between what we called “mixed eEPSCs” and “slow eEPSCs.” The 61 mixed eEPSCs were characterized by a fast rise time and a biphasic decay, whereas the 24 slow eEPSCs were characterized by a slow rise and a monophasic slow decay. At 0 mV all of the eEPSCs had a slow rise and a monophasic slow decay. In the cell of Figure 6B all eEPSCs were slow, both at −60 and at 0 mV, whereas in the case of Figure 6C the eEPSCs were all fast (had a fast rise and a fast decay) and were not detected at 0 mV. The mean values of the kinetic parameters were characterized in 7 mixed eEPSCs and in 11 slow eEPSCs. At −60 mV the mean values of the two time constants of decay for the mixed eEPSCs were τ1 = 11.0 ± 1.2 and τ2 = 98.1 ± 13.1 ms; the mean value for the slow eEPSCs was τ = 132 ± 24 ms. At 0 mV all events were slow and decayed with a single time constant τ = 114 ± 17 ms for mixed eEPSCs and τ = 140 ± 24 ms for slow eEPSCs. The mean rise time at −60 mV was 2.1 ± 0.3 ms for the mixed eEPSCs, and 13.7 ± 1.7 ms for the slow EPSCs.
The three types of eEPSCs observed near threshold are best explained by assuming that one rarely observes fast eEPSCs, because one rarely excites an axon solely innervating the patched RC. In most cases one excites either axons innervating only neighboring RCs (slow eEPSCs) or axons innervating both the patched RC and coupled neighboring RCs (mixed eEPSCs).
Support for this interpretation was provided by the comparison of the eEPSCs with the sEPSCs, and by the analysis of the effects of MFA. To analyze if the decay of sEPSCs could contain a slow component we used a window of 650 ms (longer than in the case of Fig. 3A). We found that in all cases the decay could be well fitted by a single exponential, and the mean value of the time constant of decay was 14.1 ± 0.9 ms (n = 10). The mean value of the rise time was 2.1 ± 0.2 ms. The effects of MFA are illustrated in Figure 6D,E for two mixed eEPSCs in which a response persisted at 0 mV, in the form of a slow inward current (Fig. 6D), and of a spikelet in the case of Figure 6E. MFA suppressed the responses recorded at 0 mV, leaving a fast decaying eEPSC at −60 mV.
It thus appears that the slow component of the eEPSCs evoked by minimal stimulation reflects depolarizations occurring in neighboring RCs and transmitted through the gap junctions.
Effects of neostigmine
The concept of spillover was introduced to explain why, at the neuromuscular junction, the AChE inhibitor neostigmine prolongs both the endplate currents and the miniature endplate currents (Katz and Miledi, 1973). In peripheral ganglionic synapses, neostigmine also prolongs EPSCs, but the effects on mEPSCs are less marked, suggesting that the detection of spillover depends upon the architecture of the synapses (Rang, 1981). When we applied neostigmine at the MN-RC synapse, we found that it greatly prolonged the EPSCs (Fig. 7A) but, in contrast to what had been described at the endplate, this prolongation resulted from the addition of an “ultra-slow” component rather than from the slowing of the pre-existing components. This was shown by the fact that the decay of the EPSCs under neostigmine could be well fit with three exponentials in which the first two resembled the control in size and kinetics (Fig. 7B). The time constant of decay of the ultra-slow component, τ3, had a mean value in the second range (τ3(1p) = 1741 ± 329 ms; τ3(5p) = 2188 ± 234 ms; n = 6). The difference between τ3(1p) and τ3(5p) was not significant (p = 0.12).
Neostigmine also induced a steady inward current (Fig. 7A). This inward current was blocked by the nicotinic antagonist DHβE at 10 μm (Fig. 7C). Its mean value was obtained either by measuring the inward current triggered by the application of neostigmine (ΔINEO) or the outward current produced by the application of DHβE in the presence of neostigmine (ΔIDHβE). The two measurements were not always done in the same cells. The values obtained were ΔINEO= −32.6 ± 4.1 pA (n = 19) and ΔIDHβE = 32.0 ± 5.0 pA (n = 14). A variance to mean analysis showed a linear relation between the current and its variance. The mean values of the elementary currents (Fig. 7D) (i(NEO) = −1.0 ± 0.1 pA, n = 10; i(DHβE) −1.0 ± 0.1 pA, n = 10) are similar to those found for the ACh-induced current (Fig. 3B). This strongly suggests that the steady current induced by neostigmine is due do the persistent presence of ACh.
The peaks of the 1p- and 5p-EPSCs progressively decreased in neostigmine. This decrease continued after the prolongation of the decay had reached a maximum (after a few minutes with 1 μm neostigmine, after ∼30 min with 0.1 μm neostigmine). This decrease may correspond to desensitization or internalization of heteromeric receptors by the continuous presence of ACh.
EPSCs in PRiMA−/− mice
Central cholinergic neurons are the main source of central AChE, and the enzyme is mostly found on the outer surface of axonal endings where it is anchored by the membrane protein PRiMA. In PRiMA−/− mice, AChE is prevented from reaching the neuronal surface, depriving the CNS of functional AChE, and yet PRiMA−/− mice show few behavioral differences with wild-type (WT) mice (Dobbertin et al., 2009). Thus, it was of interest to examine if the EPSCs of PRiMA−/− mice showed any sign of an adaptation.
The EPSCs recorded in PRiMA−/− mice were very similar to those recorded in WT in neostigmine (Fig. 8A). However, in a majority of cases (4/7) the decays were fitted adequately by two exponentials and since the decay of the slowest component was ultra-slow (in the s range), we assumed that it corresponded to τ3 and that the fastest time constant corresponded to the weighted time constant τw combining <a1,τ1> and <a2,τ2>. The values of τ3(1p) and τ3(5p) in PRiMA−/− mice were not significantly different from those measured in neostigmine in WT mice (τ3(1p) = 1130 ± 245 ms, τ3(5p) = 1537 ± 115 ms; p = 0.06, n = 7). A steady inward current blocked by the application of DHβE was also detected in PRiMA−/− mice. However, its mean value was 8.4 ± 2.1 pA (n = 7), significantly smaller (p = 0.0004, unpaired test) than the similar current recorded in the WT in neostigmine (ΔIDHβE = 32.0 ± 5.0 pA, n = 14).
AChE (10 μg/ml) rescued the PRiMA−/− phenotype: it completely eliminated the ultra-slow component in PRiMA−/− mice and the decay of the residual responses could be fit by two exponentials with time constants similar to those found in the WT (Fig. 8).
The decay of sEPSCs after AChE inhibition, which could not be analyzed in neostigmine due to the large noise of the steady current, was analyzed in PRiMA−/− mice because the steady inward current is much smaller. The time constant of decay of the sEPSCs was 11.0 ± 1.6 ms (n = 7), not significantly longer than the values found in the WT (Fig. 3, 12.7 ± 0.8 ms; Fig. 6, 14.1 ± 0.9 ms).
Discussion
Our analysis of the EPSC of the MN-RC synapse indicates the presence of two independent components which we have labeled <a1,τ1> and <a2,τ2>. During a train a1 changes little and τ1 and a2 increase while τ2 is unchanged. We will briefly discuss below the possible interpretations of these changes before considering the effects of AChE inactivation and the possible role of electrical coupling. We shall stress that all our observations have been made on neonates at P5–P10 and that we cannot at this point extend our conclusions to the adult MN-RC synapse.
The fast component of the EPSCs slows during a train
The fast component of the EPSCs resembles the synaptic currents described at the neuromuscular junction and in autonomic ganglia. The time constant of the fast component of the decay of the eEPSCs evoked by a single pulse, τ1(1p), is close to that describing the decays of mEPSCs and sEPSCs, which may represent the mean open time of the channel (Anderson and Stevens, 1973). The fast component slowed during a train: τ1(5p) was larger than τ1(1p). This slowing could not be analyzed in detail because the fast decay is superimposed on the rising phase of the slow component, but it resembles the prolongation of the endplate current for a double pulse observed by Magazanik et al. (1984) at the neuromuscular junction in conditions of high quantal content, and the slowing of the EPSC observed after increasing the quantal content in both the neuromuscular junction (Giniatullin et al., 1993) and the ciliary ganglion (Stanchev and Sargent, 2011). As discussed by Stanchev and Sargent (2011), these effects are well explained by nonlinear postsynaptic interactions in which ACh released from adjacent sites reaches overlapping areas of the postsynaptic surface (Hartzell et al., 1975). In this perspective it is interesting to note that at the MN-RC synapses of the rat, some synaptic cholinergic boutons show multiple active zones facing multiple synaptic densities (F. Alvarez, personal communication). However, as discussed by Stanchev and Sargent (2011), for the slowing of the α7 synaptic current by an increased quantal content in the ciliary ganglion, the slowing of the decay could also result from an increased concentration of ACh at a single site synapse. In both cases the slowing of <a1,τ1> during a train would be an indication of spillover.
The depression by AChE of the slow component induced by a repetitive stimulation strongly suggests a local spillover of ACh
The slow component of the eEPSC was substantially reduced by application of exogenous AChE. This is strong evidence that during a train, despite the exceptional catalytic power of AChE, an increasing fraction of the ACh released at the MN-RC synapse escapes hydrolysis.
One possible interpretation of the presence of two time constants in the decay of the EPSCS is that the receptors mediating the fast and the slow component are respectively synaptic and extrasynaptic and have different affinities for ACh. One of the first proposals for such an organization was made by Rang (1981) to explain that in the submandibular ganglion the decay of the nicotinic eEPSCs was slower than that of the mEPSCs. A similar hypothesis has been used to explain the fast and slow EPSCs mediated by ionotropic glutamate receptors (Jonas and Spruston, 1994) as well as the fast and slow GABA-A IPSCs in the cerebellar cortex (Rossi and Hamann, 1998). A particularly relevant analogy with the MN-RC synapse is provided by those glutamatergic synapses in which the NMDA component is not detected in unitary EPSCs and only appears after stimulation of a large number of presynaptic axons or after a repetitive stimulation (Chen and Diamond, 2002; Clark and Cull-Candy, 2002; Cathala et al., 2003). Extending this analogy to the MN-RC synapse would imply that the slow decay of the nicotinic EPSC reflects the slow dissociation of ACh from high-affinity nAChRs, which have indeed been identified in the CNS (Zwart and Vijverberg, 1998; Nelson et al., 2003).
In the absence of a direct characterization of such high-affinity nAChRs, we cannot exclude that the slow decay reflects a slow transmitter transient as suggested in many studies which used, as we did, “multi-axon” stimulations (Carter and Regehr, 2000; Arnth-Jensen et al., 2002; Balakrishnan et al., 2009) as well as some analyses of individual synapses (Capogna and Pearce, 2011). However, the relative invariance of the slow decay time constant does provide an argument that at least the time course of the slow component is determined by intrinsic receptor properties, although its amplitude is likely to reflect both the peak and duration of the transmitter concentration time course (which would be more rapid than the EPSC time course).
Intersynaptic spillover
The ultra-slow component of the EPSCs in neostigmine or in PRiMA−/− mice was expected from the early report that the RC response lasts several seconds in the presence of eserine (Eccles et al., 1954). Similar ultra-slow nicotinic responses were reported at the endplate and in autonomic ganglia (Katz and Miledi, 1975; Callister and Sah, 1997). In all of these cases one has to assume “intersynaptic diffusion of transmitter” (Barbour and Häusser, 1997): the transmitter released from an active zone reaches other synapses on the same cell and on neighboring cells, and it is the decay of the transmitter concentration, rather than the dissociation of ACh from its receptor, which controls the decay of the synaptic current.
The steady inward current induced by the inactivation of AChE by neostigmine resembles that observed at the endplate and attributed to a steady leakage of ACh from the nerve terminal (Katz and Miledi, 1977). The continued presence of ACh may induce either desensitization or internalization of the nAChRs, which could explain the progressive decrease of EPSCs in neostigmine. PRiMA−/− mice appear to have adapted to the continuous presence of ACh.
The sEPSCs were not prolonged by inactivation of AChE, in contrast with the prolongation observed at the endplate (Kordaš, 1972; Katz and Miledi, 1973). The difference probably results from a difference in the number of receptors, as discussed by Rang (1981), Wathey et al. (1979), and Bennett et al. (1997). At punctate synapses diffusion is likely to dominate rebinding (Barbour, 2001).
Electrotonic transmission of the depolarization of neighboring coupled RCs
The presence of electrical coupling was suggested by the observation of spikelets and by the “anomalous” voltage dependence of the eEPSCs, and was confirmed by paired recordings. The role of this coupling in shaping the eEPSCs was established by the effects of MFA, which suppressed all eEPSCs recorded at 0 mV, and selectively affected the slow component of the eEPSCs recorded at −60 mV. The components eliminated by MFA are interpreted as reflecting the depolarization of neighboring cells. They involve both <a1,τ1> and <a2,τ2> components, but the ratio of the two is shifted toward the slow component by the filtering introduced by the gap junctions.
The functional role of gap junctions has until now mostly been attributed to the fact that they can transmit action potentials. In most cases this transmission has been seen as excitatory, synchronizing coupled cells through filtered action potentials, but it has been recently pointed out that gap junctions could be inhibitory when their low-pass filter properties preferentially transmit the strong afterhyperpolarization (AHP) of some action potentials (Galarretta and Hestrin, 2001; Connors et al., 2010; Dugué et al., 2009). However, gap junctions can also transmit synaptic currents (Zsiros et al., 2007), and in the case of RCs the main charge transfer appears to come from the slow EPSC.
Can this transmission have a functional role? To explain that the discharge of the RC in response to a single pulse stimulation lasts up to 100 ms (Eccles et al., 1954) while the nAChR activation only lasts a few milliseconds, we have proposed an explanation in which the nicotinic current could “jump start” the NMDA current (Lamotte d'Incamps and Ascher, 2008). The difficulty of this interpretation is that if the AHP of the first postsynaptic action potential repolarizes the membrane and reintroduces the (rapid) Mg block of the NMDA current, then this will suppress the depolarization required to trigger the following action potential. However, in electrically coupled RCs, the coupling could be sufficiently low pass to prevent the transmission of the spike (avoiding the synchronization of the action potentials), but could neutralize the resetting of the Mg block by providing a continued depolarization, thus allowing repetitive firing. The mechanism that we propose could be involved in all electrically coupled neurons making use of the slow dissociation of glutamate from NMDA receptors to produce a long-lasting discharge.
Footnotes
This work was supported by the Association Française Contre les Myopathies and by a collaborative program from Université Paris Descartes. We thank Boris Barbour for introducing us to the arcana of spillover and for many decisive suggestions. We thank Pepe Alcami, Francisco Alvarez, Stéphane Dieudonné, Jacsue Kehoe, Alain Marty, Peter Sargent, and Brandon Stell for discussions. This paper is dedicated to our colleague and friend Jean Massoulié (1938–2011) who was a pioneer of the study of the molecular forms of acetylcholinesterase.
The authors declare no competing interests.
References
- Albuquerque EX, Pereira EF, Alkondon M, Rogers SW. Mammalian nicotinic acetylcholine receptors: from structure to function. Physiol Rev. 2009;89:73–120. doi: 10.1152/physrev.00015.2008. [DOI] [PMC free article] [PubMed] [Google Scholar]
- Alvarez FJ, Dewey DE, McMillin P, Fyffe RE. Distribution of cholinergic contacts on Renshaw cells in the rat spinal cord: a light microscopic study. J Physiol (Lond) 1999;515:787–797. doi: 10.1111/j.1469-7793.1999.787ab.x. [DOI] [PMC free article] [PubMed] [Google Scholar]
- Anderson CR, Stevens CF. Voltage clamp analysis of acetylcholine produced end-plate current fluctuations at frog neuromuscular junction. J Physiol (Lond) 1973;235:655–691. doi: 10.1113/jphysiol.1973.sp010410. [DOI] [PMC free article] [PubMed] [Google Scholar]
- Arnth-Jensen N, Jabaudon D, Scanziani M. Cooperation between independent hippocampal synapses is controlled by glutamate uptake. Nat Neurosci. 2002;5:325–331. doi: 10.1038/nn825. [DOI] [PubMed] [Google Scholar]
- Balakrishnan V, Kuo SP, Roberts PD, Trussell LO. Slow glycinergic transmission mediated by transmitter pooling. Nat Neurosci. 2009;12:286–294. doi: 10.1038/nn.2265. [DOI] [PMC free article] [PubMed] [Google Scholar]
- Barbour B. An evaluation of synapse independence. J Neurosci. 2001;21:7969–7984. doi: 10.1523/JNEUROSCI.21-20-07969.2001. [DOI] [PMC free article] [PubMed] [Google Scholar]
- Barbour B, Häusser M. Intersynaptic diffusion of neurotransmitter. Trends Neurosci. 1997;20:377–384. doi: 10.1016/s0166-2236(96)20050-5. [DOI] [PubMed] [Google Scholar]
- Bell KA, Shim H, Chen CK, McQuiston AR. Nicotinic excitatory postsynaptic potentials in hippocampal CA1 interneurons are predominantly mediated by nicotinic receptors that contain α4 and β2 subunits. Neuropharmacology. 2011;61:1379–1388. doi: 10.1016/j.neuropharm.2011.08.024. [DOI] [PMC free article] [PubMed] [Google Scholar]
- Bennett MR, Farnell L, Gibson WG, Lavidis NA. Synaptic transmission at visualized sympathetic boutons: stochastic interaction between acetylcholine and its receptors. Biophys J. 1997;72:1595–1606. doi: 10.1016/S0006-3495(97)78806-4. [DOI] [PMC free article] [PubMed] [Google Scholar]
- Bernard V, Girard E, Hrabovska A, Camp S, Taylor P, Plaud B, Krejci E. Distinct localization of collagen Q and PRiMA forms of acetylcholinesterase at the neuromuscular junction. Mol Cell Neurosci. 2011;46:272–281. doi: 10.1016/j.mcn.2010.09.010. [DOI] [PMC free article] [PubMed] [Google Scholar]
- Callister RJ, Sah P. The removal of acetylcholine by diffusion at nicotinic synapses in the rat otic ganglion. J Physiol (Lond) 1997;505:165–175. doi: 10.1111/j.1469-7793.1997.165bc.x. [DOI] [PMC free article] [PubMed] [Google Scholar]
- Capogna M, Pearce RA. GABAA, slow: causes and consequences. Trends Neurosci. 2011;34:101–112. doi: 10.1016/j.tins.2010.10.005. [DOI] [PubMed] [Google Scholar]
- Carter AG, Regehr WG. Prolonged synaptic currents and glutamate spillover at the parallel fiber to stellate cell synapse. J Neurosci. 2000;20:4423–4434. doi: 10.1523/JNEUROSCI.20-12-04423.2000. [DOI] [PMC free article] [PubMed] [Google Scholar]
- Cathala L, Brickley S, Cull-Candy S, Farrant M. Maturation of EPSCs and intrinsic membrane properties enhances precision at a cerebellar synapse. J Neurosci. 2003;23:6074–6085. doi: 10.1523/JNEUROSCI.23-14-06074.2003. [DOI] [PMC free article] [PubMed] [Google Scholar]
- Chen S, Diamond JS. Synaptically released glutamate activates extrasynaptic NMDA receptors on cells in the ganglion cell layer of rat retina. J Neurosci. 2002;22:2165–2173. doi: 10.1523/JNEUROSCI.22-06-02165.2002. [DOI] [PMC free article] [PubMed] [Google Scholar]
- Clark BA, Cull-Candy SG. Activity-dependent recruitment of extrasynaptic NMDA receptor activation at an AMPA receptor-only synapse. J Neurosci. 2002;22:4428–4436. doi: 10.1523/JNEUROSCI.22-11-04428.2002. [DOI] [PMC free article] [PubMed] [Google Scholar]
- Connors BW, Zolnik TA, Lee SC. Enhanced functions of electrical junctions. Neuron. 2010;67:354–356. doi: 10.1016/j.neuron.2010.07.024. [DOI] [PMC free article] [PubMed] [Google Scholar]
- Dani JA, Bertrand D. Nicotinic acetylcholine receptors and nicotinic cholinergic mechanisms of the central nervous system. Annu Rev Pharmacol Toxicol. 2007;47:699–729. doi: 10.1146/annurev.pharmtox.47.120505.105214. [DOI] [PubMed] [Google Scholar]
- Dobbertin A, Hrabovska A, Dembele K, Camp S, Taylor P, Krejci E, Bernard V. Targeting of acetylcholinesterase in neurons in vivo: a dual processing function for the proline-rich membrane anchor subunit and the attachment domain on the catalytic subunit. J Neurosci. 2009;29:4519–4530. doi: 10.1523/JNEUROSCI.3863-08.2009. [DOI] [PMC free article] [PubMed] [Google Scholar]
- Dourado M, Sargent PB. Properties of nicotinic receptors underlying Renshaw cell excitation by alpha-motor neurons in neonatal rat spinal cord. J Neurophysiol. 2002;87:3117–3125. doi: 10.1152/jn.2002.87.6.3117. [DOI] [PubMed] [Google Scholar]
- Dugué GP, Dumoulin A, Triller A, Dieudonné S. Target-dependent use of co-released inhibitory transmitters at central synapses. J Neurosci. 2005;25:6490–6498. doi: 10.1523/JNEUROSCI.1500-05.2005. [DOI] [PMC free article] [PubMed] [Google Scholar]
- Dugué GP, Brunel N, Hakim V, Schwartz E, Chat M, Lévesque M, Courtemanche R, Léna C, Dieudonné S. Electrical coupling mediates tunable low-frequency oscillations and resonance in the cerebellar Golgi cell network. Neuron. 2009;61:126–139. doi: 10.1016/j.neuron.2008.11.028. [DOI] [PubMed] [Google Scholar]
- Eccles JC, Fatt P, Koketsu K. Cholinergic and inhibitory synapses in a pathway from motor-axon collaterals to motoneurones. J Physiol (Lond) 1954;126:524–562. doi: 10.1113/jphysiol.1954.sp005226. [DOI] [PMC free article] [PubMed] [Google Scholar]
- Galarreta M, Hestrin S. Spike transmission and synchrony detection in networks of GABAergic interneurons. Science. 2001;292:2295–2299. doi: 10.1126/science.1061395. [DOI] [PubMed] [Google Scholar]
- Giniatullin RA, Khazipov RN, Vyskočil F. A correlation between quantal content and decay time of endplate currents in frog muscles with intact cholinesterase. J Physiol (Lond) 1993;466:95–103. [PMC free article] [PubMed] [Google Scholar]
- Haghighi AP, Cooper E. Neuronal nicotinic acetylcholine receptors are blocked by intracellular spermine in a voltage-dependent manner. J Neurosci. 1998;18:4050–4062. doi: 10.1523/JNEUROSCI.18-11-04050.1998. [DOI] [PMC free article] [PubMed] [Google Scholar]
- Hartzell HC, Kuffler SW, Yoshikami D. Post-synaptic potentiation: interaction between quanta of acetylcholine at the skeletal neuromuscular synapse. J Physiol (Lond) 1975;251:427–463. doi: 10.1113/jphysiol.1975.sp011102. [DOI] [PMC free article] [PubMed] [Google Scholar]
- Hefft S, Jonas P. Asynchronous GABA release generates long-lasting inhibition at a hippocampal interneuron-principal neuron synapse. Nat Neurosci. 2005;8:1319–1328. doi: 10.1038/nn1542. [DOI] [PubMed] [Google Scholar]
- Heinemann SH, Conti F. Nonstationary noise analysis and application to patch clamp recordings. Methods Enzymol. 1992;207:131–148. doi: 10.1016/0076-6879(92)07009-d. [DOI] [PubMed] [Google Scholar]
- Jonas P, Spruston N. Mechanisms shaping glutamate-mediated excitatory postsynaptic currents in the CNS. Curr Opin Neurobiol. 1994;4:366–372. doi: 10.1016/0959-4388(94)90098-1. [DOI] [PubMed] [Google Scholar]
- Katz B, Miledi R. The binding of acetylcholine to receptors and its removal from the synaptic cleft. J Physiol (Lond) 1973;231:549–574. doi: 10.1113/jphysiol.1973.sp010248. [DOI] [PMC free article] [PubMed] [Google Scholar]
- Katz B, Miledi R. The nature of the prolonged endplate depolarization in anti-esterase treated muscle. Proc R Soc Lond B Biol Sci. 1975;192:27–38. doi: 10.1098/rspb.1975.0149. [DOI] [PubMed] [Google Scholar]
- Katz B, Miledi R. Transmitter leakage from motor nerve endings. Proc R Soc Lond B Biol Sci. 1977;196:59–72. doi: 10.1098/rspb.1977.0029. [DOI] [PubMed] [Google Scholar]
- Kordaš M. An attempt at an analysis of the factors determining the time course of the end-plate current. I. The effects of prostigmine and of the ratio of Mg2+ to Ca2+ J Physiol (Lond) 1972;224:317–332. doi: 10.1113/jphysiol.1972.sp009897. [DOI] [PMC free article] [PubMed] [Google Scholar]
- Lamotte d'Incamps B, Ascher P. Four excitatory postsynaptic ionotropic receptors coactivated at the motoneuron-Renshaw cell synapse. J Neurosci. 2008;28:14121–14131. doi: 10.1523/JNEUROSCI.3311-08.2008. [DOI] [PMC free article] [PubMed] [Google Scholar]
- Lendvai B, Vizi ES. Nonsynaptic chemical transmission through nicotinic acetylcholine receptors. Physiol Rev. 2008;88:333–349. doi: 10.1152/physrev.00040.2006. [DOI] [PubMed] [Google Scholar]
- Lowe G. Flash photolysis reveals a diversity of ionotropic glutamate receptors on the mitral cell somatodendritic membrane. J Neurophysiol. 2003;90:1737–1746. doi: 10.1152/jn.00180.2003. [DOI] [PubMed] [Google Scholar]
- Magazanik LG, Nikolsky EE, Giniatullin RA. End-plate currents evoked by paired stimuli in frog muscle fibres. Pflugers Arch. 1984;401:185–192. doi: 10.1007/BF00583880. [DOI] [PubMed] [Google Scholar]
- Manuel M, Heckman CJ. Adult mouse motor units develop almost all of their force in the subprimary range: a new all-or-none strategy for force recruitment? J Neurosci. 2011;31:15188–15194. doi: 10.1523/JNEUROSCI.2893-11.2011. [DOI] [PMC free article] [PubMed] [Google Scholar]
- Mentis GZ, Alvarez FJ, Bonnot A, Richards DS, Gonzalez-Forero D, Zerda R, O'Donovan MJ. Noncholinergic excitatory actions of motoneurons in the neonatal mammalian spinal cord. Proc Natl Acad Sci U S A. 2005;102:7344–7349. doi: 10.1073/pnas.0502788102. [DOI] [PMC free article] [PubMed] [Google Scholar]
- Neher E. Correction for liquid junction potentials in patch clamp experiments. Methods Enzymol. 1992;207:123–131. doi: 10.1016/0076-6879(92)07008-c. [DOI] [PubMed] [Google Scholar]
- Nelson ME, Kuryatov A, Choi CH, Zhou Y, Lindstrom J. Alternate stoichiometries of alpha4beta2 nicotinic acetylcholine receptors. Mol Pharmacol. 2003;63:332–341. doi: 10.1124/mol.63.2.332. [DOI] [PubMed] [Google Scholar]
- Nishimaru H, Restrepo CE, Ryge J, Yanagawa Y, Kiehn O. Mammalian motor neurons corelease glutamate and acetylcholine at central synapses. Proc Natl Acad Sci U S A. 2005;102:5245–5249. doi: 10.1073/pnas.0501331102. [DOI] [PMC free article] [PubMed] [Google Scholar]
- Pan F, Mills SL, Massey SC. Screening of gap junction antagonists on dye coupling in the rabbit retina. Vis Neurosci. 2007;24:609–618. doi: 10.1017/S0952523807070472. [DOI] [PMC free article] [PubMed] [Google Scholar]
- Parnas H, Slutsky I, Rashkovan G, Silman I, Wess J, Parnas I. Depolarization initiates phasic acetylcholine release by relief of a tonic block imposed by presynaptic M2 muscarinic receptors. J Neurophysiol. 2005;93:3257–3269. doi: 10.1152/jn.01131.2004. [DOI] [PubMed] [Google Scholar]
- Pearce RA. Physiological evidence for two distinct GABAA responses in rat hippocampus. Neuron. 1993;10:189–200. doi: 10.1016/0896-6273(93)90310-n. [DOI] [PubMed] [Google Scholar]
- Rang HP. The characteristics of synaptic currents and responses to acetylcholine of rat submandibular ganglion cells. J Physiol (Lond) 1981;311:23–55. doi: 10.1113/jphysiol.1981.sp013571. [DOI] [PMC free article] [PubMed] [Google Scholar]
- Ren J, Qin C, Hu F, Tan J, Qiu L, Zhao S, Feng G, Luo M. Habenula “cholinergic” neurons co-release glutamate and acetylcholine and activate postsynaptic neurons via distinct transmission modes. Neuron. 2011;69:445–452. doi: 10.1016/j.neuron.2010.12.038. [DOI] [PubMed] [Google Scholar]
- Rossi DJ, Hamann M. Spillover-mediated transmission at inhibitory synapses promoted by high affinity alpha6 subunit GABA(A) receptors and glomerular geometry. Neuron. 1998;20:783–795. doi: 10.1016/s0896-6273(00)81016-8. [DOI] [PubMed] [Google Scholar]
- Rossi P, Sola E, Taglietti V, Borchardt T, Steigerwald F, Utvik JK, Ottersen OP, Köhr G, D'Angelo E. NMDA receptor 2 (NR2) C-terminal control of NR open probability regulates synaptic transmission and plasticity at a cerebellar synapse. J Neurosci. 2002;22:9687–9697. doi: 10.1523/JNEUROSCI.22-22-09687.2002. [DOI] [PMC free article] [PubMed] [Google Scholar]
- Scanziani M. GABA spillover activates postsynaptic GABA(B) receptors to control rhythmic hippocampal activity. Neuron. 2000;25:673–681. doi: 10.1016/s0896-6273(00)81069-7. [DOI] [PubMed] [Google Scholar]
- Stanchev D, Sargent PB. α7-Containing and non-α7-containing nicotinic receptors respond differently to spillover of acetylcholine. J Neurosci. 2011;31:14920–14930. doi: 10.1523/JNEUROSCI.3400-11.2011. [DOI] [PMC free article] [PubMed] [Google Scholar]
- Szapiro G, Barbour B. Multiple climbing fibers signal to molecular layer interneurons exclusively via glutamate spillover. Nat Neurosci. 2007;10:735–742. doi: 10.1038/nn1907. [DOI] [PubMed] [Google Scholar]
- Wathey JC, Nass MM, Lester HA. Numerical reconstruction of the quantal event at nicotinic synapses. Biophys J. 1979;27:145–164. doi: 10.1016/S0006-3495(79)85208-X. [DOI] [PMC free article] [PubMed] [Google Scholar]
- Wyllie DJ, Chen PE. Taking the time to study competitive antagonism. Br J Pharmacol. 2007;150:541–551. doi: 10.1038/sj.bjp.0706997. [DOI] [PMC free article] [PubMed] [Google Scholar]
- Zimmerman G, Soreq H. Termination and beyond: acetylcholinesterase as a modulator of synaptic transmission. Cell Tissue Res. 2006;326:655–669. doi: 10.1007/s00441-006-0239-8. [DOI] [PubMed] [Google Scholar]
- Zsiros V, Aradi I, Maccaferri G. Propagation of postsynaptic currents and potentials via gap junctions in GABAergic networks of the rat hippocampus. J Physiol (Lond) 2007;578:527–544. doi: 10.1113/jphysiol.2006.123463. [DOI] [PMC free article] [PubMed] [Google Scholar]
- Zwart R, Vijverberg HP. Four pharmacologically distinct subtypes of alpha4beta2 nicotinic acetylcholine receptor expressed in Xenopus laevis oocytes. Mol Pharmacol. 1998;54:1124–1131. [PubMed] [Google Scholar]