

Abstract
Sleep is an essential biological need of all animals studied to date. The sleep disorder narcolepsy is characterized by excessive daytime sleepiness, fragmentation of nighttime sleep, and cataplexy. Narcolepsy is caused by selective degeneration of hypothalamic hypocretin/orexin (HCRT) neurons. In mammals, HCRT neurons primarily regulate the sleep/wake cycle, feeding, reward-seeking, and addiction. The role of HCRT neurons in zebrafish is implicated in both sleep and wake regulation. We established a transgenic zebrafish model enabling inducible ablation of HCRT neurons and used these animals to understand the function of HCRT neurons and narcolepsy. Loss of HCRT neurons increased the expression of the HCRT receptor (hcrtr). Behavioral assays revealed that HCRT neuron-ablated larvae had normal locomotor activity, but demonstrated an increase in sleep time during the day and an increased number of sleep/wake transitions during both day and night. Mild sleep disturbance reduced sleep and increased c-fos expression in HCRT neuron-ablated larvae. Furthermore, ablation of HCRT neurons altered the behavioral response to external stimuli. Exposure to light during the night decreased locomotor activity of wild-type siblings, but induced an opposite response in HCRT neuron-ablated larvae. Sound stimulus during the day reduced the locomotor activity of wild-type sibling larvae, while HCRT neuron-ablated larvae demonstrated a hyposensitive response. This study establishes zebrafish as a model for narcolepsy, and indicating a role of HCRT neurons in regulation of sleep/wake transitions during both day and night. Our results further suggest a key role of HCRT neurons in mediating behavioral state transitions in response to external stimuli.
Introduction
Sleep behavior is conserved in all animal species (Siegel, 2005; Zimmerman et al., 2008) and sleep disorders represent a major public health challenge. The sleep disorder narcolepsy is characterized by excessive daytime sleepiness, fragmentation of sleep during the night, sleep paralysis, dream-like hypnagogic hallucinations, and cataplexy (brief loss of muscle tone triggered by emotional stimuli). In narcoleptic patients, hypocretin/orexin (HCRT) neurons are lost through a highly selective neurodegenerative or autoimmune process (Nishino and Sakurai, 2006; Sehgal and Mignot, 2011). The HCRT neuropeptides are expressed in a specific population of neurons in the lateral hypothalamus (LH), which project widely throughout the brain and mainly regulate the sleep/wake cycle, food intake, reward, and drug addiction (de Lecea et al., 1998; Peyron et al., 1998; Sakurai et al., 1998; Bonnavion and de Lecea, 2010).
In animal models, narcolepsy can be produced by disrupting HCRT neurotransmission (Sakurai, 2007). HCRT receptor (HCRTR)-deficient dogs and HCRT or HCRTR knock-out mice display phenotypes that strongly resemble the condition in humans (Chemelli et al., 1999; Lin et al., 1999; Willie et al., 2003). HCRT neuron-ablated transgenic mice display a similar and sometimes even more severe phenotype. These mice exhibit cataplexy-like behavioral arrests and poorly consolidated sleep and wakefulness (Hara et al., 2001). Moreover, the development of obesity in the HCRT neuron-ablated mice is different from that of knock-out mice (Hara et al., 2005), suggesting that complete loss of HCRT neuropeptides and colocalized proteins are important to produce the full spectrum of narcolepsy symptoms.
In a variety of nonmammalian model systems, including zebrafish, sleep is recognized by behavioral criteria (Hendricks et al., 2000; Shaw et al., 2000; Raizen et al., 2008; Zhdanova, 2011) and is defined by periods of quiescence associated with a specific posture and increased arousal threshold. In zebrafish, the neuronal circuit organization and the circadian and homeostatic (compensatory increased sleep following sleep deprivation) processes that regulate sleep are largely conserved with mammals (Zhdanova et al., 2001; Prober et al., 2006; Yokogawa et al., 2007; Rihel et al., 2010). The zebrafish HCRT neuronal network is simple and comprises only ∼20–60 hypothalamic neurons that project to several areas in the brain, including putative wake- and sleep-regulating neurons, such as the hindbrain and pineal gland, respectively (Kaslin et al., 2004; Faraco et al., 2006; Prober et al., 2006; Appelbaum et al., 2009, 2010). Global overexpression of HCRT in larval zebrafish induces wakefulness (Prober et al., 2006) and the HCRT-receptor mutant (hcrtr−/−) adult zebrafish exhibits sleep fragmentation during the night (Yokogawa et al., 2007). Accordingly, HCRT neurons may have a dual function in regulating both wake and sleep consolidation (Appelbaum et al., 2009).
To elucidate the function of HCRT neurons and to understand the phenotype of narcolepsy, we established transgenic zebrafish that express an inducible intracellular toxin, specifically in HCRT neurons. We found that loss of HCRT neurons increased hcrtr expression, reduced the ability to consolidate wake or sleep, and altered the responsiveness to external stimuli during day and night.
Materials and Methods
Zebrafish husbandry.
Adult zebrafish (Danio rerio) were reared and maintained in fully automated zebrafish housing systems (28 ± 0.5°C, pH 7.0, conductivity 300 μS; Aquazone) under 14 h light/10 h dark cycling [LD; first light at 9:00 A.M. (zeitgeber time ZT0)]. The embryos were generated by natural spawning and reared in egg water (0.2 mg/L Instant Ocean, 3 g/l mm CHNaO3, and 0.15% methylene blue dissolved in reverse osmosis purified water) under LD in a 28 ± 0.5°C incubator. For whole-mount in situ hybridization (ISH) and in vivo imaging experiments, embryos were reared in 0.2 mM N-phenylthiourea to prevent larval pigmentation. All animal protocols were reviewed and approved by the Bar-Ilan University Bioethics Committee and the animals were of either sex.
DNA constructs.
A pT2-hcrt:nfsB-EGFP vector was generated on the backbone of the pT2-ins:nfsB construct, kindly provided by Dr. Michael Parsons (Pisharath et al., 2007). Enhanced green fluorescent protein (EGFP) flanked by ClaI was amplified and subcloned downstream to the nitroreductase gene (nfsB) to create the fusion protein nfsB-EGFP. HCRT promoter (Faraco et al., 2006) flanked by NcoI/BamHI was amplified and subcloned upstream to nfsB replacing the insulin promoter. To prepare probes for whole-mount ISH experiments, the full coding sequences of the following genes were amplified: hcrt (DQ831346.1), mch1 (FJ204827.1), hcrtr (EF150847.1), dat (NM_131755.1), dβh (NM_001109694.2), tph2 (NM_214795.1), tph1 (NM_178306.2), and th1 (NM_131149.1). All cDNA fragments were subcloned into a pCRII-TOPO vector (Invitrogen) and served as a template to transcribe antisense mRNA probes.
Transient expression assay and establishment of stable transgenic lines.
In a transient expression assay, the pT2-hcrt:nfsB-EGFP vector was diluted to 50 ng/μl and microinjected into one-cell-stage eggs using a micromanipulator and PV830 Pneumatic Pico Pump (World Precision Instruments). The embryos were maintained in Petri dishes and the pattern of EGFP expression in HCRT neurons was monitored throughout development. To generate stable transgenic Tg(hcrt:nfsB-EGFP) fish, we used the Tol2 system (Kawakami, 2004). Capped RNA encoding transposase and the construct pT2-hcrt:nfsB-EGFP (10 ng/μl each) were coinjected into fertilized eggs at the one-cell stage. The injected fish were raised to adulthood and screened for integration of the transgene into the germline. Transgenic EGFP-positive lines were isolated using a fluorescence stereomicroscope. Four transgenic lines were obtained. All lines showed specific EGFP expression in the HCRT neurons. The Tg(hcrt:nfsB-EGFP) line that showed the strongest transgene expression was used in this study. For ablation experiments, the Tg(hcrt:EGFP) transgenic line (Appelbaum et al., 2009) was used as a control.
Nitroreductase-metronidazole-mediated HCRT-neuron ablation in larvae.
Targeted ablation of a specific cell population, using transgenesis of nitroreductase (encoded by the nfsb gene) and application of the prodrug metronidazole (MET; Sigma Aldrich), is a well established method used in live zebrafish (Pisharath et al., 2007; Curado et al., 2008; Pisharath and Parsons, 2009). To calibrate the timing and dose necessary to specifically ablate HCRT neurons, homozygous Tg(hcrt:nfsB-EGFP) embryos at different stages [1, 24, and 48 h postfertilization (hpf)] were incubated at a range of MET concentrations (1, 5, 10, 15, and 20 mm), for periods of 12, 24, 48, and 72 h in constant darkness. Incubation for 48 h (24–72 hpf) in 15 mM MET was chosen as the most efficient protocol to ablate HCRT neurons, because these conditions resulted in specific loss of EGFP fluorescence with no apparent off-target effects on the larvae. In all experiments, progeny from intercrosses of heterozygous Tg(hcrt:nfsB-EGFP) transgenic fish were sorted under a fluorescent stereomicroscope, and larvae with a robust EGFP signal and larvae lacking an EGFP signal (WT-sibling) were used for neuron ablation and as controls, respectively. At 24 hpf, embryos were dechorionized with Pronase (Sigma Aldrich) and neuron ablation was induced. At 48 hpf, MET-containing water was refreshed, and at 72 hpf, larvae were washed several times to remove all traces of MET and kept at 28 ± 0.5°C in a light-controlled incubator under LD cycle.
Whole-mount ISH.
HCRT neuron-ablated and WT-sibling larvae [72 hpf and 6 days postfertilization (dpf)] were fixed in 4% paraformaldehyde overnight at 4°C and stored in 100% methanol. The location and level of mRNA expression was detected by whole-mount ISH, as described previously (Appelbaum et al., 2009). Digoxigenin-labeled full-length antisense riboprobes for hcrt, hcrtr, mch1, tph2, tph1, dat, dβh, and th1 were transcribed in vitro using standard reagents (Roche) and the constructs described above.
Real-time quantitative PCR.
The level of mRNA expression of hcrtr, c-fos, and β-actin was determined using quantitative PCR assay in three (hcrtr and β-actin) and four (c-fos and β-actin) independent experiments. Total mRNA of HCRT neuron-ablated and WT-sibling 6 dpf larvae was extracted using RNeasy Protect Mini Kit (Qiagen) according to the manufacturer's instructions. A similar amount of mRNA (hcrtr, 280 ng; c-fos, 300 ng) was reverse-transcribed using Oligo(dT) oligos and SuperScript III RT (Invitrogen) according to the manufacturer's instructions. Transcript levels were determined by Applied Biosystems 7900HT Fast Real-Time PCR System using the KAPA SYBR FAST qPCR Kit (Kapa Biosystems) following the manufacturer's instructions. Triplicate first-strand cDNA aliquots from each sample served as templates for real-time PCR. The relative quantification of hcrtr or c-fos gene expression levels was normalized against β-actin gene and subjected to the ΔΔCT analysis (Schmittgen and Livak, 2008).
Behavioral assays.
Rhythmic activity and sleep were monitored using video-tracking of 6 dpf larvae. To acclimate the larvae to the new environment, 5 dpf larvae were placed, individually, into each well of a 24-well plate filled with 2 ml of embryo water at 28 ± 0.5°C under LD. To maintain uniformity in data collection, the larvae from both genotypes were placed alternately in adjacent wells in the 24-well plate. The 24-well plate was positioned in the DanioVision tracking system (Noldus Information Technology; see Fig. 6A) 3 h before the experiment. The larvae were illuminated with an infrared light (to continuously enable camera detection) and with 900 lux white light (to maintain a light/dark cycle or apply light pulse). The movement data from each larva were collected using the EthoVision XT8 software (Noldus Information Technology), and the detection threshold was set to detect moving black pixels.
Figure 6.

HCRT neuron-ablated larvae are hyposensitive to external sound stimuli. Schematic diagram of the behavioral system (A). Larvae swim in wells of a 24-well plate and are constantly monitored by an infrared (IR) camera. White light and sound are turned on and off as required. Locomotor activity was recorded in 6 dpf Tg(hcrt:nfsB-EGFP) and WT-sibling larvae that were treated with MET (B, C). Recording of sound/silence transition was continued for 90 min under constant white light, with alternating 30 min periods of silence and sound between ZT4.5–ZT6 (rectangle with musical note represents sound period, B). HCRT neuron-ablated larvae (n = 48) were hyposensitive to sound stimuli compared with their WT-siblings (n = 48; p < 0.01, repeated-measures ANOVA). These results are also presented by analysis of average activity in each 30 min period of silence or sound (C). Different letters represent statistically significant differences. Values are represented as means ± SEM.
As the application of the Noldus DanioVision tracking system in zebrafish larvae is novel, key system parameters were first calibrated. To calibrate the signal-to-noise ratio and detection parameters of the system, immobile and mobile larvae were monitored. To set the lowest thresholds of activity for distance (measured in centimeters) and velocity (measured in centimeters/second), the basal activity of immobile 6 dpf larvae was measured for 10 consecutive minutes in several individual larvae. The average values of swimming distance and velocity were defined as the lowest threshold of activity and were in good agreement with the visual observation of immobile larvae. The software parameters for detection were set as follows: dynamic subtraction, subject is darker than background, dark contrast 16–60, current frame weight 1 (gray scale value of pixel/inch of the reference image of sample n), subject size of minimum 1 pixel and maximum 125,000 pixels, subject contour turned off, video sample rate of 12.5 frames per second, and no pixel smoothing. The raw data were converted into total seconds or centimeters spent moving per time bin for each larva according to the following parameters: distance threshold, 0.3 cm; time threshold, averaging interval 1, stop velocity 0.59 cm/s, start velocity 0.6 cm/s. The data were analyzed using Excel (Microsoft) to extract multiple parameters including: locomotor activity, sleep time, and number of sleep/wake transitions.
In 24-h sleep and activity experiments, five to 10 independent experiments were performed using Tg(hcrt:nfsB-EGFP) and WT-sibling larvae. To verify that the behavioral criteria of sleep (Prober et al., 2006) are valid in the DanioVision system, dose–response experiments of arousal threshold were performed in WT larvae. The larvae were placed overnight at 5 dpf in a 24-well plate filled with embryo water and, on the following day, placed in the tracking system. During the night, 6 dpf larvae were exposed to 1 min of light of the following intensities: 14, 18, 25, and 900 lux. Four independent assays were performed under low light intensities, and six independent assays were performed under 900 lux light intensity. Mild sleep-disturbance (MSD) experiments were performed under constant darkness during a period of 6 h (ZT14–ZT20). Larvae were placed in a 24-well plate on a 3D rotator waver (speed: 5, tilt: 5; Henry Troemner), and the slow rolling of four glass marbles produced variable levels of mild vibrations. Following MSD, sleep amount and c-fos expression levels were measured in HCRT neuron-ablated and WT-sibling larvae.
To further study the impact of external stimuli on larval behavior, light/dark and sound/silence transition assays were conducted. Both Tg(hcrt:nfsB-EGFP) and WT-sibling larvae were treated with MET at 24 hpf, as described above. Light/dark-transition assays were performed at ZT4.5 (during the day) and ZT15 (during the night). The experiments lasted 3 h and 10 min, and started with 30 min of light. Threshold parameters for detection were similar to the 24 h LD experiments. During the night time, six independent assays were conducted, using Tg(hcrt:nfsB-EGFP) and WT-sibling larvae. Sound-transition assays were performed at ZT4.5 (during the day) and ZT15 (during the night) under constant light or constant dark, respectively. The experiments lasted 90 min and started with 30 min of silence, followed by 30 min of sound, and ended with 30 min of silence. Threshold parameters for detection of activity were similar to the described above. Sound was produced from Dell AY410 speakers and was controlled by the behavioral system computer; intensity was maintained at 110 dB by measurement with a SL-4030 sound-level meter (Lutron Electronic Enterprise). The speakers were placed 5 cm away from the front of the behavior system on a separate table to eliminate vibrations or other nonsound stimulation (see Fig. 6A). Four independent experiments were performed using Tg(hcrt:nfsB-EGFP) and WT-sibling larvae.
Imaging.
Live 72 hpf and 6 dpf larvae were anesthetized with Tricaine (0.01%) and placed in low-melting-point agarose (0.5–1.0%) in a specially designed chamber filled with embryo water. Confocal imaging was performed using an LSM780 upright confocal microscope (Zeiss). An epifluorescence stereomicroscope (Leica M167FC) was used to screen and visualize EGFP-expressing transgenic-lines and for imaging ISH-stained larvae. Pictures were taken using Application Suite imaging software V3.7 (Leica). All images were processed using ImageJ (NIH) and Adobe Photoshop software.
Statistical analysis.
Comparisons of arousal threshold activity ratios between active and sleeping larvae were performed using χ2. In quantitative real-time PCR assay, hcrtr and c-fos levels were normalized by dividing the absolute levels of each sample with the average of all WT-sibling samples. Two-way ANOVA was used to compare the expression level of both genotypes. In behavior experiments, repeated-measures ANOVA with grouping factor followed by Bonferroni post hoc effects was used to compare activity and sleep values levels of Tg(hcrt:nfsB-EGFP) and WT-sibling larvae. To compare activity and sleep values during the day versus the night, a mixed-effect model with repeated measures was performed. Two-tailed Student's t test was used to show differences in maximum activity during the light-to-dark transition in the 24-h-activity experiment and to show the differences in sleep time in MSD experiments. In all experiments, data are presented as means ± SEM. The degree of freedom for each statistical test is indicated for each significant value.
Results
Inducible and specific ablation of HCRT neurons in transgenic zebrafish larvae
The zebrafish HCRT neuronal system is largely conserved with that of mammals and is located in the LH (Kaslin et al., 2004; Faraco et al., 2006; Prober et al., 2006; Yokogawa et al., 2007; Appelbaum et al., 2009; Panula, 2010; Zhdanova, 2011). To induce HCRT-neuron ablation, we used the nitroreductase-metronidazole-based inducible cell-ablation system. In this technique, the E. coli nitroreductase gene, nfsB, induces cell-autonomous apoptosis in zebrafish, following treatment with the prodrug, MET (Pisharath et al., 2007; Curado et al., 2008). We used the zebrafish 2-kilobasepair hcrt promoter to drive the expression of the nfsB-EGFP fusion protein specifically in HCRT neurons. This promoter was extensively used to characterize HCRT neuronal anatomy at high resolution, and ectopic expression of EGFP was never observed (Faraco et al., 2006; Appelbaum et al., 2009, 2010). To generate a transgenic line, the construct pT2-hcrt:nfsB-EGFP was coinjected with Tol2 transposase mRNA into single-cell embryos, which produced embryos with specific nfsB-EGFP expression in HCRT neurons. The progeny of these founder fish were screened, and a stable Tg(hcrt:nfsB-EGFP) transgenic line was isolated. In this line, the expression of a nfsB-EGFP fusion protein was strong and specific to HCRT neurons during development (Fig. 1A,E). Furthermore, under control naive conditions (without MET), expression of nfsB-EGFP did not affect HCRT neuron localization or projections (Fig. 1A,E), indicating that nfsB is not toxic in the absence of MET-induced activation.
Figure 1.

Establishment of inducible HCRT neuron-ablated transgenic larvae. Confocal fluorescence (left) and stereomicroscopic ISH (right) imaging of representative larvae (dorsal view with head pointing to the top). As indicated by confocal imaging of EGFP expression, MET treatment induced HCRT cell-ablation in 72 hpf and 6 dpf Tg(hcrt:nfsB-EGFP) larvae (B, F). Hcrt (C, G, D, H) and mch (K, L, O, P) mRNA ISH pattern in 72 hpf and 6 dpf larvae, all with MET treatment. MET treatment caused specific cell ablation in HCRT neurons (D, H) and had no effect on adjacent MCH neurons (L, P). HCRT-neuron ablation was not induced in the absence of nfsB (C, G, J, N) or MET (A, E). In A, arrows and arrowheads indicate the soma of HCRT neurons and projecting axons, respectively. In B, D, F, and H, arrows indicate cell residues after ablation. Scale bars: A, B, E, F, I, J, M, N, 50 μm; C, D, G, H, K, L, O, P, 250 μm.
To test the ability of nfsB to elicit MET-dependent HCRT-neuron ablation, Tg(hcrt:nfsB-EGFP) and control Tg(hcrt:EGFP) 24 hpf embryos were incubated for 48 h in 15 mM MET. At 72 hpf, all Tg(hcrt:EGFP) MET-treated larvae showed normal EGFP expression in the soma, dendrites, and axons (Fig. 1, I vs J). In contrast, in Tg(hcrt:nfsB-EGFP) MET-treated larvae, EGFP expression was mostly absent in 76% of the larvae (0 or 1–4 cell bodies with weak expression; Fig. 1, A vs B). In 24% of the larvae, we observed partial ablation, which was indicated by weak EGFP expression in the soma of 4–10 neurons and undetectable dendrites and axons. This partial ablation is typical of the nitroreductase-metronidazole-based technique and was observed in other ablated tissues as well (Zhao et al., 2009; Montgomery et al., 2010). To further validate the efficacy of MET-induced HCRT-neuron ablation, we performed whole-mount ISH to detect elimination of endogenous hcrt expression under MET treatment. While the level of hcrt mRNA expression was normal in WT-sibling larvae (Fig. 1C), hcrt expression was absent from all or most HCRT neurons (Fig. 1D). To verify that nfsB-dependent MET treatment had no ectopic effect outside of the targeted HCRT neurons, we monitored the expression of the melanin-concentrating hormone 1 (mch1) gene. MCH1 neurons are localized in close proximity to HCRT neurons in the LH (Berman et al., 2009). In both Tg(hcrt:nfsB-EGFP) and WT-sibling larvae, MET treatment had no effect on MCH1 neurons (Fig. 1K,L,O,P). These results indicate that MET induced nfsB-dependent specific ablation of HCRT neurons, with no off-target effect on adjacent LH neurons.
To verify that HCRT neurons do not regenerate at 6 dpf (the age at which all behavioral experiments were performed), hcrt mRNA levels and EGFP expression were measured. In Tg(hcrt:EGFP) 6 dpf larvae, MET treatment had no toxic effect on HCRT neuron development and projections (Fig. 1, M vs N). In contrast, in HCRT neuron-ablated 6 dpf larvae, the expression of hcrt and EGFP signals was absent or restricted to only 1–4 cell bodies, and no dendrites or axons were observed (Fig. 1, E vs F and G vs H). Altogether, these results show that the Tg(hcrt:nfsB-EGFP)/MET system is able to temporally and spatially induce restricted HCRT-neuron ablation, and these neurons do not regenerate in developing zebrafish larvae.
HCRT-neuron ablation increases hcrtr transcription in downstream target neurons
In mammals, the HCRT neurons project to widespread areas in the brain, including serotonergic, noradrenergic, dopaminergic, and histaminergic neurons. The zebrafish HCRT neurons project toward similar brain nuclei and into the spinal cord (Kaslin et al., 2004; Prober et al., 2006; Yokogawa et al., 2007; Appelbaum et al., 2009; Panula, 2010). To study the effect of HCRT-neuron ablation on gene expression in putative neuronal targets, we performed semiquantitative whole-mount ISH of key marker genes. In both HCRT neuron-ablated and WT-sibling 6 dpf larvae, the expression levels of tryptophan hydroxylase 1 and 2 (tph1/2, serotoninergic neurons), dopamine β hydroxylase (dβh, noradrenergic neurons), tyrosine hydroxylase 1, and dopamine transporter (th1 and dat, dopaminegic neurons) were similar (representative pictures of th1 and tph2 are shown in Fig. 2A–D). These results show that the loss of HCRT neurons does not affect the mRNA levels of marker genes and suggest that the serotonergic, dopaminergic, and noradrenergic neurons remain intact.
Figure 2.
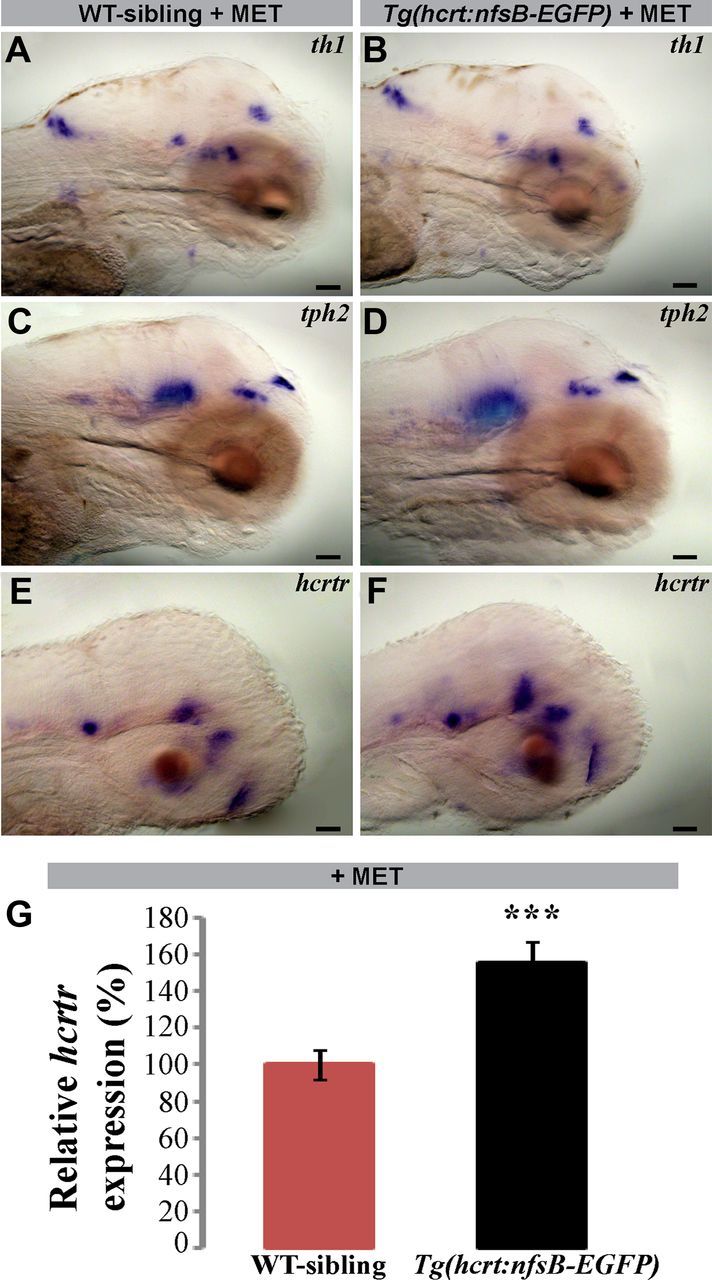
Loss of HCRT neurons increases hcrtr mRNA expression. Lateral view (head pointing to the right) of representative 6 dpf (A–D) and 72 hpf (E, F) larvae expressing tyrosine hydroxylase (th1), tryptophan hydroxylase 2 (tph2), and hypocretin receptor (hcrtr). Following MET treatment, no differences were found in the expression levels and localizations of th1 (A, B) and tph2 (C, D) in HCRT neuron-ablated larvae (Tg(hcrt:nfsB-EGFP)+MET; B, D) compared with their WT-siblings (A, C). However, the expression of hcrtr was stronger in HCRT neuron-ablated larvae compared with their WT-siblings (F, E). Three independent RT-PCR experiments were performed to quantify the hcrtr mRNA expression levels in 6 dpf larvae. Endogenous hcrtr expression increased by 55% in HCRT neuron-ablated larvae compared with their WT-siblings (G). Values are represented as means ± SEM. ***p < 0.001, two-way ANOVA. Scale bar, 250 μm.
We next tested whether the absence of HCRT neuronal input could affect the level of mRNA expression of the HCRT receptor gene (hcrtr) in downstream target neurons. In zebrafish, hcrtr is expressed in several discrete clusters of neurons in the forebrain, midbrain, and hindbrain, as well as in neurons along the spinal cord (Prober et al., 2006; Yokogawa et al., 2007). Whole-mount ISH assays showed that the level of expression of hcrtr increased in 72 hpf HCRT neuron-ablated larvae compared with their WT-siblings (Fig. 2, E vs F). To quantify these expression changes, hcrtr mRNA levels from HCRT neuron-ablated and WT-sibling 6 dpf larvae were measured using quantitative RT-PCR. We found that the hcrtr expression level increased by 55% in HCRT neuron-ablated larvae compared with their WT-siblings (WT: 100 ± 8%; HCRT neuron-ablated: 155 ± 11%; F(1,15) = 17.30, p < 0.001, normalized values, two-way ANOVA; Fig. 2G). These results show that hcrtr expression is regulated by innervations of HCRT neurons and that loss of these neurons may trigger compensatory enhancement in hcrtr mRNA levels. Furthermore, increase of hcrtr expression in 6 dpf HCRT neuron-ablated larvae hint at an alteration in brain function that might result in behavioral changes.
Locomotor activity is normal in HCRT neuron-ablated larvae
Custom-made or commercially available video-tracking systems were previously used to monitor day and night variation in locomotor activity of the diurnal zebrafish larvae (Cahill et al., 1998; Zhdanova et al., 2001; Prober et al., 2006; Yokogawa et al., 2007; Sigurgeirsson et al., 2011). Using the Noldus Danio Vision behavior system, we monitored the rhythmic activity of Tg(hcrt:nfsB-EGFP) (n = 60) and their WT-sibling (n = 60) 6 dpf larvae during day and night. As expected, under LD conditions, both genotypes exhibited similar rhythmic activity that peaked during the day (WT: F(1,778) = 1403.80; Tg(hcrt:nfsB-EGFP): F(1,1769) = 1372.05; p < 0.001 for both genotypes, mixed-effect model with repeated measures; Fig. 3A,A'). Likewise, no differences were found between the rhythmic activity of MET-treated HCRT neuron-ablated (Tg(hcrt:nfsB-EGFP) + MET, n = 122) and WT-sibling (+MET, n = 118) larvae (WT: F(1,1674) = 1797.24; HCRT neuron-ablated larvae: F(1,1652) = 1888.58; p < 0.001 for both genotypes, mixed-effect model with repeated measures; Fig. 3B,B'). Accordingly, the hcrt:nfsB-EGFP transgene, MET treatment, and ablation of HCRT neurons each have no detectable independent effect on larval development and rhythmic locomotor activity.
Figure 3.

Similar locomotor activity in Tg(hcrt:nfsB-EGFP) and WT-sibling larvae under baseline naive conditions. Recording of locomotor activity was performed in 6 dpf larvae and continued for 24 h under 14 h light/10 h dark cycle (white and black bars represent light and dark periods, respectively). Rhythmic activity of Tg(hcrt:nfsB-EGFP) (n = 60) and WT-sibling (n = 60) larvae was monitored in the absence of MET (A) and after MET treatment (B; Tg(hcrt:nfsB-EGFP) + MET, n = 122; WT-siblings + MET, n = 118). Bar charts (A', B') represent the average data for total daytime or total nighttime for each genotype. Values are represented as means ± SEM.
Sleep is normal in Tg(hcrt:nfsB-EGFP) larvae under naive conditions
Over a decade ago, behavioral criteria were initially established to study sleep in the zebrafish model (Zhdanova et al., 2001). In zebrafish larvae, sleep is defined as at least 1 min of immobility and inactivity during this period is associated with an increased arousal threshold. A wake state is defined as a period of at least 1 min with detectable activity (Prober et al., 2006). To verify that these sleep parameters can be applied in the Noldus Danio Vision behavior system, the nighttime activity of 6 dpf WT larvae was measured before and after light stimuli of four different intensities (for details, see Materials and Methods, above). As expected, increasing light intensities were correlated with an increasing number of responsive larvae in both mobile and immobile larvae (mobile: χ(3)2 = 17.03, p < 0.001; immobile: χ(3)2 = 34.77, p < 0.001, χ2 test; Table 1). At high light intensities (>25 lux), the majority of both mobile (any detectable activity during 1 min before the light stimulus) and immobile (inactive during 1 min before the light stimulus) larvae responded within 1 min following stimulus initiation. In contrast, at lower light intensities (14 and 18 lux), the number of readily responsive larvae was significantly lower in immobile compared with mobile larvae (14 lux: χ(1)2 = 5.98, p < 0.05; 18 lux: χ(1)2 = 12.01, p < 0.001, χ2 test; Table 1). These results show that the arousal threshold of 1 min immobile larvae increased, in agreement with previous observations (Prober et al., 2006). We next monitored sleep during day and night in Tg(hcrt:nfsB-EGFP) (n = 60) and their WT-sibling (n = 60) larvae under naive conditions (without MET treatment). Both groups slept more during the night (WT: F(1,1058) = 2590.20; Tg(hcrt:nfsB-EGFP): F(1,720) = 4173.27; p < 0.001 for both genotypes, mixed-effect model with repeated measures) and no differences were found between the two genotypes (Fig. 4A,A'). These results show that the hcrt:nfsB-EGFP transgene does not affect sleep in the absence of neuron ablation.
Table 1.
Dose-response analysis of the effect of light stimuli on locomotor activity during the night in mobile and immobile 6 dpf larvae
| Light intensity (Lux) | Number of responsive larvae (>0 s/min) | Number of non-responsive larvae (=0 s/min) | Ratio (%) |
|---|---|---|---|
| Mobile before light stimuli | |||
| 14 | 29 | 18 | 61.7* |
| 18 | 59 | 32 | 64.8** |
| 25 | 40 | 7 | 85.1 |
| 900 | 43 | 3 | 93.5 |
| Immobile before light stimuli | |||
| 14 | 18 | 31 | 36.7* |
| 18 | 35 | 66 | 34.7** |
| 25 | 37 | 12 | 75.5 |
| 900 | 18 | 2 | 90.0 |
*p < 0.05;
**p < 0.01; χ2 test.
Figure 4.

Fragmented and increased sleep and sensitivity to mild sleep disturbance in HCRT neuron-ablated larvae. Recording of sleep was performed in 6 dpf larvae and lasted for 24 h under 14 h light/10 h dark cycle (white and black bars represent light and dark periods, respectively). In the absence of MET, both Tg(hcrt:nfsB-EGFP) and WT-siblings demonstrated similar sleep time during the day and night (n = 60 for each genotype, A). However, after MET treatment (B), HCRT neuron-ablated larvae (n = 122) slept more (p < 0.01, repeated-measures ANOVA) than WT-siblings (n = 118). The bar charts (A', B') represent the average sleep for total daytime or total nighttime for each genotype. Notably, in untreated larvae, the number of sleep/wake transitions per hour is rhythmic and similar in both Tg(hcrt:nfsB-EGFP) and WT-sibling (C). However, after MET treatment, the number of sleep/wake transitions per hour increased in HCRT neuron-ablated larvae during the day and the night (*p < 0.05, **p < 0.01, repeated-measures ANOVA; D). The bar charts (C', D') represent the average sleep/wake transitions for total daytime or total nighttime for each genotype. HCRT neuron-ablated (Tg(hcrt:nfsB-EGFP)+MET) and WT-sibling (+MET) larvae were subjected to 6 h of MSD. White and black bars represent light and dark periods, respectively, and gray bars represent MSD (E). At ZT20 (black arrowhead, E), sleep time (F) and c-fos (G) expression were quantified. MSD did not affect sleep time (n = 48, F) or c-fos expression (n = 60, F) in WT-sibling larvae. In contrast, following MSD, HCRT neuron-ablated larvae showed reduced sleep (n = 48; *p < 0.05, Student's t test; F) and increased c-fos expression (n = 60, ***p < 0.001, two-way ANOVA; G). Four independent MSD experiments were performed to quantify c-fos and sleep time. Values are represented as means ± SEM.
Ablation of HCRT neurons increases sleep time and the number of sleep/wake transitions
To understand the effect of HCRT-neuron ablation on sleep, we monitored sleep architecture in HCRT neuron-ablated (Tg(hcrt:nfsB-EGFP)+MET) and their WT-sibling (+MET) larvae during day and night. Both groups slept more during the night (WT: F(1,1792) = 2024.93; HCRT neuron-ablated larvae: F(1,2690) = 1602.93; p < 0.001 for both genotypes, mixed-effect model with repeated measures, Fig. 4B,B') and sleep time was significantly increased in HCRT neuron-ablated larvae during a 24 h period (F(1,238) = 6.74, p < 0.01, repeated-measures ANOVA; Fig. 4B). During the day, HCRT neuron-ablated larvae slept 40% more compared with their WT-siblings (HCRT neuron-ablated: 7.7 ± 1.2 min sleep/h, n = 122; WT: 4.6 ± 0.8 min sleep/h, n = 118; F(1,238) = 6.89, p < 0.01, repeated-measures ANOVA; Fig. 4B'); however, both genotypes demonstrated similar sleep time during the night. These results show that loss of HCRT neurons increase sleep time during the day.
Fragmented sleep during the night and alteration in wake consolidation during the day are hallmarks of narcoleptic patients (Nishino and Sakurai, 2006). To study sleep distribution, we monitored the number of transitions between wake and sleep states during day and night. Under both MET and naive (without MET) conditions, the number of sleep/wake transitions increased approximately fourfold during the night compared with the day (naive-WT: F(1,1319) = 2877.62; Tg(hcrt:nfsB-EGFP): F(1,1182) = 4221.68; p < 0.001 for both genotypes, Fig. 4C,C'; MET-WT: F(1,2043) = 2544.15; HCRT neuron-ablated larvae: F(1,2690) = 1602.93; p < 0.001 for both genotypes, mixed-effect model with repeated measures; Fig. 4D,D'). In naive conditions (absence of ablation), the transition number was similar in both Tg(hcrt:nfsB-EGFP) and WT-siblings during day and night (Fig. 4C,C‘). In contrast, the number of transitions significantly increased (F(1,238) = 11.01, p < 0.01, repeated-measures ANOVA) in MET-treated HCRT neuron-ablated larvae compared with MET-treated WT-siblings during a 24 h period (Fig. 4D). Specifically, the number of sleep/wake transitions increased by 25% and 10% during the day and night, respectively, in HCRT neuron-ablated larvae (day-HCRT neuron-ablated: 7.1 ± 0.8 transitions/h, n = 122; WT: 5.4 ± 0.6 transitions/h, n = 118; F(1,238) = 5.88, p < 0.05; night- HCRT neuron-ablated: 21.8 ± 0.7 transitions/h, n = 122; WT: 19.7 ± 0.8 transitions/h, n = 118; F(1,238) = 7.19, p < 0.01, repeated-measures ANOVA; Fig. 4D'). These results show that lack of HCRT neurons causes sleep and wake fragmentation during night and day, respectively. These results further demonstrate that the function of the zebrafish HCRT neurons is conserved with that of mammals and suggest that a key role of these neurons is to regulate behavioral state changes such as sleep and wake transitions.
Mild sleep disturbance reduces sleep time and increases c-fos expression in HCRT neuron-ablated larvae
Since nighttime sleep is fragmented in HCRT neuron-ablated larvae, we hypothesized that they might be sensitive to MSD. To analyze the impact of MSD on sleep time, MET-treated 6 dpf HCRT neuron-ablated and WT-sibling larvae were mildly disturbed during a period of 6 h (ZT14–ZT20) in constant darkness (for details, see Materials and Methods, above; Fig. 4E). Control groups of 6 dpf HCRT neuron-ablated and WT-sibling larvae were undisturbed and also kept in constant darkness for 6 h (ZT14–ZT20). At ZT20, the sleep time of mild sleep-disturbed and control larvae was quantified. As expected, MSD did not affect the sleep time of WT-sibling larvae (n = 48; Fig. 4F). In contrast, sleep time was reduced by 26% in HCRT neuron-ablated larvae following MSD (control: 17.1 ± 1.7 min sleep/h, n = 48; MSD: 12.8 ± 1.4 min sleep/h, n = 48; t(91) = 2.02, p < 0.05, Student's t test; Fig. 4F). These results were further confirmed using RT-PCR quantification of the expression levels of c-fos mRNA. This gene is a well established marker for brain activity and wakefulness in mammals and zebrafish (Cirelli and Tononi, 2000; Appelbaum et al., 2010). In concurrence with the sleep-behavior results, MSD had no effect on the level of c-fos expression in WT-sibling larvae (Fig. 4G). In contrast, the expression levels of c-fos increased by 41% after MSD in HCRT neuron-ablated larvae (control: 76 ± 8%, n = 60; MSD: 129 ± 9%, n = 60; F(1,23) = 21.34, p < 0.001, normalized values, two-way ANOVA; Fig. 4G). These results show that reduced sleep time is correlative with increased c-fos expression and suggest that the ablation of HCRT neurons cause increased sensitivity to MSD.
Ablation of HCRT neurons alters behavioral response to external stimuli
Taking into account that cataplexy is triggered by external cues, such as food and emotions (Nishino and Sakurai, 2006), and our finding that HCRT neurons are important regulators during behavioral-state transitions, we hypothesized that HCRT neuron-ablated larvae may exhibit altered responses to sudden changes of external stimuli. This assumption was strengthened after close observation of the peak of activity at ZT14 (light-to-dark transition; Fig. 5A' representing high-resolution analysis of 20 min period that flanked ZT14 in Fig. 5A). Interestingly, HCRT neuron-ablated larvae significantly increased their activity during this transition period (t(218) = −3.44, p < 0.01, Student's t test; Fig. 5A,A'). To test the response of HCRT neuron-ablated larvae to external stimuli, we treated both Tg(hcrt:nfsB-EGFP) and WT-sibling larvae with MET. We then exposed the larvae to three cycles of alternating 30 min periods of light and darkness during the day (ZT4.5–ZT7.5) and night (ZT15–ZT18). During the day, the larvae responded to dark stimuli with increased locomotor activity, as was previously shown (Prober et al., 2006; Emran et al., 2008), and both HCRT neuron-ablated and WT-siblings demonstrated similar responses (data not shown). During the night, both genotypes responded with a burst of activity after light-to-dark and dark-to-light transitions and maintained similar baseline activity in the dark phase. However, when exposed to 30 min of light, HCRT neuron-ablated larvae were 67% more active compared with their WT siblings (WT: 0.39 ± 0.09 cm/min; HCRT neuron-ablated: 1.2 ± 0.3 cm/min; F(1,138) = 8.94, p < 0.01, repeated-measures ANOVA; Fig. 5B,C). We next analyzed the average median activity during each dark and light period. Median activity better represents the ongoing activity level, as bursts of activity after light/dark transitions have a smaller effect on the median than on the average values (Fig. 5C). Surprisingly, during the light period, WT-sibling larvae reduced their median activity by 39% compared with the dark period (dark: 0.64 ± 0.1 cm/min; light: 0.39 ± 0.09 cm/min; F(1,65) = 4.42, p < 0.05, repeated-measures ANOVA; Fig. 5C). In contrast, HCRT neuron-ablated larvae displayed an opposite reaction and increased their activity by 53% during the light period (dark: 0.57 ± 0.06 cm/min; light: 1.2 ± 0.3 cm/min; F(1,73) = 7.16, p < 0.01, repeated-measures ANOVA; Fig. 5C). These opposite reactions to light stimuli are clearly shown when comparing the difference in activity between the light and dark phase for HCRT neuron-ablated versus WT-sibling larvae (F(1,138) = 10.32, p < 0.01, repeated-measures ANOVA; Fig. 5D). Notably, this tendency was repeated in all three light/dark cycles (Fig. 5D). Altogether, these results show that exposure to light during the night triggers an increase, rather than the expected decrease, of locomotor activity in HCRT neuron-ablated larvae. These findings suggest that HCRT neurons mediate the behavioral response to external stimuli such as light.
Figure 5.

Ablation of HCRT neurons alters locomotor activity response to external light stimulus. Locomotor activity was recorded in 6 dpf Tg(hcrt:nfsB-EGFP) and WT-sibling larvae that were treated with MET (A-D, white and black bars represent light and dark periods, respectively). The rhythmic locomotor activity of HCRT neuron-ablated and WT-siblings over 24 h in 1 min bin resolution (A). Rectangle marks 20 min of activity that flanked ZT14 (A'). Note that HCRT neuron-ablated larvae increased their activity after light-to-dark transition (p < 0.001, Student's t test). Recording of light/dark transition assay was performed during 3 h under alternating 30 min periods of light and darkness between ZT15–ZT18 (B). Note the increased activity of HCRT neuron-ablated larvae (n = 74) under 30 min of light compared with WT-siblings (n = 66; p < 0.01, repeated-measures ANOVA). Analysis of median value (C) reveals that WT-sibling larvae reduced their activity (p < 0.05, repeated-measures ANOVA), while HCRT neuron-ablated larvae increased their activity (p < 0.01, repeated-measures ANOVA) under the light stimuli. This opposite response is presented more clearly by comparing the difference (Δ) between light and dark periods in both genotypes (p < 0.01, repeated-measures ANOVA; D). Different letters represent statistically significant differences. Values are represented as means ± SEM.
Since HCRT neuron-ablated larvae demonstrated an altered locomotor response to light stimuli, we asked whether this effect is light-specific. To further investigate the behavioral response to a different external stimulus, we exposed the larvae to 30 min of sound (110 dB) during the day (ZT4.5–ZT6) and the night (ZT15–ZT16.5) (for the detailed protocol, see Materials and Methods, above; Fig. 6A). During the night, neither HCRT neuron-ablated nor WT-siblings were affected by sound, and both maintained their low baseline activity (data not shown). During the daytime, both genotypes demonstrated similar baseline locomotor activity in the first 30 min of silence (Fig. 6B). During the following 30 min, when the sound was on, both WT-sibling and HCRT neuron-ablated larvae reduced their activity (WT-silence: 4.59 ± 0.48 cm/min; sound: 2.47 ± 0.36 cm/min; F(1,47) = 43.12, p < 0.001; HCRT neuron-ablated-silence: 4.75 ± 0.56 cm/min; sound: 3.79 ± 0.52 cm/min; F(1,47) = 7.93, p < 0.05, repeated-measures ANOVA; Fig. 6B,C). Notably, HCRT neuron-ablated larvae were found to be less sensitive to the sound effect and showed a 20% reduction in their activity compared with 46% in the WT-sibling larvae. During the next 30 min of the silence period, both HCRT neuron-ablated and WT-sibling larvae recovered their activity by 20% and 28%, respectively (WT-sound: 2.47 ± 0.36; silence: 3.43 ± 0.34 cm/min; F(1,47) = 10.90, p < 0.01; HCRT neuron-ablated-sound: 3.79 ± 0.52 cm/min; silence: 4.77 ± 0.55 cm/min; F(1,47) = 9.94, p < 0.01, repeated-measures ANOVA; Fig. 6C). These results demonstrate hyposensitivity of the HCRT neuron-ablated larvae to sound and suggest that HCRT neurons are involved in the mechanism that mediates locomotor response to external sensory input. Taking into account the altered response of HCRT neuron-ablated larvae to light, we suggest that HCRT neurons mediate behavioral state transitions in response to external inputs.
Discussion
Soon after the discovery of HCRT neurons (de Lecea et al., 1998; Sakurai et al., 1998), an important function became apparent; balancing of the sleep/wake switch (Saper et al., 2005). Indeed, the role of HCRT neurons in regulating sleep/wake transitions is most apparent in humans with narcolepsy. These patients suffer from frequent transitions between states of sleep and wakefulness during both day and night. In rodents, in vivo optogenetic experiments have demonstrated that HCRT activity is most important in sleep-to-wake transitions (Adamantidis et al., 2007) and selective loss of GABA receptors in HCRT neurons causes sleep and wake fragmentation (Matsuki et al., 2009). Our findings in zebrafish further dissect the role of HCRT neurons in regulating sleep and wake and show that these neurons integrate external stimuli to control behavioral-state transitions.
We established a transgenic zebrafish that expresses a toxin in HCRT neurons, enabling specific neuron elimination. This fish provides an inducible and robust genetic model of narcolepsy. Unlike other models that specifically target the hcrt and hcrtr genes (Prober et al., 2006; Yokogawa et al., 2007), in the HCRT neuron-ablated fish, as in the case of humans, not only is the HCRT system abolished, but a battery of HCRT neuron-specific genes are eliminated as well. The HCRT neuron-ablated fish display normal diurnal rhythms of activity and are more active during the day than they are at night. Similarly, the locomotor activity of human narcoleptic patients is also not affected (Nishino and Sakurai, 2006). However, HCRT-neuron elimination causes an increase in sleep time during the day and an increase in the number of sleep/wake transitions during both day and night. These results support the role of HCRT in consolidating both sleep and wakefulness. Thus, we suggest that the activity of HCRT neurons is most important during sleep/wake transitions throughout the day and night. Indeed, neuroluminescence generated by zebrafish HCRT neurons is associated with periods of increased locomotor activity and is most frequent during light/dark transitions (Naumann et al., 2010). How the zebrafish HCRT neurons regulate sleep/wake transitions is still not clear. In mammals, the HCRT neurons are part of the balance system between sleep and wake states. These neurons excite arousal nuclei, such as the locus ceruleus, the tuberomammillary nucleus, and the raphe nucleus, and are regulated by the sleep-promoting ventrolateral preoptic area. Loss of HCRT neurons impairs the balance between the sleep and wake nuclei (Saper et al., 2005; Carter et al., 2009; Sakurai and Mieda, 2011). Similarly, in zebrafish, HCRT neurons may regulate both arousal and sleep nuclei (Appelbaum et al., 2009; Panula, 2010), and loss of HCRT neurons results in sleep and wake fragmentations. Altogether, these data strongly suggest that the HCRT neuronal network regulates behavioral state transitions such as wake and sleep. This function is mediated by HCRT neuropeptides but probably also by other HCRT neuron-specific factors.
Loss of HCRT neurons is responsible for narcolepsy in humans, and mutations in hcrtr2 are linked to similar symptoms in genetically narcoleptic dogs (Lin et al., 1999; Peyron et al., 2000). However, the effect of HCRT-neuron elimination on gene expression in HCRT neuronal targets and on the function of downstream sleep and wake regulatory circuits is still not clear. Our gene-quantification experiments showed that the level of hcrtr expression increases in HCRT neuron-ablated fish. These results suggest a compensatory mechanism in which hcrtr levels increase in response to the absence of HCRT-neuron innervations. Furthermore, altered expression of hcrtr may hint at functional dysregulation in HCRT-targeted neurons, which leads to the observed behavioral phenotype. Indeed, complex alterations in downstream cholinergic, histaminergic, adrenergic, and monoaminergic neuronal systems are a feature of narcolepsy in mammals (Nishino and Mignot, 1997; Nishino et al., 2001). These changes may result from a compensatory increase in the expression of the hcrtrs (hcrtr1 and hcrtr2), although normal hcrtr mRNA levels were found in hcrt knock-out mice (Willie et al., 2003). In contrast to the knock-out model, ablation of the entire set of HCRT neuron-specific genes may result in a different and even stronger effect on hcrtr expression. This hypothesis is supported by experiments on rodents, in which the acute administration of HCRT peptide in HCRT neuron-ablated mice increased the arousal effects of HCRT and rescued the narcolepsy phenotype, which is potentially mediated by increased expression of hcrtrs (Mieda et al., 2004). These observations suggest that even in the absence of HCRT neurons in mice and zebrafish, downstream neuronal targets that express hcrtr are intact and may increase their sensitivity to HCRT signaling. Since we found an elevation of hcrtr expression in HCRT neuron-ablated zebrafish larvae immediately and 3 d after neuron ablation, a high level of hcrtr expression might be an acute marker for the loss of HCRT neurons in early stages of the disease.
To control behavior-state transitions, the HCRT neurons should be able to sense and integrate external stimuli. We found that relatively short and repetitive bursts of light affect HCRT neuron-mediated activity transitions. During the night, when zebrafish sleep, exposure to half an hour of light reduced the average median activity of WT larvae. This behavior is intriguing, as short light or dark pulse is known to trigger a brief elevation in motor activity, known as escape-response, in young zebrafish larvae (Van Epps et al., 2001; Prober et al., 2006; Emran et al., 2008; Colwill and Creton, 2011). Similarly, we observed an increase in activity immediately after light-on; however, it lasted for only a few minutes and was then followed by a return to lower-than-baseline activity under half an hour of light. The reduced activity may be associated with freezing, a trademark of fear- and anxiety-like behavior in zebrafish larvae (Colwill and Creton, 2011). Another explanation could be that, after a short burst of activity, larvae return to sleep under light. This last scenario seems unlikely, since zebrafish are highly sensitive to light, which masks sleep behavior in adults (Yokogawa et al., 2007), and are not expected to sleep more under light than under dark conditions during the night. In contrast to WT larvae, HCRT neuron-ablated larvae demonstrated an opposite response to light stimuli. Surprisingly, under half an hour of light, HCRT neuron-ablated larvae increased their activity above baseline. Since these larvae display fragmented sleep and are more alert during the night, they might be less affected by unexpected light and capable of maintaining increase activity. This notion is supported by our MSD experiments because, in contrast to WT-sibling, HCRT neuron-ablated larvae reduced sleep time following MSD during the night. An alternative intriguing explanation may involve a direct role of HCRT neurons in mediating fear and anxiety. Accordingly, in the absence of HCRT neurons, larvae do not reduce activity and freeze in response to brief light illumination during the night. The neuronal pathway by which HCRT neurons regulate behavior in response to fear and anxiety may include the amygdala and the paraventricular nucleus (PVN). In mammals, the HCRT neurons receive abundant projections from the amygdala (Winsky-Sommerer et al., 2004; Zhang et al., 2009; Sakurai and Mieda, 2011), a key component of the fear response pathway, and innervate the PVN (Peyron et al., 1998), which regulates stress and anxiety via the hypothalamic-pituitary-adrenal axis. In agreement with this idea, in HCRT knock-out and HCRT neuron-ablated transgenic mice, emotional stresses generate attenuated responses of locomotor activity, as well as blood pressure, heart rate, and cardiorespiratory responses (Kayaba et al., 2003; Furlong et al., 2009; Zhang et al., 2009). In zebrafish, we found that deficiency in the response to external stimuli is not specific to light and was also observed in the larvae reaction to sound stimuli. While WT larvae significantly reduced their activity in response to sound during the day, HCRT neuron-ablated larvae were less sensitive and only mildly reduced their locomotor activity. Thus, in the absence of HCRT neurons, the ability of the larvae to perform sound-dependent behavioral-state transitions was significantly reduced. Considering their altered and opposite response to light during the night, we suggest that HCRT neurons mediate transition of locomotor activity in response to external stimuli.
This study establishes the HCRT neuron-ablated zebrafish as a high-throughput vertebrate model for understanding the diverse function of HCRT neurons and the mechanism that regulate sleep, wake, and narcolepsy. Using this model, we found that HCRT neurons regulate sleep and wake states and integrate external stimuli to control behavioral-state transitions during both day and night. Loss of HCRT neuropeptides and other unknown HCRT neuron-specific genes may lead to abnormal function of the sleep and wake regulatory systems that regulate narcolepsy. In future studies, there is a need to identify additional HCRT neuron-specific genes and genes with altered expression after neuron ablation to obtain a more complete picture of the molecular mechanism and circuits that regulate sleep/wake cycle and narcolepsy. Finally, an important future direction will be to understand the neuroanatomical and functional similarities and differences between zebrafish and mammals and to ultimately translate these findings into large-scale pharmacological screens for the development of therapeutic drugs for sleep disorders in humans.
Footnotes
This work was supported by the Legacy Heritage biomedical program of the Israel Science Foundation (Grant 398/11) and by a Marie Curie International Reintegration Grant (274333). We thank Dr. Rachel Levy-Drummer, Head of the Biostatistics Unit, Faculty of Life Sciences, Bar-Ilan University, and Ms. Ilana Gelenter, School of Mathematics, Tel Aviv University, for performing statistical analyses of the data. We thank Dr. Liran Carmel for statistical recommendations. Thanks also to Dr. Karina Yaniv for her expertise and assistance in confocal imaging; and to Dr. Tali Lerer, Adi Shamay, Prof. Yoav Gothilf, Dr. Luis de Lecea, and Dr. Philippe Mourrain for the technical assistance and helpful comments on the manuscript. We thank Shelley Schwarzbaum and Sharon Victor for assistance in editing the manuscript.
The authors declare no financial conflicts of interest.
References
- Adamantidis AR, Zhang F, Aravanis AM, Deisseroth K, de Lecea L. Neural substrates of awakening probed with optogenetic control of hypocretin neurons. Nature. 2007;450:420–424. doi: 10.1038/nature06310. [DOI] [PMC free article] [PubMed] [Google Scholar]
- Appelbaum L, Wang GX, Maro GS, Mori R, Tovin A, Marin W, Yokogawa T, Kawakami K, Smith SJ, Gothilf Y, Mignot E, Mourrain P. Sleep-wake regulation and hypocretin-melatonin interaction in zebrafish. Proc Natl Acad Sci U S A. 2009;106:21942–21947. doi: 10.1073/pnas.906637106. [DOI] [PMC free article] [PubMed] [Google Scholar]
- Appelbaum L, Wang G, Yokogawa T, Skariah GM, Smith SJ, Mourrain P, Mignot E. Circadian and homeostatic regulation of structural synaptic plasticity in hypocretin neurons. Neuron. 2010;68:87–98. doi: 10.1016/j.neuron.2010.09.006. [DOI] [PMC free article] [PubMed] [Google Scholar]
- Berman JR, Skariah G, Maro GS, Mignot E, Mourrain P. Characterization of two melanin-concentrating hormone genes in zebrafish reveals evolutionary and physiological links with the mammalian MCH system. J Comp Neurol. 2009;517:695–710. doi: 10.1002/cne.22171. [DOI] [PMC free article] [PubMed] [Google Scholar]
- Bonnavion P, de Lecea L. Hypocretins in the control of sleep and wakefulness. Curr Neurol Neurosci Rep. 2010;10:174–179. doi: 10.1007/s11910-010-0101-y. [DOI] [PubMed] [Google Scholar]
- Cahill GM, Hurd MW, Batchelor MM. Circadian rhythmicity in the locomotor activity of larval zebrafish. Neuroreport. 1998;9:3445–3449. doi: 10.1097/00001756-199810260-00020. [DOI] [PubMed] [Google Scholar]
- Carter ME, Adamantidis A, Ohtsu H, Deisseroth K, de Lecea L. Sleep homeostasis modulates hypocretin-mediated sleep-to-wake transitions. J Neurosci. 2009;29:10939–10949. doi: 10.1523/JNEUROSCI.1205-09.2009. [DOI] [PMC free article] [PubMed] [Google Scholar]
- Chemelli RM, Willie JT, Sinton CM, Elmquist JK, Scammell T, Lee C, Richardson JA, Williams SC, Xiong Y, Kisanuki Y, Fitch TE, Nakazato M, Hammer RE, Saper CB, Yanagisawa M. Narcolepsy in orexin knockout mice: molecular genetics of sleep regulation. Cell. 1999;98:437–451. doi: 10.1016/s0092-8674(00)81973-x. [DOI] [PubMed] [Google Scholar]
- Cirelli C, Tononi G. On the functional significance of c-fos induction during the sleep-waking cycle. Sleep. 2000;23:453–469. [PubMed] [Google Scholar]
- Colwill RM, Creton R. Imaging escape and avoidance behavior in zebrafish larvae. Rev Neurosci. 2011;22:63–73. doi: 10.1515/RNS.2011.008. [DOI] [PMC free article] [PubMed] [Google Scholar]
- Curado S, Stainier DY, Anderson RM. Nitroreductase-mediated cell/tissue ablation in zebrafish: a spatially and temporally controlled ablation method with applications in developmental and regeneration studies. Nat Protoc. 2008;3:948–954. doi: 10.1038/nprot.2008.58. [DOI] [PMC free article] [PubMed] [Google Scholar]
- de Lecea L, Kilduff TS, Peyron C, Gao X, Foye PE, Danielson PE, Fukuhara C, Battenberg EL, Gautvik VT, Bartlett FS, 2nd, Frankel WN, van den Pol AN, Bloom FE, Gautvik KM, Sutcliffe JG. The hypocretins: hypothalamus-specific peptides with neuroexcitatory activity. Proc Natl Acad Sci U S A. 1998;95:322–327. doi: 10.1073/pnas.95.1.322. [DOI] [PMC free article] [PubMed] [Google Scholar]
- Emran F, Rihel J, Dowling JE. A behavioral assay to measure responsiveness of zebrafish to changes in light intensities. J Vis Exp. 2008;2008:923. doi: 10.3791/923. pii. [DOI] [PMC free article] [PubMed] [Google Scholar]
- Faraco JH, Appelbaum L, Marin W, Gaus SE, Mourrain P, Mignot E. Regulation of hypocretin (orexin) expression in embryonic zebrafish. J Biol Chem. 2006;281:29753–29761. doi: 10.1074/jbc.M605811200. [DOI] [PubMed] [Google Scholar]
- Furlong TM, Vianna DM, Liu L, Carrive P. Hypocretin/orexin contributes to the expression of some but not all forms of stress and arousal. Eur J Neurosci. 2009;30:1603–1614. doi: 10.1111/j.1460-9568.2009.06952.x. [DOI] [PubMed] [Google Scholar]
- Hara J, Beuckmann CT, Nambu T, Willie JT, Chemelli RM, Sinton CM, Sugiyama F, Yagami K, Goto K, Yanagisawa M, Sakurai T. Genetic ablation of orexin neurons in mice results in narcolepsy, hypophagia, and obesity. Neuron. 2001;30:345–354. doi: 10.1016/s0896-6273(01)00293-8. [DOI] [PubMed] [Google Scholar]
- Hara J, Yanagisawa M, Sakurai T. Difference in obesity phenotype between orexin-knockout mice and orexin neuron-deficient mice with same genetic background and environmental conditions. Neurosci Lett. 2005;380:239–242. doi: 10.1016/j.neulet.2005.01.046. [DOI] [PubMed] [Google Scholar]
- Hendricks JC, Sehgal A, Pack AI. The need for a simple animal model to understand sleep. Prog Neurobiol. 2000;61:339–351. doi: 10.1016/s0301-0082(99)00048-9. [DOI] [PubMed] [Google Scholar]
- Kaslin J, Nystedt JM, Ostergård M, Peitsaro N, Panula P. The orexin/hypocretin system in zebrafish is connected to the aminergic and cholinergic systems. J Neurosci. 2004;24:2678–2689. doi: 10.1523/JNEUROSCI.4908-03.2004. [DOI] [PMC free article] [PubMed] [Google Scholar]
- Kawakami K. Transgenesis and gene trap methods in zebrafish by using the Tol2 transposable element. In: Detrich HW III, Westerfield M, Zon LI, editors. Methods in cell biology. Waltham, MA: Academic; 2004. pp. 201–222. [DOI] [PubMed] [Google Scholar]
- Kayaba Y, Nakamura A, Kasuya Y, Ohuchi T, Yanagisawa M, Komuro I, Fukuda Y, Kuwaki T. Attenuated defense response and low basal blood pressure in orexin knockout mice. Am J Physiol Regul Integr Comp Physiol. 2003;285:R581–R593. doi: 10.1152/ajpregu.00671.2002. [DOI] [PubMed] [Google Scholar]
- Lin L, Faraco J, Li R, Kadotani H, Rogers W, Lin X, Qiu X, de Jong PJ, Nishino S, Mignot E. The sleep disorder canine narcolepsy is caused by a mutation in the hypocretin (orexin) receptor 2 gene. Cell. 1999;98:365–376. doi: 10.1016/s0092-8674(00)81965-0. [DOI] [PubMed] [Google Scholar]
- Matsuki T, Nomiyama M, Takahira H, Hirashima N, Kunita S, Takahashi S, Yagami K, Kilduff TS, Bettler B, Yanagisawa M, Sakurai T. Selective loss of GABA(B) receptors in orexin-producing neurons results in disrupted sleep/wakefulness architecture. Proc Natl Acad Sci U S A. 2009;106:4459–4464. doi: 10.1073/pnas.0811126106. [DOI] [PMC free article] [PubMed] [Google Scholar]
- Mieda M, Willie JT, Hara J, Sinton CM, Sakurai T, Yanagisawa M. Orexin peptides prevent cataplexy and improve wakefulness in an orexin neuron-ablated model of narcolepsy in mice. Proc Natl Acad Sci U S A. 2004;101:4649–4654. doi: 10.1073/pnas.0400590101. [DOI] [PMC free article] [PubMed] [Google Scholar]
- Montgomery JE, Parsons MJ, Hyde DR. A novel model of retinal ablation demonstrates that the extent of rod cell death regulates the origin of the regenerated zebrafish rod photoreceptors. J Comp Neurol. 2010;518:800–814. doi: 10.1002/cne.22243. [DOI] [PMC free article] [PubMed] [Google Scholar]
- Naumann EA, Kampff AR, Prober DA, Schier AF, Engert F. Monitoring neural activity with bioluminescence during natural behavior. Nat Neurosci. 2010;13:513–520. doi: 10.1038/nn.2518. [DOI] [PMC free article] [PubMed] [Google Scholar]
- Nishino S, Mignot E. Pharmacological aspects of human and canine narcolepsy. Prog Neurobiol. 1997;52:27–78. doi: 10.1016/s0301-0082(96)00070-6. [DOI] [PubMed] [Google Scholar]
- Nishino S, Sakurai T. The orexin/hypocretin system: physiology and pathophysiology. Towota, NJ: Humana; 2006. [Google Scholar]
- Nishino S, Fujiki N, Ripley B, Sakurai E, Kato M, Watanabe T, Mignot E, Yanai K. Decreased brain histamine content in hypocretin/orexin receptor-2 mutated narcoleptic dogs. Neurosci Lett. 2001;313:125–128. doi: 10.1016/s0304-3940(01)02270-4. [DOI] [PubMed] [Google Scholar]
- Panula P. Hypocretin/orexin in fish physiology with emphasis on zebrafish. Acta Physiol (Oxf) 2010;198:381–386. doi: 10.1111/j.1748-1716.2009.02038.x. [DOI] [PubMed] [Google Scholar]
- Peyron C, Tighe DK, van den Pol AN, de Lecea L, Heller HC, Sutcliffe JG, Kilduff TS. Neurons containing hypocretin (orexin) project to multiple neuronal systems. J Neurosci. 1998;18:9996–10015. doi: 10.1523/JNEUROSCI.18-23-09996.1998. [DOI] [PMC free article] [PubMed] [Google Scholar]
- Peyron C, Faraco J, Rogers W, Ripley B, Overeem S, Charnay Y, Nevsimalova S, Aldrich M, Reynolds D, Albin R, Li R, Hungs M, Pedrazzoli M, Padigaru M, Kucherlapati M, Fan J, Maki R, Lammers GJ, Bouras C, Kucherlapati R, Nishino S, Mignot E. A mutation in a case of early onset narcolepsy and a generalized absence of hypocretin peptides in human narcoleptic brains. Nat Med. 2000;6:991–997. doi: 10.1038/79690. [DOI] [PubMed] [Google Scholar]
- Pisharath H, Parsons MJ. Nitroreductase-mediated cell ablation in transgenic zebrafish embryos. Methods Mol Biol. 2009;546:133–143. doi: 10.1007/978-1-60327-977-2_9. [DOI] [PubMed] [Google Scholar]
- Pisharath H, Rhee JM, Swanson MA, Leach SD, Parsons MJ. Targeted ablation of beta cells in the embryonic zebrafish pancreas using E. coli nitroreductase. Mech Dev. 2007;124:218–229. doi: 10.1016/j.mod.2006.11.005. [DOI] [PMC free article] [PubMed] [Google Scholar]
- Prober DA, Rihel J, Onah AA, Sung RJ, Schier AF. Hypocretin/orexin overexpression induces an insomnia-like phenotype in zebrafish. J Neurosci. 2006;26:13400–13410. doi: 10.1523/JNEUROSCI.4332-06.2006. [DOI] [PMC free article] [PubMed] [Google Scholar]
- Raizen DM, Zimmerman JE, Maycock MH, Ta UD, You YJ, Sundaram MV, Pack AI. Lethargus is a Caenorhabditis elegans sleep-like state. Nature. 2008;451:569–572. doi: 10.1038/nature06535. [DOI] [PubMed] [Google Scholar]
- Rihel J, Prober DA, Schier AF. Monitoring sleep and arousal in zebrafish. Methods Cell Biol. 2010;100:281–294. doi: 10.1016/B978-0-12-384892-5.00011-6. [DOI] [PubMed] [Google Scholar]
- Sakurai T. The neural circuit of orexin (hypocretin): maintaining sleep and wakefulness. Nat Rev Neurosci. 2007;8:171–181. doi: 10.1038/nrn2092. [DOI] [PubMed] [Google Scholar]
- Sakurai T, Mieda M. Connectomics of orexin-producing neurons: interface of systems of emotion, energy homeostasis and arousal. Trends Pharmacol Sci. 2011;32:451–462. doi: 10.1016/j.tips.2011.03.007. [DOI] [PubMed] [Google Scholar]
- Sakurai T, Amemiya A, Ishii M, Matsuzaki I, Chemelli RM, Tanaka H, Williams SC, Richarson JA, Kozlowski GP, Wilson S, Arch JR, Buckingham RE, Haynes AC, Carr SA, Annan RS, McNulty DE, Liu WS, Terrett JA, Elshourbagy NA, Bergsma DJ, Yanagisawa M. Orexins and orexin receptors: a family of hypothalamic neuropeptides and G protein-coupled receptors that regulate feeding behavior. Cell. 1998;92 doi: 10.1016/s0092-8674(02)09256-5. 1 page following 696. [DOI] [PubMed] [Google Scholar]
- Saper CB, Scammell TE, Lu J. Hypothalamic regulation of sleep and circadian rhythms. Nature. 2005;437:1257–1263. doi: 10.1038/nature04284. [DOI] [PubMed] [Google Scholar]
- Schmittgen TD, Livak KJ. Analyzing real-time PCR data by the comparative C(T) method. Nat Protoc. 2008;3:1101–1108. doi: 10.1038/nprot.2008.73. [DOI] [PubMed] [Google Scholar]
- Sehgal A, Mignot E. Genetics of sleep and sleep disorders. Cell. 2011;146:194–207. doi: 10.1016/j.cell.2011.07.004. [DOI] [PMC free article] [PubMed] [Google Scholar]
- Shaw PJ, Cirelli C, Greenspan RJ, Tononi G. Correlates of sleep and waking in Drosophila melanogaster. Science. 2000;287:1834–1837. doi: 10.1126/science.287.5459.1834. [DOI] [PubMed] [Google Scholar]
- Siegel JM. Clues to the functions of mammalian sleep. Nature. 2005;437:1264–1271. doi: 10.1038/nature04285. [DOI] [PMC free article] [PubMed] [Google Scholar]
- Sigurgeirsson B, Thornorsteinsson H, Arnardóttir H, Jóhannesdottir IT, Karlsson KA. Effects of modafinil on sleep-wake cycles in larval zebrafish. Zebrafish. 2011;8:133–140. doi: 10.1089/zeb.2011.0708. [DOI] [PubMed] [Google Scholar]
- Van Epps HA, Yim CM, Hurley JB, Brockerhoff SE. Investigations of photoreceptor synaptic transmission and light adaptation in the zebrafish visual mutant nrc. Invest Ophthalmol Vis Sci. 2001;42:868–874. [PubMed] [Google Scholar]
- Willie JT, Chemelli RM, Sinton CM, Tokita S, Williams SC, Kisanuki YY, Marcus JN, Lee C, Elmquist JK, Kohlmeier KA, Leonard CS, Richardson JA, Hammer RE, Yanagisawa M. Distinct narcolepsy syndromes in orexin receptor-2 and orexin null mice: molecular genetic dissection of non-REM and REM sleep regulatory processes. Neuron. 2003;38:715–730. doi: 10.1016/s0896-6273(03)00330-1. [DOI] [PubMed] [Google Scholar]
- Winsky-Sommerer R, Yamanaka A, Diano S, Borok E, Roberts AJ, Sakurai T, Kilduff TS, Horvath TL, de Lecea L. Interaction between the corticotropin-releasing factor system and hypocretins (orexins): a novel circuit mediating stress response. J Neurosci. 2004;24:11439–11448. doi: 10.1523/JNEUROSCI.3459-04.2004. [DOI] [PMC free article] [PubMed] [Google Scholar]
- Yokogawa T, Marin W, Faraco J, Pézeron G, Appelbaum L, Zhang J, Rosa F, Mourrain P, Mignot E. Characterization of sleep in zebrafish and insomnia in hypocretin receptor mutants. PLoS Biol. 2007;5:e277. doi: 10.1371/journal.pbio.0050277. [DOI] [PMC free article] [PubMed] [Google Scholar]
- Zhang W, Zhang N, Sakurai T, Kuwaki T. Orexin neurons in the hypothalamus mediate cardiorespiratory responses induced by disinhibition of the amygdala and bed nucleus of the stria terminalis. Brain Res. 2009;1262:25–37. doi: 10.1016/j.brainres.2009.01.022. [DOI] [PubMed] [Google Scholar]
- Zhao XF, Ellingsen S, Fjose A. Labelling and targeted ablation of specific bipolar cell types in the zebrafish retina. BMC Neurosci. 2009;10:107. doi: 10.1186/1471-2202-10-107. [DOI] [PMC free article] [PubMed] [Google Scholar]
- Zhdanova IV. Sleep and its regulation in zebrafish. Rev Neurosci. 2011;22:27–36. doi: 10.1515/RNS.2011.005. [DOI] [PubMed] [Google Scholar]
- Zhdanova IV, Wang SY, Leclair OU, Danilova NP. Melatonin promotes sleep-like state in zebrafish. Brain Res. 2001;903:263–268. doi: 10.1016/s0006-8993(01)02444-1. [DOI] [PubMed] [Google Scholar]
- Zimmerman JE, Naidoo N, Raizen DM, Pack AI. Conservation of sleep: insights from non-mammalian model systems. Trends Neurosci. 2008;31:371–376. doi: 10.1016/j.tins.2008.05.001. [DOI] [PMC free article] [PubMed] [Google Scholar]