

Abstract
Applying graph theoretical analysis of spontaneous BOLD fluctuations in functional magnetic resonance imaging (fMRI), we investigated whole-brain functional connectivity of 11 healthy volunteers during wakefulness and propofol-induced loss of consciousness (PI-LOC). After extraction of regional fMRI time series from 110 cortical and subcortical regions, we applied a maximum overlap discrete wavelet transformation and investigated changes in the brain's intrinsic spatiotemporal organization. During PI-LOC, we observed a breakdown of subcortico-cortical and corticocortical connectivity. Decrease of connectivity was pronounced in thalamocortical connections, whereas no changes were found for connectivity within primary sensory cortices. Graph theoretical analyses revealed significant changes in the degree distribution and local organization metrics of brain functional networks during PI-LOC: compared with a random network, normalized clustering was significantly increased, as was small-worldness. Furthermore we observed a profound decline in long-range connections and a reduction in whole-brain spatiotemporal integration, supporting a topological reconfiguration during PI-LOC. Our findings shed light on the functional significance of intrinsic brain activity as measured by spontaneous BOLD signal fluctuations and help to understand propofol-induced loss of consciousness.
Introduction
The majority of the brain's energy consumption is associated with metabolism inherent to intrinsic neuronal activity (Ames, 2000). Intrinsic brain activity, as reflected in spontaneous slow fluctuations in BOLD signals in functional magnetic resonance imaging (fMRI), has been proposed to provide important clues on brain organization (Fox and Raichle, 2007) and mapping of its spatiotemporal correlation structure seems a promising approach to assess basic properties of brain function (Biswal et al., 2010). Patterns of coherent signal fluctuations in fMRI have been associated with large-scale functional brain networks (Biswal et al., 1995; Cordes et al., 2001; Greicius et al., 2003; Fox et al., 2006; Seeley et al., 2007) and suggested to contribute to variability in human behavioral task-performance and perception (Hampson et al., 2006; Fox et al., 2007).
Recent research has probed the functional significance of intrinsic brain activity to explain altered states of consciousness. Positron-emission tomography (PET) studies reported decreases in global brain metabolism throughout non-rapid eye movement (NREM) sleep (Braun et al., 1997) and in pharmacologically modulated (Alkire et al., 1995; Fiset et al., 1999) and pathologically altered states of consciousness (Laureys et al., 2004). For hypnotic anesthetics, such as propofol, hypometabolism during loss of consciousness was reported for parts of the ascending reticular activation system, in particular thalamus, the association cortices, such as posterior cingulate cortex (PCC), and frontoparietal cortices (Kaisti et al., 2003). Since findings overlap largely with metabolic decreases during NREM sleep, anesthesia and sleep have been suggested to share some common functional circuits to induce loss of consciousness (Lydic and Baghdoyan, 2005).
But how does the organization of large-scale functional networks change during propofol-induced loss of consciousness (PI-LOC)? While early fMRI studies of BOLD signal fluctuations across levels of consciousness reported persistent intrinsic activity and relatively preserved spatial organization during light sleep and sedation (Greicius et al., 2008; Horovitz et al., 2008; Larson-Prior et al., 2009), recent studies point to a state-dependent modulation: during propofol-anesthesia, a linear association between functional connectivity of frontoparietal networks and levels of consciousness (Boveroux et al., 2010), a reorganization of key nodes of the default mode network (Stamatakis et al., 2010), and decreased subcortical-cortical connectivity have been reported (Mhuircheartaigh et al., 2010). State-dependent changes in functional connectivity have also been observed during deep NREM sleep (Horovitz et al., 2009; Sämann et al., 2011). How these findings relate to recent models of spontaneous brain activity and conscious processing (Dehaene and Changeux, 2005) or information integration (Tononi, 2004) has yet to be tested systematically.
Assuming potential similarities between some physiologic characteristics of deep NREM sleep and anesthesia-induced loss of consciousness (Lydic and Baghdoyan, 2005) and motivated by previous observations of state-dependent connectivity changes during NREM sleep (Spoormaker et al., 2010), we applied graph theory to investigate changes in topological properties of whole-brain functional networks. During PI-LOC, we hypothesized to find reduced functional connectivity strength, particularly of subcortical-cortical connections, and a reduced probability of high-degree hubs. Furthermore, we expected differential changes in brain topology, such as a decrease in spatiotemporal integration and a more insulated pattern of activity, possibly related to a reduction in long-range connections.
Materials and Methods
Subjects.
Fifteen male subjects participated in the study. The study protocol was in accordance with the Declaration of Helsinki and approved by the local ethics committee of the medical department of the Technische Universität München, Germany. All subjects were right-handed, drug-free, and had no history of neurological or psychiatric disorders. Subjects had to give written informed consent and were reimbursed for participation. Individuals with excessive head movements during fMRI scanning (>2 mm between two subsequent EPI images) were excluded, leaving a sample of 11 subjects (mean age ± SD: 25.8 ± 3.0 years). In the present analyses, we focus on changes from wakefulness to PI-LOC.
Sedation protocol.
Propofol [2,6 di-isopropylphenol; (James and Glen, 1980)] is an anesthetic agent that is thought not to interfere with cerebral blood flow response and flow-metabolism coupling (Johnston et al., 2003; Veselis et al., 2005). Propofol acts mainly on GABAA receptors, potentiating GABAergic interneurons in the cortex and enhancing neuronal inhibition (Antkowiak, 1999; Franks, 2008; Brown et al., 2011). The effect depends mainly on the dosage and speed of administration. During simultaneous electroencephalography (EEG) and fMRI, propofol was administered in the scanner using a target controlled infusion (TCI) pump (Open TCI, Space Infusion System; Braun Medical) to obtain constant effect-site concentrations, as estimated by the pharmacokinetic model of Marsh et al. (1991). TCI concentrations were increased in 0.4 μg/ml steps beginning at 1.2 μg/ml until volunteers stopped responding to the verbal command “squeeze my hand” accompanied by a firm handshake [PI-LOC corresponding to a Ramsay sedation scale of 5–6 (Ramsay et al., 1974), i.e., sluggish or no response to tactile or auditory stimulation]. TCI concentration at this point was maintained and kept stable for another 10 min to ensure equilibration of the estimated effect-site concentration. Having reached this equilibrium, simultaneous EEG and fMRI measurements were performed subsequently for ∼10 min. After that, a phase of sedation at 50% of the PI-LOC concentration was recorded; however, movement artifacts prevented a reliable analysis of these fMRI data. Throughout the experiment, standard monitoring parameters, such as breathing frequency, blood pressure, cardiac rhythm, and pulse oxymentry, were measured. Oxygen administration (via nose tube) and expiratory CO2 concentrations were continuously monitored.
EEG analysis.
Nonlinear permutation entropy (PeEn) of EEG electrodes has been established to reliably separate normal wakefulness from PI-LOC (Jordan et al., 2008). PeEn is a measure of the irregularity of signals and is based on a comparison of the neighboring order of signal values (Bandt and Pompe, 2002). It has been shown that PeEn is largely unaffected by signal disturbances and can be used to analyze time series generated by high-dimensional dynamic systems with low stationarity. In the present investigation, we used PeEn as an additional measure to indicate levels of vigilance and to verify the effect of state on brain functional networks. EEG recordings were performed using a 64-channel electrode cap with nonmagnetic Ag/AgCl electrodes (Easycap) and two 32-channel nonmagnetic battery-operated EEG amplifiers (BrainAmp MR; Brain Products) designed for MRI in-scanner measurement. One EEG channel was dedicated to register the electrocardiogram (ECG) and placed over the subject's chest. The resolution of the EEG acquisition system was 100 and 500 nV for ECG and signals were recorded with a sampling rate of 5 kHz (BrainVision Recorder; Brain Products). EEG signal preprocessing was performed with BrainVision Analyzer 2 (Brain Products). Gradient artifacts produced by fMRI were averaged over a sliding window and subtracted from the EEG signals. Cardioballistic artifacts caused by cardiomechanic electrode induction were removed using a template-detection method. Templates were based on detected local maxima (R-peak) of the ECG and subtracted from the EEG using sliding windows of 21 epochs. Basic artifact rejection (EEG with amplitudes exceeding 250 μV), average reference, and independent component analysis for blind source separation of noncortical signal components were computed. Finally, PeEn of 18 frontal EEG electrodes (Fp1–FC6, average reference, total bandwidth 0.5–30 Hz) was calculated.
fMRI acquisition and preprocessing.
Resting-state fMRI recordings were acquired at a 3T MR system (Achieva Quasar Dual; Philips) using an eight-channel phased-array head coil and a gradient echo EPI sequence (TR, 1838 ms; TE, 30 ms; flip angle, 75°; 72 × 72 matrix; FOV, 220 × 220 mm; 32 slices oriented along AC-PC; slice thickness, 3 mm; 1 mm interslice gap; scan duration 10 min). The following fMRI preprocessing steps were performed using SPM (version 5; www.fil.ion.ucl.ac.uk/spm): slice time correction to account for interleaved slice acquisition, realignment to the first image to correct for small head movements, and spatial normalization of all images to a standard EPI template in Montreal Neurological Institute (MNI) standard space. Only scans with head movements <2 mm between two subsequent volumes were accepted, resulting in 200 scans per subject for the final connectivity analysis. Finally, images were resampled to a voxel resolution of 2 × 2 × 2 mm3 using a fifth-degree spline interpolation. To remove unspecific signal variation from the time series, the following regressors were defined in a multiple regression model: six head movement parameters derived from the realignment step (1–6) and global signals within white matter (WM) and ventricular CSF (7–8). Time series for WM and CSF were calculated using 3 mm radius spheres in deep WM and CSF (Chang and Glover, 2009). No global signal removal was applied, since it was observed to suppress meaningful neural activity (Zhang et al., 2008; Schölvinck et al., 2010) and to artificially increase anticorrelations (Chang and Glover, 2009; Weissenbacher et al., 2009). Resultant residual images only contained signals not explained by regressors 1–8 and were used for extraction of regional time courses. To ensure that changes in functional connectivity were not biased by differences in head motion, we compared mean movements of experimental conditions using the root-mean-square of translational parameters (Van Dijk et al., 2012).
Brain parcellation and time course extraction.
Multiple brain atlases were used to extract time series for our connectivity analyses. The main analysis was performed on the Harvard–Oxford Probabilistic Atlas (threshold at 25%), as implemented in FSL [FMRIB Software Library, www.fmrib.ox.ac.uk/fsl (Smith et al., 2004)], which subdivides the brain into 110 cortical and subcortical regions. Regional time series were extracted using the average signal of all voxels inside each region using the Marsbar toolbox (Brett et al., 2002). Time series then underwent a maximum overlap discrete wavelet transform (MODWT) by applying the WMTSA wavelet toolkit (www.atmos.washington.edu/∼wmtsa/) with a Daubechies wavelet (Percival and Walden, 2000). This resulted in four frequency scales [0.13–0.27 Hz (scale 1), 0.07–0.13 Hz (scale 2), 0.03–0.07 Hz (scale 3), and 0.01–0.03 Hz (scale 4)] with frequency-band-specific correlation matrices. To increase comparability with previous studies (Achard et al., 2006; Spoormaker et al., 2010) and to reduce confounds through nonneuronal physiological variations (Birn et al., 2006; Shmueli et al., 2007), we focus our main analyses on frequency band 0.03–0.07 Hz (scale 3). To control for possible effects of brain parcellation (Zalesky et al., 2010), we additionally performed graph analyses on the widely used automatic anatomical labeling (AAL) template (Tzourio-Mazoyer et al., 2002) and a recently proposed functional brain parcellation by Dosenbach et al. (2010), in which all 160 cerebral spheres have the exact same size and do not overlap. To allow comparisons of our analysis with classical resting-state fMRI approaches, we further analyzed the frequency band 0.01–0.10 Hz using a third-order Butterworth filter.
Graph construction.
Graph theoretical analyses were run on binary adjacency matrices A. A is gained by thresholding the weighted matrix M at an individual correlation threshold R, ensuring statistics on graphs with the same number of edges and nodes. Statistical analysis on binary graphs was restricted to a range of thresholds including connection probabilities of 36–50% (1% increments, 15 values in total). This procedure follows the rationale that some networks may become disconnected at lower thresholds (for the present graphs, this was the case for thresholds <36% connection probability) and that network configurations become increasingly unspecific and similar to those of random graphs at very high thresholds [e.g., a connection probability >50% (Humphries and Gurney, 2008)]. Comparable approaches have been applied in previous studies (Achard and Bullmore, 2007; Bassett et al., 2008; Liu et al., 2008; van den Heuvel et al., 2009; Lynall et al., 2010). Network characterizations based on binary networks gained by thresholding approaches are likely to neglect at least some information, such as the role of negative correlations. However, since the biological relevance of anticorrelations in fMRI networks is still under debate (Chang and Glover, 2009; Fox et al., 2009) and relies to some degree on the choice of fMRI preprocessing strategy (Murphy et al., 2009; Weissenbacher et al., 2009; Schwarz and McGonigle, 2011), we ground our main functional network analysis on graphs that are fully connected and maximally sparse (i.e., in the described range of connection probabilities).
Graph theoretical properties.
The following functional connectivity properties were estimated on the weighted matrices M of wavelet correlations r between the time courses of nodes i and j: regional connectivity strength, diversity, and integration. The regional connectivity strength S(i) is the average of all correlations between the ith node and all other nodes in the brain network. Nodal connection diversity D(i) is defined as the column variance over the connectivity strength S(i) of each node i (Campbell et al., 1986; Bassett et al., 2011). Interareal integration I of the functional brain network was estimated by a principal component analysis using the ratio of the first eigenvalue to the sum of all eigenvalues (Lynall et al., 2010). Functional network metrics degree k, clustering coefficient C, path length L, clustering ratio γ, path length ratio λ, and small-worldness σ were estimated for the range of connection probabilities 36–50% on adjacency matrices A: the nodal degree k of a node is the number of edges that link a node to the rest of the network; it is calculated on the adjacency matrix A. The regional clustering coefficient C is a measure of functional segregation, which is calculated by the ratio of the number of edges that exist between direct neighbors of a node and the maximum number of possible connections between these neighbors (Watts and Strogatz, 1998); only nodes with degree ≥2 were considered. Compared with complex networks, random networks are expected to have a lower average clustering. Characteristic path length L of a network is calculated as the harmonic mean of all geodesic distances di,j between node i and j; it measures the average minimum number of steps that must be traversed to get from one node to another (Watts and Strogatz, 1998; Hayasaka and Laurienti, 2010). Path length has been associated to a network's global efficiency (Latora and Marchiori, 2001; Achard and Bullmore, 2007). Finally, small-worldness σ is given by the clustering ratio γ, defined as C/Crandom, and the path length ratio λ, defined as L/Lrandom. A network is assumed to possess small-world organization if γ > 1 and λ ∼ 1, resulting in σ values >1. For λ and γ, average Crandom and Lrandom were computed by applying a Markov chain algorithm to randomize all edges of the original networks while preserving their degree distribution. For each individual brain graph and all thresholds in the chosen range of connection probabilities, 10 randomly rewired matrices were generated (Maslov and Sneppen, 2002; Stam et al., 2007). Graph metrics were calculated with the Brain Connectivity Toolbox [www.brain-connectivity-toolbox.net (Rubinov and Sporns, 2010)]. Small-world organization seems an intuitively attractive model to describe brain networks since it enables segregated information processing in specialized modules as well as globally coordinated integration across the brain (Bassett and Bullmore, 2006). Small-worldness was found on different scales and for different modes of neuronal networks (Bullmore and Sporns, 2009). Dense local clustering of functionally related cortices and relatively sparse global interconnectedness, i.e., a short average path length, is present in functional and structural brain networks (Salvador et al., 2005; Achard et al., 2006; Hagmann et al., 2008). Modeling work supported the advantages of this network topology for efficient information processing (Latora and Marchiori, 2001), learning (Simard et al., 2005), and dynamic adaptivity and emergence of complexity (Sporns and Zwi, 2004).
Subsystem connectivity analysis.
We compared subsystem-specific connectivity changes across wakefulness and PI-LOC by allocating all 110 regions of the Harvard–Oxford Atlas into five major subsystems as proposed by Mesulam (2000): association, limbic, paralimbic, primary sensory, and subcortical regions. Differences in intra-subsystem and inter-subsystem connectivity were computed on the regional MODWT correlation coefficients and grouped into 15 categories containing all possible subsystem interactions (e.g., association–association, association–limbic, association–paralimbic, association–primary, association–subcortical, etc.).
Topography analysis.
We computed differential connection distance during PI-LOC by splitting all MODWT correlation coefficients into two groups according to their Euclidean distance in the anatomical brain graph (MNI space). The length of a connection was estimated by subtracting the respective x, y, and z coordinates of two nodes i and j from each other and by square root transforming the sum of the squared differential scores. The average connection distance of all brain regions in the graph, as measured from their respective center of mass, was 78 mm. Long distant connections were defined as correlations with >78 mm length; local connections were defined as having ≤78 mm length.
Statistical analysis.
Statistical analysis focused on differences in functional connectivity and topology between wakefulness and PI-LOC. Analyses on graph measures across the range of connection probabilities (36–50%), weighted graph measures, and subsystem connectivity were performed using paired t tests; a false discovery rate (FDR) was applied to correct for multiple comparisons (q set at 0.05). Paired t tests were also calculated on the differential scores of topographical distance measures. Changes in the degree distribution were calculated on mean graphs of the range of connection probabilities using χ2 tests; distributions were split into high-degree nodes (≥45 connections) and low-degree nodes (≤45 connections). MATLAB (version 2009a; MathWorks) and SPSS software version 18.0 were used for all statistical and computational operations. Effects of propofol on PeEn were tested using 95% percentile bootstrap confidence intervals (threshold p < 0.05) based on the area under the receiver operating characteristic curve (AUC) by comparing results in clustered frontal electrodes according to the 10-20 scheme (Jordan et al., 2010).
Visualization.
Changes in connectivity strength were rendered on cortical surface with Caret v5.61 software [http://brainvis.wustl.edu/wiki (Van Essen et al., 2001)]. Cortical coloring is derived from the respective group values for each region of the Harvard–Oxford Atlas and mapped to the Caret PALS-B12 average template. Additionally, BrainNet Viewer v.1.0 (www.nitrc.org/projects/bnv) was used to visualize changes in connection density.
Results
Physiological measures
During PI-LOC, subjects showed a significant drop in systolic blood pressure (Table 1). We found no significant effect on heart rate or respiration by propofol. There was a decrease in oxyhemoglobin saturation during PI-LOC, but no statistically significant change for CO2 saturation compared with baseline. In the selected 11 subjects, no significant difference in individual's mean head movement was observed between baseline and PI-LOC. Due to problems in EEG signal recording, one subject had to be excluded from the PeEn analysis. PeEn of frontal EEG electrodes of remaining participants robustly separated wakefulness from PI-LOC: an AUC of 0.94 (0.76–1.00) of PeEn (mean values of 18 EEG channels) confirmed significant changes in EEG from wakefulness to PI-LOC, where maximum of sensitivity and specificity was found at a threshold of 3.45.
Table 1.
Physiological variables
| Parameter | Wakefulness | PI-LOC |
|---|---|---|
| Pulse (beats/min) | 77.5 ± 18.6 | 71.6 ± 19.0 |
| BPSystolic (mmHg)† | 132.9 ± 14.0 | 117.4 ± 13.1* |
| BPDiastolic (mmHg)† | 70.5 ± 10.8 | 61.1 ± 12.8 |
| SpO2 (%) | 98.3 ± 1.4 | 95.3 ± 1.6* |
| CO2 (%)† | 29.5 ± 11.7 | 35.3 ± 9.4 |
| RF (breaths/min)† | 11.3 ± 3.6 | 12.6 ± 4.1 |
Results are expressed as mean ± SD of the whole group (n = 15).
*Significance of wakefulness versus PI-LOC (paired t test, p < 0.05).
†BP data of one subject; CO2 and RF data of three subjects had to be excluded from analysis due to recording problems. BP (blood pressure), SpO2 (oxyhemoglobin saturation), CO2 (endexpiratory carbon dioxide), RF (respiratory rate).
Effects of PI-LOC on brain functional connectivity
Paired t tests yielded significant decreases in average connectivity strength S between wakefulness and PI-LOC across all scales of the wavelet decomposition, including MODWT scale 3 (Table 2). Significant reduction of regional connectivity strength was found in several regions of occipital, temporal, and parietal lobes (bilateral inferior, middle and superior temporal gyri, occipital, lingual and fusiform gyri, and superior parietal lobule) and in bilateral putamen and thalamus (Fig. 1). We further observed a significant reduction in whole-brain integration I (t(10) = −2.36, p = 0.039), i.e., the percentage of variance accounted for by the first principal component decreased from 36% in the awake resting condition to 27% in PI-LOC (Table 2).
Table 2.
Changes in functional connectivity and topological metrics
| Metric | Wakefulness | PI-LOC | t values | p values |
|---|---|---|---|---|
| Clustering coefficient, C* | 0.69 ± 0.03 | 0.65 ± 0.04 | −2.19 | 0.026 |
| Clustering ratio, γ* | 1.11 ± 0.03 | 1.19 ± 0.13 | 1.86 | 0.046 |
| Path length, L* | 1.42 ± 0.02 | 1.43 ± 0.05 | 0.27 | 0.393 |
| Path length ratio, λ* | 1.01 ± 0.01 | 1.00 ± 0.00 | −0.80 | 0.220 |
| Small-worldness, σ* | 1.10 ± 0.04 | 1.19 ± 0.13 | 1.90 | 0.043 |
| Connectivity strength, S† | 0.32 ± 0.09 | 0.22 ± 0.13 | −2.58 | 0.013 |
| Regional diversity, D† | 0.19 ± 0.02 | 0.20 ± 0.03 | 1.70 | 0.059 |
| Global integration, I† | 36.3 ± 8.9% | 27.4 ± 12.9% | −2.35 | 0.039 |
*Means (±SD), t and p values (one-sided) are provided. Metrics C, L, γ, λ, and σ were calculated on pooled graphs in the applied range of thresholds.
†Metrics S, D, and I were tested on the unthresholded connectivity matrices. Both analyses were performed on correlation coefficients of MODWT scale 3 (0.03–0.07 Hz).
Figure 1.
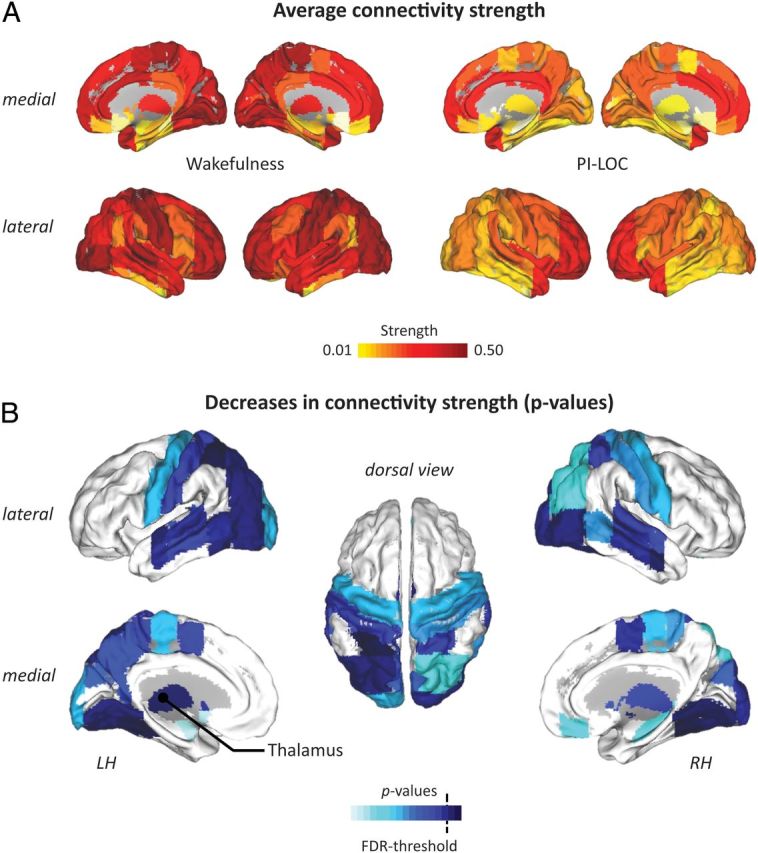
Effects of PI-LOC on functional connectivity strength. A, Average regional connectivity strength S during wakefulness and after loss of consciousness (PI-LOC); yellow to red colors indicate increasing connectivity strength. B, Lower figure shows significant p values of between-condition decreases in connectivity strength S of left and right hemisphere (LH and RH); light to dark blue colors indicate increasing significance. The dotted line depicts the FDR threshold (q = 0.05; see Materials and Methods).
Effects of PI-LOC on brain topological properties
In both conditions, the brain graphs showed a classical small-world topology (σ > 1). The following differences in the network's global/local organization were observed: Using one-sided paired t tests, we found a significant decrease of clustering coefficient C during PI-LOC (t(10) = −2.19, p = 0.026; Fig. 2; Table 2). Since clustering coefficient Crandom of comparable random graphs decreased relatively more strongly (t(10) = −2.48, p = 0.016), we found a significant increase in the clustering ratio γ (t(10) = 1.86, p = 0.046). There was no significant effect on path length L and path length ratio λ for the applied range of connection probabilities. Accordingly, the increase in small-worldness σ (t(10) = 1.90, p = 0.043) was driven by differences in the clustering ratio γ. Furthermore, we found significant differences in mean degree (Fig. 3A) and degree distribution of average graphs across the range of connection probabilities (χ2(9) = 44.10, p < 0.001), as well as a significant decrease in the proportion of high-degree nodes during PI-LOC [χ2(1) = 17.50, p < 0.001; degree distribution split into high-degree nodes (≥45 connections) and low-degree nodes (≤45 connections)]. Findings were robust across different brain parcellations (AAL template, regions of interest derived from Dosenbach et al., 2010), frequency bands of the MODWT, and an analysis with 0.01–0.1 Hz bandpass-filtered time series (data not shown).
Figure 2.

Effects of PI-LOC on brain topological properties. Figure shows topological changes of brain functional networks across wakefulness (black) and PI-LOC (gray). A–C, Summary statistics for clustering (C, Crandom, γ = C/Crandom) (A), path length (L, Lrandom, λ = L/Lrandom) (B), and small-worldness (σ = γ/λ) (C) were performed on MODWT scale 3 (0.03–0.07 Hz) throughout a range of 36–50% connection probability (Table 2). Error bars indicate 95% CI.
Figure 3.

Changes in mean degree and short/long-range connections. A, Group average networks for wakefulness and loss of consciousness. During PI-LOC, brain functional networks decreased in mean degree; depicted at correlation threshold r = 0.3. B, Ratio of long- to short-range connections at PI-LOC compared with wakefulness (mean and SEM values of all long/short-range correlations). Both long- and short-range correlations decreased significantly during PI-LOC; * indicates significance of wakefulness versus PI-LOC for one-sample t test (p < 0.05, one-sided). The reduction in long-range connections was significantly stronger; * indicates significance of wakefulness versus PI-LOC for paired t test (p < 0.05).
Effects of PI-LOC on subsystem connectivity
Connectivity within and between functionally defined subsystems (Mesulam, 2000) largely decreased during PI-LOC (Table 3). We found significant alterations of functional connectivity between association and subcortical subsystems (t(10) = −4.19, pFDR < 0.05). Moreover, nominally significant differences were noted for paralimbic and subcortical subsystems (t(10) = −2.49, p = 0.033, uncorrected) and primary sensory and subcortical subsystems (t(10) = −2.87, p = 0.016, uncorrected). We also observed decreases in connectivity strength within association subsystems (t(10) = −2.89, p = 0.015, uncorrected), between association and primary subsystems (t(10) = −2.62, p = 0.025, uncorrected), and limbic and primary sensory subsystems (t(10) = −2.33, p = 0.041, uncorrected). There was no significant change of connectivity within the primary sensory areas or between regions of the limbic subsystem. A repeated-measures ANOVA revealed a significant effect of subsystem on connectivity strength (F(14,140) = 24.58, p < 0.001) and a trend for a significant effect of state on connectivity strength (F(1,10) = 4.68, p = 0.056). The interaction between subsystem and state was significant (F(14,140) = 3.72, p < 0.001). Post hoc paired t tests on the delta scores (PI-LOC minus wakefulness) of each subsystem revealed that connectivity between the subcortical and association subsystem decreased more than connectivity within the association subsystem (t(10) = −1.98, one-sided p = 0.038) and than connectivity within the subcortical subsystem (t(10) = −2.21, one-sided p = 0.025).
Table 3.
Differences in subsystem connectivity
| Subsystems | Wakefulness | PI-LOC | t values |
|---|---|---|---|
| Neocortical connections | |||
| Association–association | 0.35 ± 0.09 | 0.23 ± 0.12 | −2.89* |
| Association–primary | 0.40 ± 0.12 | 0.24 ± 0.17 | −2.62* |
| Primary–primary | 0.50 ± 0.12 | 0.41 ± 0.15 | −1.21 |
| Neocortical/(para)limbic connections | |||
| Limbic–primary | 0.24 ± 0.12 | 0.13 ± 0.17 | −2.33* |
| Paralimbic–primary | 0.32 ± 0.10 | 0.24 ± 0.19 | −1.47 |
| Association–limbic | 0.20 ± 0.10 | 0.13 ± 0.13 | −1.82 |
| Association–paralimbic | 0.29 ± 0.10 | 0.23 ± 0.15 | −1.48 |
| Limbic/paralimbic connections | |||
| Limbic–limbic | 0.20 ± 0.10 | 0.21 ± 0.14 | 0.31 |
| Limbic–paralimbic | 0.24 ± 0.11 | 0.23 ± 0.14 | −0.29 |
| Paralimbic–paralimbic | 0.31 ± 0.11 | 0.31 ± 0.14 | −0.04 |
| Connections including the subcortical subsystem | |||
| Association–subcortical | 0.24 ± 0.12 | 0.12 ± 0.14 | −4.19** |
| Limbic–subcortical | 0.24 ± 0.12 | 0.21 ± 0.16 | −0.38 |
| Paralimbic–subcortical | 0.25 ± 0.11 | 0.16 ± 0.15 | −2.46* |
| Primary–subcortical | 0.32 ± 0.14 | 0.17 ± 0.18 | −2.87* |
| Subcortical–subcortical | 0.36 ± 0.11 | 0.26 ± 0.14 | −1.84 |
| Whole-brain connectivity | 0.31 ± 0.10 | 0.22 ± 0.14 | −2.57* |
Results are expressed as mean ± SD and t values of a paired t test.
*Significant at p < 0.05;
**significant at FDR-corrected p < 0.05.
Effects of PI-LOC on long- and short-range connectivity
There was a significant effect of PI-LOC on the ratio of long- to short-range connectivity (Fig. 3B). We found a significant decrease in long-range connections (>78 mm; delta scores: mean(wakefulness) − mean(PI-LOC); one-sample t(10) = 2.86, p = 0.016) and in short-range connections (<78 mm; one-sample t(10) = 2.22, p = 0.050). A paired t test on the mean delta scores revealed a stronger effect on long-range than on short-range connections (t(10) = 2.83, p = 0.016).
Discussion
In the present study, we applied graph theoretical analysis of spontaneous BOLD fluctuations in fMRI during PI-LOC, highlighting significant quantitative changes in the brain's spatiotemporal organization. First, we observed a decrease in general connectivity strength, particularly between higher-association cortices and subcortical regions. Second, changes in local and global connectivity metrics during PI-LOC revealed a decrease of whole-brain integration I, an increase in clustering ratio γ, and a reduced probability of high-degree nodes. Third, we found a pronounced reduction of long-range connections during PI-LOC.
Effects of PI-LOC on subcortical and cortical functional connectivity
Our results indicate that even though propofol acts rather globally on the brain's intrinsic connectivity, effects are not uniform and can be associated with structures that have been linked to functional circuits of arousal and awareness (Franks, 2008). This is in line with PET studies showing a global, yet locally graded, reduction in brain metabolism during propofol anesthesia (Fiset et al., 1999; Kaisti et al., 2003).
Consistent with recent fMRI studies on the effect of propofol, we observed systemic decreases in subcortico-cortical and corticocortical connectivity strength (Boveroux et al., 2010). Regionally, we found significantly reduced connectivity strength of the thalamus, putamen, and several multimodal associative and sensory cortices, primarily located in posterior regions of the brain. The exact role of thalamus and thalamic functional connectivity in anesthesia-induced loss of consciousness is still debated (Alkire et al., 2008). Although thalamus is very likely involved in PI-LOC, observed changes in connectivity may be attributed to direct effects of propofol on thalamic nuclei or indirect effects via thalamocortical feedback loops. A study in Parkinson's patients reported that propofol-induction lead to slowing in cortical before subcortical electrophysiologic patterns, which may indicate a potentially secondary role of thalamus in initiating loss of consciousness (Velly et al., 2007). In contrast, for the onset of NREM sleep, deactivation of thalamus was found to precede that of cortex (Magnin et al., 2010). Different effects in the sensitivity of cortical and subcortical structures to propofol may also be related to the disparity in the distribution of GABAA receptors (Alkire and Haier, 2001). Ex vivo and PET studies revealed a lower GABAA receptor density in subcortical structures, such as the thalamus, than in structures of the neocortex (Braestrup et al., 1977; Gründer et al., 2001). To estimate the significance of changes in thalamic functional connectivity between states of vigilance, a better understanding of the nature of infra-slow oscillations (ISOs) seems required (Hughes et al., 2011). In particular, to what degree ISOs modulate behaviorally relevant EEG oscillations and whether their spatiotemporal organization promotes functional integration between distant brain regions requires further attention (Leopold et al., 2003; He and Raichle, 2009, He et al., 2010).
In addition to subcortico-cortical connectivity changes, significant connectivity decreases of parieto-occipital brain structures support the view that this complex may be important for conscious processing (Alkire et al., 2008). Coordinated interplay between posterior and frontal association cortices has been related to modulation of internal and external awareness (Boly et al., 2008). Evidence for reduced coupling between posterior, parietal, and frontal cortices was reported in recent studies during deep NREM sleep (Horovitz et al., 2009; Sämann et al., 2011) and anesthesia (Boveroux et al., 2010; Schrouff et al., 2011). Reorganized connectivity of posterior nodes, such as PCC, has been reported already for moderate levels of propofol (Stamatakis et al., 2010).
In accordance with previous studies, the connectivity within primary sensory cortices was not affected (Boveroux et al., 2010). The decrease in connectivity strength between low-level primary sensory and high-level association cortices seems to support the notion that the brain's ability to process sensory information up the cortical hierarchy is likely to be impaired during PI-LOC (Heinke and Schwarzbauer, 2001). It is not clear whether this observation also relates to a decrease in cortico-thalamocortical coupling, as disconnection of the thalamus from the functional brain graph may not only prohibit flow of ascending information to the cortex, but also alter integration of information between cortical areas (Theyel et al., 2010).
Effects of PI-LOC on topology of brain functional graphs
We observed that brain graphs demonstrate small-world topology during both wakefulness and PI-LOC. A relative maintenance of global principles may reflect an adaptive reconfiguration of brain organization (Bassett et al., 2006), a process that has also been suggested for propofol-induced transitions of consciousness in a recent EEG study (Lee et al., 2010). A significant increase in values of the clustering ratio γ was found during PI-LOC compared with wakefulness. Of note, this change resulted from a proportionally stronger reduction of Crandom than C. The larger decrease in Crandom may be related to the random rewiring of a more locally connected graph and to differences in the degree distributions between the two states. The increase in the clustering ratio γ could favor more local and less globally integrated information processing. This global-to-local switch is further supported by the significant decrease in long-range connections during PI-LOC.
Our data also suggests that anesthetics particularly affect functional connectivity hubs, as found during normal wakefulness (Tomasi and Volkow, 2011), showing a decreased incidence of high-degree nodes and a significant reduction in connectivity strength for structures such as thalamus and multimodal association cortices during PI-LOC. These findings were also accompanied by altered whole-brain integration, that is, a higher spatiotemporal decomposition of the functional network. Similar results have been reported by high-density EEG studies during deep NREM sleep (Massimini et al., 2005) and midazolam-induced sedation (Ferrarelli et al., 2010).
Taking the view of major theories of consciousness, an increase of local clustering and a decrease in global coherence could mirror a decoupling of functionally related cortical processing modules, possibly relevant for large-scale information integration in the brain (Mashour, 2006). Whether changes in levels of consciousness may be represented in ISOs of neuronal activity and how modifications in the organization and temporal coherence of ISOs affect brain function should be further investigated (He and Raichle, 2009).
Methodological considerations
Some limitations regarding our data have to be carefully considered. First, spontaneous BOLD signal fluctuations are an indirect measure of neural activity. Although there is mounting evidence on the neuronal origin of the BOLD signal and its correlation with local field potentials (LFPs), the exact nature and behavioral relevance of its fluctuations is not yet fully understood (Goense et al., 2012). Results in favor of a neuronal origin of BOLD signal fluctuations have been reported by He et al. (2008), showing a similar spatial correlation structure of BOLD signal fluctuations and LFPs for the frequency range of slow cortical potentials. Conversely, research has shown that BOLD signal fluctuations may contain diverse nonneuronal contributors, such as fluctuations from peripheral physiological sources, movement, or artifacts during data collection (Birn et al., 2006; Chang and Glover, 2009). A better understanding of the neurovascular component of BOLD signal fluctuations is still needed. Even though we controlled for nuisance in our data and restricted our analysis to a frequency band <0.10 Hz, we cannot fully exclude that wavelet correlations used in our study have been influenced by other nonneuronal variables. One also has to consider secondary effects of propofol, which may mediate regional specific BOLD responses and complicate inferences from functional connectivity. To directly test whether differential effects on connectivity are due to drug exposure or loss of consciousness, future studies should investigate changes in network metrics at different dosages of propofol. However, our results overlap largely with summaries on the molecular effect of propofol (Franks, 2008) and studies that used PET to investigate its effect on brain metabolism (Kaisti et al., 2003). It has to be stressed, however, that other dosages or types of anesthetics may show quite different effects on functional connectivity (Stamatakis et al., 2010).
Second, one has to note that present graph theoretical analysis provides only a macroscopic view on brain functional organization and previous research has shown that how brain graphs are constructed, compared, and normalized to reference models may change results considerably (Zalesky et al., 2010; Wang et al., 2011). To control for a methodological bias, we compared metrics across different brain parcellations and performed analyses on degree-preserved graph partitions. Since correlation strength of functional connectivity was significantly reduced during PI-LOC, the usage of strength as a single criterion to gain binary graphs would have lead to significant differences in the number of edges, and hence, different results with regard to measures such as the network's characteristic path length. The exact functional relationship between connection strength and topology requires further investigation (Rubinov and Sporns, 2011).
Conclusion
Our findings emphasize the significance of brain functional networks as measured by spontaneous BOLD fluctuations during resting fMRI. They support the notion that PI-LOC may be associated with a disintegration of the spatiotemporal architecture of brain activity. Results indicate that PI-LOC is associated with decreased subcortico-cortical connectivity and a breakdown of connectivity within higher-order association cortices and between higher-order association and primary sensory cortices. Mirroring observations during deep NREM sleep, topological results indicate that intrinsic activity during PI-LOC is more locally segregated and less globally integrated.
Footnotes
We thank the Brain Mechanisms of Consciousness and Anesthesia Research Group: Adem Omerovic, Stefan Hartl, Eva Pichlmaier, Sabine Paprotny, Christine Preibisch, and Susanne Neufang.
References
- Achard S, Bullmore E. Efficiency and cost of economical brain functional networks. PLoS Comput Biol. 2007;3:e17. doi: 10.1371/journal.pcbi.0030017. [DOI] [PMC free article] [PubMed] [Google Scholar]
- Achard S, Salvador R, Whitcher B, Suckling J, Bullmore E. A resilient, low-frequency, small-world human brain functional network with highly connected association cortical hubs. J Neurosci. 2006;26:63–72. doi: 10.1523/JNEUROSCI.3874-05.2006. [DOI] [PMC free article] [PubMed] [Google Scholar]
- Alkire MT, Haier RJ. Correlating in vivo anaesthetic effects with ex vivo receptor density data supports a GABAergic mechanism of action for propofol, but not for isoflurane. Br J Anaesth. 2001;86:618–626. doi: 10.1093/bja/86.5.618. [DOI] [PubMed] [Google Scholar]
- Alkire MT, Haier RJ, Barker SJ, Shah NK, Wu JC, Kao YJ. Cerebral metabolism during propofol anesthesia in humans studied with positron emission tomography. Anesthesiology. 1995;82:393–403. doi: 10.1097/00000542-199502000-00010. discussion 27A. [DOI] [PubMed] [Google Scholar]
- Alkire MT, Hudetz AG, Tononi G. Consciousness and anesthesia. Science. 2008;322:876–880. doi: 10.1126/science.1149213. [DOI] [PMC free article] [PubMed] [Google Scholar]
- Ames A., 3rd CNS energy metabolism as related to function. Brain Res Brain Res Rev. 2000;34:42–68. doi: 10.1016/s0165-0173(00)00038-2. [DOI] [PubMed] [Google Scholar]
- Antkowiak B. Different actions of general anesthetics on the firing patterns of neocortical neurons mediated by the GABA(A) receptor. Anesthesiology. 1999;91:500–511. doi: 10.1097/00000542-199908000-00025. [DOI] [PubMed] [Google Scholar]
- Bandt C, Pompe B. Permutation entropy: a natural complexity measure for time series. Phys Rev Lett. 2002;88:174102. doi: 10.1103/PhysRevLett.88.174102. [DOI] [PubMed] [Google Scholar]
- Bassett DS, Bullmore E. Small-world brain networks. Neuroscientist. 2006;12:512–523. doi: 10.1177/1073858406293182. [DOI] [PubMed] [Google Scholar]
- Bassett DS, Meyer-Lindenberg A, Achard S, Duke T, Bullmore E. Adaptive reconfiguration of fractal small-world human brain functional networks. Proc Natl Acad Sci U S A. 2006;103:19518–19523. doi: 10.1073/pnas.0606005103. [DOI] [PMC free article] [PubMed] [Google Scholar]
- Bassett DS, Bullmore E, Verchinski BA, Mattay VS, Weinberger DR, Meyer-Lindenberg A. Hierarchical organization of human cortical networks in health and schizophrenia. J Neurosci. 2008;28:9239–9248. doi: 10.1523/JNEUROSCI.1929-08.2008. [DOI] [PMC free article] [PubMed] [Google Scholar]
- Bassett DS, Brown JA, Deshpande V, Carlson JM, Grafton ST. Conserved and variable architecture of human white matter connectivity. Neuroimage. 2011;54:1262–1279. doi: 10.1016/j.neuroimage.2010.09.006. [DOI] [PubMed] [Google Scholar]
- Birn RM, Diamond JB, Smith MA, Bandettini PA. Separating respiratory-variation-related fluctuations from neuronal-activity-related fluctuations in fMRI. Neuroimage. 2006;31:1536–1548. doi: 10.1016/j.neuroimage.2006.02.048. [DOI] [PubMed] [Google Scholar]
- Biswal B, Yetkin FZ, Haughton VM, Hyde JS. Functional connectivity in the motor cortex of resting human brain using echo-planar MRI. Magn Reson Med. 1995;34:537–541. doi: 10.1002/mrm.1910340409. [DOI] [PubMed] [Google Scholar]
- Biswal BB, Mennes M, Zuo XN, Gohel S, Kelly C, Smith SM, Beckmann CF, Adelstein JS, Buckner RL, Colcombe S, Dogonowski AM, Ernst M, Fair D, Hampson M, Hoptman MJ, Hyde JS, Kiviniemi VJ, Kötter R, Li SJ, Lin CP, et al. Toward discovery science of human brain function. Proc Natl Acad Sci U S A. 2010;107:4734–4739. doi: 10.1073/pnas.0911855107. [DOI] [PMC free article] [PubMed] [Google Scholar]
- Boly M, Phillips C, Tshibanda L, Vanhaudenhuyse A, Schabus M, Dang-Vu TT, Moonen G, Hustinx R, Maquet P, Laureys S. Intrinsic brain activity in altered states of consciousness: how conscious is the default mode of brain function? Ann N Y Acad Sci. 2008;1129:119–129. doi: 10.1196/annals.1417.015. [DOI] [PMC free article] [PubMed] [Google Scholar]
- Boveroux P, Vanhaudenhuyse A, Bruno MA, Noirhomme Q, Lauwick S, Luxen A, Degueldre C, Plenevaux A, Schnakers C, Phillips C, Brichant JF, Bonhomme V, Maquet P, Greicius MD, Laureys S, Boly M. Breakdown of within- and between-network resting state functional magnetic resonance imaging connectivity during propofol-induced loss of consciousness. Anesthesiology. 2010;113:1038–1053. doi: 10.1097/ALN.0b013e3181f697f5. [DOI] [PubMed] [Google Scholar]
- Braestrup C, Albrechtsen R, Squires RF. High densities of benzodiazepine receptors in human cortical areas. Nature. 1977;269:702–704. doi: 10.1038/269702a0. [DOI] [PubMed] [Google Scholar]
- Braun AR, Balkin TJ, Wesenten NJ, Carson RE, Varga M, Baldwin P, Selbie S, Belenky G, Herscovitch P. Regional cerebral blood flow throughout the sleep-wake cycle: an H2(15)O PET study. Brain. 1997;120:1173–1197. doi: 10.1093/brain/120.7.1173. [DOI] [PubMed] [Google Scholar]
- Brett M, Anton JL, Valabregue R, Poline JP. Region of interest analysis using a SPM toolbox. Presented at the 8th International Conference on Functional Mapping of the Human Brain; Sendai, Japan. 2002. [Google Scholar]
- Brown EN, Purdon PL, Van Dort CJ. General anesthesia and altered states of arousal: a systems neuroscience analysis. Annu Rev Neurosci. 2011;34:601–628. doi: 10.1146/annurev-neuro-060909-153200. [DOI] [PMC free article] [PubMed] [Google Scholar]
- Bullmore E, Sporns O. Complex brain networks: graph theoretical analysis of structural and functional systems. Nat Rev Neurosci. 2009;10:186–198. doi: 10.1038/nrn2575. [DOI] [PubMed] [Google Scholar]
- Campbell K, Marsden P, Hurlbert J. Social resources and socio-economic status. Soc Networks. 1986;8:97–117. [Google Scholar]
- Chang C, Glover GH. Effects of model-based physiological noise correction on default mode network anti-correlations and correlations. Neuroimage. 2009;47:1448–1459. doi: 10.1016/j.neuroimage.2009.05.012. [DOI] [PMC free article] [PubMed] [Google Scholar]
- Cordes D, Haughton VM, Arfanakis K, Carew JD, Turski PA, Moritz CH, Quigley MA, Meyerand ME. Frequencies contributing to functional connectivity in the cerebral cortex in “resting-state” data. AJNR Am J Neuroradiol. 2001;22:1326–1333. [PMC free article] [PubMed] [Google Scholar]
- Dehaene S, Changeux JP. Ongoing spontaneous activity controls access to consciousness: a neuronal model for inattentional blindness. PLoS Biol. 2005;3:e141. doi: 10.1371/journal.pbio.0030141. [DOI] [PMC free article] [PubMed] [Google Scholar]
- Dosenbach NU, Nardos B, Cohen AL, Fair DA, Power JD, Church JA, Nelson SM, Wig GS, Vogel AC, Lessov-Schlaggar CN, Barnes KA, Dubis JW, Feczko E, Coalson RS, Pruett JR, Jr, Barch DM, Petersen SE, Schlaggar BL. Prediction of individual brain maturity using fMRI. Science. 2010;329:1358–1361. doi: 10.1126/science.1194144. [DOI] [PMC free article] [PubMed] [Google Scholar]
- Ferrarelli F, Massimini M, Sarasso S, Casali A, Riedner BA, Angelini G, Tononi G, Pearce RA. Breakdown in cortical effective connectivity during midazolam-induced loss of consciousness. Proc Natl Acad Sci U S A. 2010;107:2681–2686. doi: 10.1073/pnas.0913008107. [DOI] [PMC free article] [PubMed] [Google Scholar]
- Fiset P, Paus T, Daloze T, Plourde G, Meuret P, Bonhomme V, Hajj-Ali N, Backman SB, Evans AC. Brain mechanisms of propofol-induced loss of consciousness in humans: a positron emission tomographic study. J Neurosci. 1999;19:5506–5513. doi: 10.1523/JNEUROSCI.19-13-05506.1999. [DOI] [PMC free article] [PubMed] [Google Scholar]
- Fox MD, Raichle ME. Spontaneous fluctuations in brain activity observed with functional magnetic resonance imaging. Nat Rev Neurosci. 2007;8:700–711. doi: 10.1038/nrn2201. [DOI] [PubMed] [Google Scholar]
- Fox MD, Corbetta M, Snyder AZ, Vincent JL, Raichle ME. Spontaneous neuronal activity distinguishes human dorsal and ventral attention systems. Proc Natl Acad Sci U S A. 2006;103:10046–10051. doi: 10.1073/pnas.0604187103. [DOI] [PMC free article] [PubMed] [Google Scholar]
- Fox MD, Snyder AZ, Vincent JL, Raichle ME. Intrinsic fluctuations within cortical systems account for intertrial variability in human behavior. Neuron. 2007;56:171–184. doi: 10.1016/j.neuron.2007.08.023. [DOI] [PubMed] [Google Scholar]
- Fox MD, Zhang D, Snyder AZ, Raichle ME. The global signal and observed anticorrelated resting state brain networks. J Neurophysiol. 2009;101:3270–3283. doi: 10.1152/jn.90777.2008. [DOI] [PMC free article] [PubMed] [Google Scholar]
- Franks NP. General anaesthesia: from molecular targets to neuronal pathways of sleep and arousal. Nat Rev Neurosci. 2008;9:370–386. doi: 10.1038/nrn2372. [DOI] [PubMed] [Google Scholar]
- Goense J, Whittingstall K, Logothetis NK. Neural and BOLD responses across the brain. WIREs Cogn Sci. 2012;3:75–86. doi: 10.1002/wcs.153. [DOI] [PubMed] [Google Scholar]
- Greicius MD, Krasnow B, Reiss AL, Menon V. Functional connectivity in the resting brain: a network analysis of the default mode hypothesis. Proc Natl Acad Sci U S A. 2003;100:253–258. doi: 10.1073/pnas.0135058100. [DOI] [PMC free article] [PubMed] [Google Scholar]
- Greicius MD, Kiviniemi V, Tervonen O, Vainionpää V, Alahuhta S, Reiss AL, Menon V. Persistent default-mode network connectivity during light sedation. Hum Brain Mapp. 2008;29:839–847. doi: 10.1002/hbm.20537. [DOI] [PMC free article] [PubMed] [Google Scholar]
- Gründer G, Siessmeier T, Lange-Asschenfeldt C, Vernaleken I, Buchholz HG, Stoeter P, Drzezga A, Lüddens H, Rösch F, Bartenstein P. [18F]fluoroethylflumazenil: a novel tracer for PET imaging of human benzodiazepine receptors. Eur J Nucl Med. 2001;28:1463–1470. doi: 10.1007/s002590100594. [DOI] [PubMed] [Google Scholar]
- Hagmann P, Cammoun L, Gigandet X, Meuli R, Honey CJ, Wedeen VJ, Sporns O. Mapping the structural core of human cerebral cortex. PLoS Biol. 2008;6:e159. doi: 10.1371/journal.pbio.0060159. [DOI] [PMC free article] [PubMed] [Google Scholar]
- Hampson M, Driesen NR, Skudlarski P, Gore JC, Constable RT. Brain connectivity related to working memory performance. J Neurosci. 2006;26:13338–13343. doi: 10.1523/JNEUROSCI.3408-06.2006. [DOI] [PMC free article] [PubMed] [Google Scholar]
- Hayasaka S, Laurienti PJ. Comparison of characteristics between region-and voxel-based network analyses in resting-state fMRI data. Neuroimage. 2010;50:499–508. doi: 10.1016/j.neuroimage.2009.12.051. [DOI] [PMC free article] [PubMed] [Google Scholar]
- He BJ, Raichle ME. The fMRI signal, slow cortical potential and consciousness. Trends Cogn Sci. 2009;13:302–309. doi: 10.1016/j.tics.2009.04.004. [DOI] [PMC free article] [PubMed] [Google Scholar]
- He BJ, Snyder AZ, Zempel JM, Smyth MD, Raichle ME. Electrophysiological correlates of the brain's intrinsic large-scale functional architecture. Proc Natl Acad Sci U S A. 2008;105:16039–16044. doi: 10.1073/pnas.0807010105. [DOI] [PMC free article] [PubMed] [Google Scholar]
- He BJ, Zempel JM, Snyder AZ, Raichle ME. The temporal structures and functional significance of scale-free brain activity. Neuron. 2010;66:353–369. doi: 10.1016/j.neuron.2010.04.020. [DOI] [PMC free article] [PubMed] [Google Scholar]
- Heinke W, Schwarzbauer C. Subanesthetic isoflurane affects task-induced brain activation in a highly specific manner: a functional magnetic resonance imaging study. Anesthesiology. 2001;94:973–981. doi: 10.1097/00000542-200106000-00010. [DOI] [PubMed] [Google Scholar]
- Horovitz SG, Fukunaga M, de Zwart JA, van Gelderen P, Fulton SC, Balkin TJ, Duyn JH. Low frequency BOLD fluctuations during resting wakefulness and light sleep: a simultaneous EEG-fMRI study. Hum Brain Mapp. 2008;29:671–682. doi: 10.1002/hbm.20428. [DOI] [PMC free article] [PubMed] [Google Scholar]
- Horovitz SG, Braun AR, Carr WS, Picchioni D, Balkin TJ, Fukunaga M, Duyn JH. Decoupling of the brain's default mode network during deep sleep. Proc Natl Acad Sci U S A. 2009;106:11376–11381. doi: 10.1073/pnas.0901435106. [DOI] [PMC free article] [PubMed] [Google Scholar]
- Hughes SW, Lorincz ML, Parri HR, Crunelli V. Infraslow (<0.1 Hz) oscillations in thalamic relay nuclei basic mechanisms and significance to health and disease states. Prog Brain Res. 2011;193:145–162. doi: 10.1016/B978-0-444-53839-0.00010-7. [DOI] [PMC free article] [PubMed] [Google Scholar]
- Humphries MD, Gurney K. Network ‘small-world-ness’: a quantitative method for determining canonical network equivalence. PLoS One. 2008;3:e0002051. doi: 10.1371/journal.pone.0002051. [DOI] [PMC free article] [PubMed] [Google Scholar]
- James R, Glen JB. Synthesis, biological evaluation, and preliminary structure-activity considerations of a series of alkylphenols as intravenous anesthetic agents. J Med Chem. 1980;23:1350–1357. doi: 10.1021/jm00186a013. [DOI] [PubMed] [Google Scholar]
- Johnston AJ, Steiner LA, Chatfield DA, Coleman MR, Coles JP, Al-Rawi PG, Menon DK, Gupta AK. Effects of propofol on cerebral oxygenation and metabolism after head injury. Br J Anaesth. 2003;91:781–786. doi: 10.1093/bja/aeg256. [DOI] [PubMed] [Google Scholar]
- Jordan D, Stockmanns G, Kochs EF, Pilge S, Schneider G. Electroencephalographic order pattern analysis for the separation of consciousness and unconsciousness: an analysis of approximate entropy, permutation entropy, recurrence rate, and phase coupling of order recurrence plots. Anesthesiology. 2008;109:1014–1022. doi: 10.1097/ALN.0b013e31818d6c55. [DOI] [PubMed] [Google Scholar]
- Jordan D, Steiner M, Kochs EF, Schneider G. A program for computing the prediction probability and the related receiver operating characteristic graph. Anesth Analg. 2010;111:1416–1421. doi: 10.1213/ANE.0b013e3181fb919e. [DOI] [PubMed] [Google Scholar]
- Kaisti KK, Långsjö JW, Aalto S, Oikonen V, Sipilä H, Teräs M, Hinkka S, Metsähonkala L, Scheinin H. Effects of sevoflurane, propofol, and adjunct nitrous oxide on regional cerebral blood flow, oxygen consumption, and blood volume in humans. Anesthesiology. 2003;99:603–613. doi: 10.1097/00000542-200309000-00015. [DOI] [PubMed] [Google Scholar]
- Larson-Prior LJ, Zempel JM, Nolan TS, Prior FW, Snyder AZ, Raichle ME. Cortical network functional connectivity in the descent to sleep. Proc Natl Acad Sci U S A. 2009;106:4489–4494. doi: 10.1073/pnas.0900924106. [DOI] [PMC free article] [PubMed] [Google Scholar]
- Latora V, Marchiori M. Efficient behavior of small-world networks. Phys Rev Lett. 2001;87:198701. doi: 10.1103/PhysRevLett.87.198701. [DOI] [PubMed] [Google Scholar]
- Laureys S, Perrin F, Faymonville ME, Schnakers C, Boly M, Bartsch V, Majerus S, Moonen G, Maquet P. Cerebral processing in the minimally conscious state. Neurology. 2004;63:916–918. doi: 10.1212/01.wnl.0000137421.30792.9b. [DOI] [PubMed] [Google Scholar]
- Lee U, Oh G, Kim S, Noh G, Choi B, Mashour GA. Brain networks maintain a scale-free organization across consciousness, anesthesia, and recovery: evidence for adaptive reconfiguration. Anesthesiology. 2010;113:1081–1091. doi: 10.1097/ALN.0b013e3181f229b5. [DOI] [PMC free article] [PubMed] [Google Scholar]
- Leopold DA, Murayama Y, Logothetis NK. Very slow activity fluctuations in monkey visual cortex: implications for functional brain imaging. Cereb Cortex. 2003;13:422–433. doi: 10.1093/cercor/13.4.422. [DOI] [PubMed] [Google Scholar]
- Liu Y, Liang M, Zhou Y, He Y, Hao Y, Song M, Yu C, Liu H, Liu Z, Jiang T. Disrupted small-world networks in schizophrenia. Brain. 2008;131:945–961. doi: 10.1093/brain/awn018. [DOI] [PubMed] [Google Scholar]
- Lydic R, Baghdoyan HA. Sleep, anesthesiology, and the neurobiology of arousal state control. Anesthesiology. 2005;103:1268–1295. doi: 10.1097/00000542-200512000-00024. [DOI] [PubMed] [Google Scholar]
- Lynall ME, Bassett DS, Kerwin R, McKenna PJ, Kitzbichler M, Muller U, Bullmore E. Functional connectivity and brain networks in schizophrenia. J Neurosci. 2010;30:9477–9487. doi: 10.1523/JNEUROSCI.0333-10.2010. [DOI] [PMC free article] [PubMed] [Google Scholar]
- Magnin M, Rey M, Bastuji H, Guillemant P, Mauguière F, Garcia-Larrea L. Thalamic deactivation at sleep onset precedes that of the cerebral cortex in humans. Proc Natl Acad Sci U S A. 2010;107:3829–3833. doi: 10.1073/pnas.0909710107. [DOI] [PMC free article] [PubMed] [Google Scholar]
- Marsh B, White M, Morton N, Kenny GN. Pharmacokinetic model driven infusion of propofol in children. Br J Anaesth. 1991;67:41–48. doi: 10.1093/bja/67.1.41. [DOI] [PubMed] [Google Scholar]
- Mashour GA. Integrating the science of consciousness and anesthesia. Anesth Analg. 2006;103:975–982. doi: 10.1213/01.ane.0000232442.69757.4a. [DOI] [PubMed] [Google Scholar]
- Maslov S, Sneppen K. Specificity and stability in topology of protein networks. Science. 2002;296:910–913. doi: 10.1126/science.1065103. [DOI] [PubMed] [Google Scholar]
- Massimini M, Ferrarelli F, Huber R, Esser SK, Singh H, Tononi G. Breakdown of cortical effective connectivity during sleep. Science. 2005;309:2228–2232. doi: 10.1126/science.1117256. [DOI] [PubMed] [Google Scholar]
- Mesulam MM. Principles of behavioral and cognitive neurology. 2nd edition. Oxford: Oxford UP; 2000. [Google Scholar]
- Mhuircheartaigh RN, Rosenorn-Lanng D, Wise R, Jbabdi S, Rogers R, Tracey I. Cortical and subcortical connectivity changes during decreasing levels of consciousness in humans: a functional magnetic resonance imaging study using propofol. J Neurosci. 2010;30:9095–9102. doi: 10.1523/JNEUROSCI.5516-09.2010. [DOI] [PMC free article] [PubMed] [Google Scholar]
- Murphy K, Birn RM, Handwerker DA, Jones TB, Bandettini PA. The impact of global signal regression on resting state correlations: are anti-correlated networks introduced? Neuroimage. 2009;44:893–905. doi: 10.1016/j.neuroimage.2008.09.036. [DOI] [PMC free article] [PubMed] [Google Scholar]
- Percival DB, Walden AT. Wavelet methods for time series analysis. Cambridge: Cambridge UP; 2000. [Google Scholar]
- Ramsay MA, Savege TM, Simpson BR, Goodwin R. Controlled sedation with alphaxalone-alphadolone. Br Med J. 1974;2:656–659. doi: 10.1136/bmj.2.5920.656. [DOI] [PMC free article] [PubMed] [Google Scholar]
- Rubinov M, Sporns O. Complex network measures of brain connectivity: uses and interpretations. Neuroimage. 2010;52:1059–1069. doi: 10.1016/j.neuroimage.2009.10.003. [DOI] [PubMed] [Google Scholar]
- Rubinov M, Sporns O. Weight-conserving characterization of complex functional brain networks. Neuroimage. 2011;56:2068–2079. doi: 10.1016/j.neuroimage.2011.03.069. [DOI] [PubMed] [Google Scholar]
- Sämann PG, Wehrle R, Hoehn D, Spoormaker VI, Peters H, Tully C, Holsboer F, Czisch M. Development of the brain's default mode network from wakefulness to slow wave sleep. Cereb Cortex. 2011;21:2082–2093. doi: 10.1093/cercor/bhq295. [DOI] [PubMed] [Google Scholar]
- Salvador R, Suckling J, Schwarzbauer C, Bullmore E. Undirected graphs of frequency-dependent functional connectivity in whole brain networks. Philos Trans R Soc Lond B Biol Sci. 2005;360:937–946. doi: 10.1098/rstb.2005.1645. [DOI] [PMC free article] [PubMed] [Google Scholar]
- Schölvinck ML, Maier A, Ye FQ, Duyn JH, Leopold DA. Neural basis of global resting-state fMRI activity. Proc Natl Acad Sci U S A. 2010;107:10238–10243. doi: 10.1073/pnas.0913110107. [DOI] [PMC free article] [PubMed] [Google Scholar]
- Schrouff J, Perlbarg V, Boly M, Marrelec G, Boveroux P, Vanhaudenhuyse A, Bruno MA, Laureys S, Phillips C, Pélégrini-Issac M, Maquet P, Benali H. Brain functional integration decreases during propofol-induced loss of consciousness. Neuroimage. 2011;57:198–205. doi: 10.1016/j.neuroimage.2011.04.020. [DOI] [PubMed] [Google Scholar]
- Schwarz AJ, McGonigle J. Negative edges and soft thresholding in complex network analysis of resting state functional connectivity data. Neuroimage. 2011;55:1132–1146. doi: 10.1016/j.neuroimage.2010.12.047. [DOI] [PubMed] [Google Scholar]
- Seeley WW, Menon V, Schatzberg AF, Keller J, Glover GH, Kenna H, Reiss AL, Greicius MD. Dissociable intrinsic connectivity networks for salience processing and executive control. J Neurosci. 2007;27:2349–2356. doi: 10.1523/JNEUROSCI.5587-06.2007. [DOI] [PMC free article] [PubMed] [Google Scholar]
- Shmueli K, van Gelderen P, de Zwart JA, Horovitz SG, Fukunaga M, Jansma JM, Duyn JH. Low-frequency fluctuations in the cardiac rate as a source of variance in the resting-state fMRI BOLD signal. Neuroimage. 2007;38:306–320. doi: 10.1016/j.neuroimage.2007.07.037. [DOI] [PMC free article] [PubMed] [Google Scholar]
- Simard D, Nadeau L, Kroger H. Fastest learning in small-world neuronal networks. Phys Lett A. 2005;336:8–15. [Google Scholar]
- Smith SM, Jenkinson M, Woolrich MW, Beckmann CF, Behrens TE, Johansen-Berg H, Bannister PR, De Luca M, Drobnjak I, Flitney DE, Niazy RK, Saunders J, Vickers J, Zhang Y, De Stefano N, Brady JM, Matthews PM. Advances in functional and structural MR image analysis and implementation as FSL. Neuroimage. 2004;23(Suppl 1):S208–S219. doi: 10.1016/j.neuroimage.2004.07.051. [DOI] [PubMed] [Google Scholar]
- Spoormaker VI, Schröter MS, Gleiser PM, Andrade KC, Dresler M, Wehrle R, Samann PG, Czisch M. Development of a large-scale functional brain network during human non-rapid eye movement sleep. J Neurosci. 2010;30:11379–11387. doi: 10.1523/JNEUROSCI.2015-10.2010. [DOI] [PMC free article] [PubMed] [Google Scholar]
- Sporns O, Zwi JD. The small world of the cerebral cortex. Neuroinformatics. 2004;2:145–162. doi: 10.1385/NI:2:2:145. [DOI] [PubMed] [Google Scholar]
- Stam CJ, Jones BF, Nolte G, Breakspear M, Scheltens P. Small-world networks and functional connectivity in Alzheimer's disease. Cereb Cortex. 2007;17:92–99. doi: 10.1093/cercor/bhj127. [DOI] [PubMed] [Google Scholar]
- Stamatakis EA, Adapa RM, Absalom AR, Menon DK. Changes in resting neural connectivity during propofol sedation. PLoS One. 2010;5:e14224. doi: 10.1371/journal.pone.0014224. [DOI] [PMC free article] [PubMed] [Google Scholar]
- Theyel BB, Llano DA, Sherman SM. The corticothalamocortical circuit drives higher-order cortex in the mouse. Nat Neurosci. 2010;13:84–88. doi: 10.1038/nn.2449. [DOI] [PMC free article] [PubMed] [Google Scholar]
- Tomasi D, Volkow ND. Association between functional connectivity hubs and brain networks. Cereb Cortex. 2011;21:2003–2013. doi: 10.1093/cercor/bhq268. [DOI] [PMC free article] [PubMed] [Google Scholar]
- Tononi G. An information integration theory of consciousness. BMC Neurosci. 2004;5:42. doi: 10.1186/1471-2202-5-42. [DOI] [PMC free article] [PubMed] [Google Scholar]
- Tzourio-Mazoyer N, Landeau B, Papathanassiou D, Crivello F, Etard O, Delcroix N, Mazoyer B, Joliot M. Automated anatomical labeling of activations in SPM using a macroscopic anatomical parcellation of the MNI MRI single-subject brain. Neuroimage. 2002;15:273–289. doi: 10.1006/nimg.2001.0978. [DOI] [PubMed] [Google Scholar]
- van den Heuvel MP, Stam CJ, Kahn RS, Hulshoff Pol HE. Efficiency of functional brain networks and intellectual performance. J Neurosci. 2009;29:7619–7624. doi: 10.1523/JNEUROSCI.1443-09.2009. [DOI] [PMC free article] [PubMed] [Google Scholar]
- Van Dijk KR, Sabuncu MR, Buckner RL. The influence of head motion on intrinsic functional connectivity MRI. Neuroimage. 2012;59:431–438. doi: 10.1016/j.neuroimage.2011.07.044. [DOI] [PMC free article] [PubMed] [Google Scholar]
- Van Essen DC, Drury HA, Dickson J, Harwell J, Hanlon D, Anderson CH. An integrated software suite for surface-based analyses of cerebral cortex. J Am Med Inform Assoc. 2001;8:443–459. doi: 10.1136/jamia.2001.0080443. [DOI] [PMC free article] [PubMed] [Google Scholar]
- Velly LJ, Rey MF, Bruder NJ, Gouvitsos FA, Witjas T, Regis JM, Peragut JC, Gouin FM. Differential dynamic of action on cortical and subcortical structures of anesthetic agents during induction of anesthesia. Anesthesiology. 2007;107:202–212. doi: 10.1097/01.anes.0000270734.99298.b4. [DOI] [PubMed] [Google Scholar]
- Veselis RA, Feshchenko VA, Reinsel RA, Beattie B, Akhurst TJ. Propofol and thiopental do not interfere with regional cerebral blood flow response at sedative concentrations. Anesthesiology. 2005;102:26–34. doi: 10.1097/00000542-200501000-00008. [DOI] [PubMed] [Google Scholar]
- Wang JH, Zuo XN, Gohel S, Milham MP, Biswal BB, He Y. Graph theoretical analysis of functional brain networks: test-retest evaluation on short- and long-term resting-state functional MRI data. PLoS One. 2011;6:e21976. doi: 10.1371/journal.pone.0021976. [DOI] [PMC free article] [PubMed] [Google Scholar]
- Watts DJ, Strogatz SH. Collective dynamics of ‘small-world’ networks. Nature. 1998;393:440–442. doi: 10.1038/30918. [DOI] [PubMed] [Google Scholar]
- Weissenbacher A, Kasess C, Gerstl F, Lanzenberger R, Moser E, Windischberger C. Correlations and anticorrelations in resting-state functional connectivity MRI: a quantitative comparison of preprocessing strategies. Neuroimage. 2009;47:1408–1416. doi: 10.1016/j.neuroimage.2009.05.005. [DOI] [PubMed] [Google Scholar]
- Zalesky A, Fornito A, Harding IH, Cocchi L, Yücel M, Pantelis C, Bullmore ET. Whole-brain anatomical networks: does the choice of nodes matter? Neuroimage. 2010;50:970–983. doi: 10.1016/j.neuroimage.2009.12.027. [DOI] [PubMed] [Google Scholar]
- Zhang D, Snyder AZ, Fox MD, Sansbury MW, Shimony JS, Raichle ME. Intrinsic functional relations between human cerebral cortex and thalamus. J Neurophysiol. 2008;100:1740–1748. doi: 10.1152/jn.90463.2008. [DOI] [PMC free article] [PubMed] [Google Scholar]